Benthic Habitat Mapping
•
2 gefällt mir•695 views

1) The Pacific Islands Fisheries Science Center is mapping benthic habitats around 55 islands and atolls in the U.S.-Affiliated Pacific Islands using multibeam sonar and optical groundtruthing to characterize coral reef ecosystems. 2) From 2002-2007, multibeam mapping was conducted around the Northwestern Hawaiian Islands, Main Hawaiian Islands, Commonwealth of the Northern Mariana Islands, American Samoa, and Pacific Remote Island Areas. 3) In 2008-2009, priority areas for additional mapping include French Frigate Shoals and Pearl and Hermes Reef in the Northwestern Hawaiian Islands to fill gaps in existing data.

Empfohlen
Empfohlen
Weitere ähnliche Inhalte
Ähnlich wie Benthic Habitat Mapping
Ähnlich wie Benthic Habitat Mapping (20)
Mehr von Hawaii Geographic Information Coordinating Council
Mehr von Hawaii Geographic Information Coordinating Council (20)
Kürzlich hochgeladen
Kürzlich hochgeladen (20)
Benthic Habitat Mapping
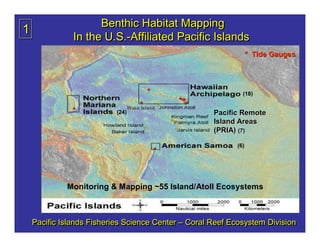
- 1. Benthic Habitat Mapping 1 In the U.S.-Affiliated Pacific Islands U.S.-Affiliated * Tide Gauges * (18) *** * Wake Island ** * (24) Pacific Remote Island Areas (PRIA) (7) * * * (6) Monitoring & Mapping ~55 Island/Atoll Ecosystems Pacific Islands Fisheries Science Center – Coral Reef Ecosystem Division
- 2. 2 U.S. Coral Reef Task Force Goal Produce comprehensive digital maps of all shallow (<30m) coral reef ecosystems in the United States and characterize priority moderate-depth reef systems by 2009.
- 3. 3 PIFSC/CRED Benthic Habitat Mapping Methods IKONOS Imagery IKONOS Imagery Multibeam Surveys Optical Groundtruthing – Optical Groundtruthing – Optical Groundtruthing Optical Groundtruthing ROV, TOAD, AUV ROV, TOAD, AUV Towed Diver Surveys Towed Diver Surveys
- 4. 4 NOAA CRED and PIBHMC Multibeam Mapping Results (2002-2007) (2002-2007) R/V AHI Reson 8101ER (240 kHz) NOAA Ship Hi’ialakai EM300 (30 kHz) EM3002 (300 kHz) Moderate Depth Deep Coverage Area Years 15-200 m (km2) % Covered > 200m ( km2) NWHI 2002-2006 3,338/12,167 28% 38,367 MHI 2005-2006 3,018/5,430 95% n/a CNMI/Guam 2003, 2007 400/464 86% 12,695 Am. Samoa 2004, 2006 410/410 100% 975 PRIA 2006 100/121 82% 4,300 7266/18592 39% 56,708
- 5. 5 PIFSC-CRED Mapping in American Samoa – 2004 & 2006 Tutuila Ofu and Olosega Ta′u Rose Atoll Swains Island
- 6. 6 MHI Data Synthesis PIFSC/CRED and Univ. of Hawaii Shallow (15-300 m) Shallow (15-300 m) Unmapped areas include high resolution high resolution harbor surveys and gaps NOAA surveys NOAA surveys between LIDAR and 2005-2006: 2005-2006: multibeam bathymetry Ni′ihau, Kohala, Ni′ihau, Kohala, Ni′ihau Penguin Bank, Penguin Bank, N. Shore N. Shore Moloka′i N. Shore Moloka′i Moloka′i Kohala Penguin Big Island Bank 50-m grid available at http://www.soest.hawaii.edu/hmrg/Multibeam/explorer.php 50- grid available at http://www.soest.hawaii.edu/hmrg/Multibeam/explorer.php 50-m http://www.soest.hawaii.edu/hmrg/Multibeam/explorer.php
- 7. 7 PIFSC/CRED Multibeam Data Collected in NWHI 2002-2006 Gaps include ~ 9,000 km2 of banktop (15-100 m) areas and most of the deep water (15- seafloor (> 100 m) within the boundaries of the Papahā naumokuā Papahānaumokuākea Marine National Monument
- 8. 8 Multibeam Data Collected in CNMI and Guam: 2003-2007 Maug Pagan Saipan, Tinian and Rota Harbors surveyed to IHO standards in 2007 using R/V AHI Guam in collaboration with OCS, U.S. Navy and CNMI Port Authority. Tinian Aguijan Areas that still need multibeam Areas that still need multibeam surveys are circled in black surveys are circled in black
- 9. Bathymetry Bathymetry 9 gaps gaps Baker Jarvis Pacific Remote Pacific Remote Island Areas Island Areas 2006 2006
- 10. 10 PIFSC-CRED Multibeam Mapping PIFSC-CRED at Wake Island -- 2007
- 11. 11 Bathymetric Mapping Completion • Many areas completely mapped in 20-1000 m. 20-1000 • Guam, Rota, and Aguijan 15-300 m ~ 1 month 15-300 • Kingman & Johnston 15-50 m ~ 1 week 15-50 • MHI – Harbor surveys using R/V AHI are currently under discussion with NOAA Office of Coast Survey (OCS) – Areas between LIDAR and deeper multibeam coverage could be mapped with R/V AHI ~ 3-6 mos. 3-6 Need mandate and support from other mgmt. groups. • NWHI – ~9,000 km2 of bank tops (15-100 m) remain 2 (15-100 ~ 10-20 years at 15-30 days/yr. 10-20 15-30 – Deep (> 100 m) mapping in MNM ~ 2 mos. • LIDAR could be used in most areas in < 30 m
- 12. 12 Key Mapping • • Pacific Consortium of Undersea Pacific Consortium of Undersea Habitat Centers (proposed) Habitat Centers (proposed) Partnerships • • CNMI and Guam CNMI and Guam – – U.S. Navy U.S. Navy – – NOAA Office of Coast Survey NOAA Office of Coast Survey – – CNMI Port Authority CNMI Port Authority – – National Park Service National Park Service – – U.S. Geological Survey U.S. Geological Survey – – Guam Fisherman’s Co-op Guam Fisherman’ Co- Fisherman’s Co-op – – University of Guam University of Guam • • Hawaiian Archipelago Hawaiian Archipelago – – Papahānaumokuā Papahānaumokuākea MNM Papahānaumokuākea MNM – – Div. of Land & Natural Resources Div. of Land & Natural Resources – – U.S. Fish and Wildlife Service U.S. Fish and Wildlife Service – – University of Hawaii – HMRG, HURL University of Hawaii – HMRG, HURL – – NOAA Office of Coast Survey NOAA Office of Coast Survey – – NOAA Pacific Services Center NOAA Pacific Services Center • • American Samoa American Samoa – National Park Service – National Park Service – NOAA National Marine Sanctuaries – NOAA National Marine Sanctuaries • • PRIA PRIA – U.S. Fish and Wildlife Service – U.S. Fish and Wildlife Service Saipan Anchorage Habitat – U.S. Air Force – U.S. Air Force Survey for U.S. Navy in 2004
- 13. 2008 - 2009 Mapping Priorities and Acitivities 13 Pacific Islands Fisheries Science Center Coral Reef Ecosystem Division (CRED) 30-day April/May cruise aboard Hi’ialakai using 25’ R/V AHI survey launch is the only 30-day April/May cruise aboard Hi’ialakai using 25’ R/V AHI survey launch is the only scheduled mapping cruise in the Papahānaumokuākea Marine National Monument scheduled mapping cruise in the Papahānaumokuākea Marine National Monument (PMNM) in three field seasons (2007-2009). Multibeam and optical validation data (PMNM) in three field seasons (2007-2009). Multibeam and optical validation data will be collected at French Frigate Shoals and Pearl and Hermes Reef as first priority. will be collected at French Frigate Shoals and Pearl and Hermes Reef as first priority. If time allows, surveys may also be done at St. Rogatien bank or Nihoa Island. If time allows, surveys may also be done at St. Rogatien bank or Nihoa Island.
- 14. 14 French Frigate Shoals Existing Multibeam, IKONOS, and Optical Validation Data Yellow circles indicate areas scheduled for multibeam mapping on May 2008 cruise. Optical validation data will also be collected.
- 15. Pearl and Hermes Reef Existing Multibeam, IKONOS, and Optical Validation Data Yellow circles indicate 15 areas scheduled for multibeam mapping on May 2008 cruise. Optical validation data will also be collected. collected.
- 16. IKONOS or Land Sat Imagery A Layered Multibeam Bathymetry GIS Approach & Estimated Depths Multibeam to Benthic Backscatter Habitat Mapping Slope Rugosity Bathymetric Appropriate Position Index layers used for supervised and unsupervised Integrated classifications: Arc GIS e.g. hard/soft Projects Optical Data and Linked Positions 16
- 17. 17 Multibeam Data Products, Standards and Issues • • Data collected using standard hydrographic techniques and equipment with Data collected using standard hydrographic techniques and equipment with documented calibrations documented calibrations – – Few tide stations Few tide stations – – No DGPS in most areas until 2007 (NavCom) No DGPS in most areas until 2007 (NavCom) (NavCom) – – Much more (10-20 x) expensive to collect all data to IHO standards because of Much more (10- (10-20 x) expensive to collect all data to IHO standards because of bottom coverage requirements and documentation required to meet IHO standards bottom coverage requirements and documentation required to meet IHO standards • • Multibeam swath data in generic sensor format submitted to NGDC within one Multibeam swath data in generic sensor format submitted to NGDC within one year of collection year of collection – Request from State of Hawaii to not make Main Hawaiian Island data in 100-500 m – Request from State of Hawaii to not make Main Hawaiian Island data in 100- data 100-500 m depths available to public because of Essential Fish Habitat concerns depths available to public because of Essential Fish Habitat concerns concerns – Metadata creation very time consuming and as yet no “standard” for multibeam standard” – Metadata creation very time consuming and as yet no “standard” for multibeam format – this needs to be automated format – this needs to be automated – Much of data is in areas with pre-WWII soundings, but is not being or will not be – Much of data is in areas with pre- pre-WWII soundings, but is not being or will not be used for nautical chart updates used for nautical chart updates • • Gridded bathymetric and backscatter data products (with metadata) available Gridded bathymetric and backscatter data products (with metadata) available on web at www.soest.hawaii.edu/pibhmc within one year on web at www.soest.hawaii.edu/pibhmc within one year – Metadata produced for all products, time consuming & needs automation – Metadata produced for all products, time consuming & needs automation automation – Metadata sent to Coral Reef Information System (CoRIS) site – Metadata sent to Coral Reef Information System (CoRIS) site (CoRIS)
- 18. 18 Moderate Depth Optical Data • Existing coverage is limited • Need much more data • Data collection – – Time consuming Time consuming – – Inaccurate positioning Inaccurate positioning – – Difficult in rugged coral areas Difficult in rugged coral areas – – Need to use more sophisticated Need to use more sophisticated technique (e.g., terrain- technique (e.g., terrain- following AUV) following AUV) • Data processing – Interpretation techniques – Interpretation techniques – Integration with other data – Integration with other data compromised because of compromised because of positioning issues positioning issues – Metadata, no standards – Metadata, no standards – Time intensive, automation? – Time intensive, automation?
- 19. 19 Habitat Mapping Challenges Shallow water habitats (<~15 m) Need bathymetry and backscatter LIDAR works well, but not accessible in remote areas Moderate depth habitats (~15 – 400 m) Very sparse biological cover information Terrain-following AUV for optical validation needed Terrain-following Integration of shallow and deep mapping Shallow maps based on optical imagery, lack structure Moderate maps based on acoustic mapping, lack biology Need seamless mapping products Need Habitat Utilization Maps Which organisms utilize which habitats