![Median: The middle value when we list our datas from smallest to largest.
푥̃ = x(n+1)/2 if n is odd
푥̃ =
푥
(푛
2
)
+ 푥
(푛
2
)+1
2
if n is even (n = total number of our datas)
Then 푥̃ is:
푥35 + 푥36
푥̃=
2
=
250+250
2
= 250
Sample variance: Measure of dispersion.
S2 =
Σ (푥푖−푥̅) 푛푖=1
푛−1
(n = total number of our datas)
Then S2 is :
S2 =
[(100−280)2 ∗8]+[(140−280)2 ∗1]+[(150−280)2 ∗6]+[(170−280)2 ∗2]+[(180−280)2 ∗1]
+[(200−280)2 ∗10]+[(250−280)2 ∗8]+[(270−280)2 ∗1]+[(300−280)2 ∗12]+[(350−280)2 ∗5]
+[(400−280)2 ∗7]+[(450−280)2 ∗1]+[(500−280)2 ∗4]+[(550−280)2 ∗1]+[(600−280)2 ∗3]
69](data:image/gif;base64,R0lGODlhAQABAIAAAAAAAP///yH5BAEAAAAALAAAAAABAAEAAAIBRAA7)
Empfohlen
Weitere ähnliche Inhalte
Kürzlich hochgeladen
Kürzlich hochgeladen (20)
Empfohlen
Empfohlen (20)
3rd homework probability
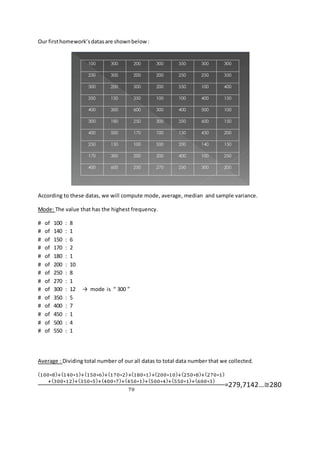
- 1. Our first homework’s datas are shown below : According to these datas, we will compute mode, average, median and sample variance. Mode: The value that has the highest frequency. # of 100 : 8 # of 140 : 1 # of 150 : 6 # of 170 : 2 # of 180 : 1 # of 200 : 10 # of 250 : 8 # of 270 : 1 # of 300 : 12 → mode is “ 300 ” # of 350 : 5 # of 400 : 7 # of 450 : 1 # of 500 : 4 # of 550 : 1 Average : Dividing total number of our all datas to total data number that we collected. (100∗8)+(140∗1)+(150∗6)+(170∗2)+(180∗1)+(200∗10)+(250∗8)+(270∗1) +(300∗12)+(350∗5)+(400∗7)+(450∗1)+(500∗4)+(550∗1)+(600∗3) 70 =279,7142…≅280
- 2. Median: The middle value when we list our datas from smallest to largest. 푥̃ = x(n+1)/2 if n is odd 푥̃ = 푥 (푛 2 ) + 푥 (푛 2 )+1 2 if n is even (n = total number of our datas) Then 푥̃ is: 푥35 + 푥36 푥̃= 2 = 250+250 2 = 250 Sample variance: Measure of dispersion. S2 = Σ (푥푖−푥̅) 푛푖=1 푛−1 (n = total number of our datas) Then S2 is : S2 = [(100−280)2 ∗8]+[(140−280)2 ∗1]+[(150−280)2 ∗6]+[(170−280)2 ∗2]+[(180−280)2 ∗1] +[(200−280)2 ∗10]+[(250−280)2 ∗8]+[(270−280)2 ∗1]+[(300−280)2 ∗12]+[(350−280)2 ∗5] +[(400−280)2 ∗7]+[(450−280)2 ∗1]+[(500−280)2 ∗4]+[(550−280)2 ∗1]+[(600−280)2 ∗3] 69