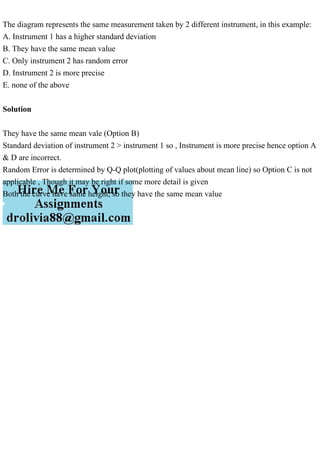
The diagram represents the same measurement taken by 2 different instrument, in this example:
A. Instrument 1 has a higher standard deviation
B. They have the same mean value
C. Only instrument 2 has random error
D. Instrument 2 is more precise
E. none of the above
Solution
They have the same mean vale (Option B)
Standard deviation of instrument 2 > instrument 1 so , Instrument is more precise hence option A
& D are incorrect.
Random Error is determined by Q-Q plot(plotting of values about mean line) so Option C is not
applicable , Though it may be right if some more detail is given
Both the curve have same height, so they have the same mean value.
Beginners Guide to TikTok for Search - Rachel Pearson - We are Tilt __ Bright...
Comparing Measurement Instruments Based on Standard Deviation & Mean Values
1. The diagram represents the same measurement taken by 2 different instrument, in this example:
A. Instrument 1 has a higher standard deviation
B. They have the same mean value
C. Only instrument 2 has random error
D. Instrument 2 is more precise
E. none of the above
Solution
They have the same mean vale (Option B)
Standard deviation of instrument 2 > instrument 1 so , Instrument is more precise hence option A
& D are incorrect.
Random Error is determined by Q-Q plot(plotting of values about mean line) so Option C is not
applicable , Though it may be right if some more detail is given
Both the curve have same height, so they have the same mean value