This document presents the results of a study that examined the effects of using comic magazines to improve reading comprehension among 8th grade students in Cilegon, Indonesia. It shows pretest and posttest scores for 30 students, with average scores increasing from 56.0667 to 62.2667 after the intervention. Statistical analysis found a strong positive correlation between pretest and posttest scores (r=0.932) and that posttest scores can reliably predict pretest scores.
2. Regression
Descriptive Statistics
Mean Std. Deviation N
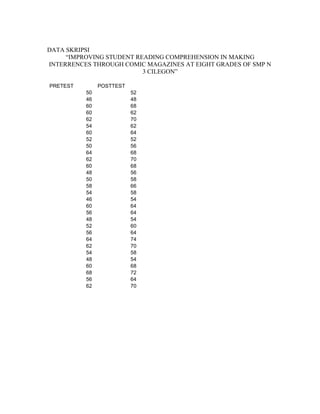
pretest 56.0667 6.04542 30
posttest 62.2667 6.92289 30
Correlations
pretest posttest
Pearson Correlation pretest 1.000 .932
posttest .932 1.000
Sig. (1-tailed) pretest . .000
posttest .000 .
N pretest 30 30
posttest 30 30
Variables Entered/Removedb
Variables Variables
Model Entered Removed Method
1 posttesta . Enter
a. All requested variables entered.
b. Dependent Variable: pretest
Model Summaryb
Adjusted Std. Error of
Model R R Square R Square the Estimate
1 .932a .869 .864 2.22614
a. Predictors: (Constant), posttest
b. Dependent Variable: pretest
3. ANOVAb
Sum of
Model Squares df Mean Square F Sig.
1 Regression 921.108 1 921.108 185.869 .000a
Residual 138.759 28 4.956
Total 1059.867 29
a. Predictors: (Constant), posttest
b. Dependent Variable: pretest
Coefficientsa
Unstandardized Standardized
Coefficients Coefficients
Model B Std. Error Beta t Sig.
1 (Constant) 5.376 3.740 1.437 .162
posttest .814 .060 .932 13.633 .000
a. Dependent Variable: pretest
Residuals Statisticsa
Minimum Maximum Mean Std. Deviation N
Predicted Value 44.4524 65.6186 56.0667 5.63581 30
Std. Predicted Value -2.061 1.695 .000 1.000 30
Standard Error of
.407 .944 .560 .134 30
Predicted Value
Adjusted Predicted Value 44.1132 65.8655 56.0508 5.66925 30
Residual -3.33691 4.29125 .00000 2.18742 30
Std. Residual -1.499 1.928 .000 .983 30
Stud. Residual -1.565 2.042 .003 1.019 30
Deleted Residual -3.63697 4.81714 .01583 2.35572 30
Stud. Deleted Residual -1.609 2.174 .016 1.046 30
Mahal. Distance .001 4.247 .967 .981 30
Cook's Distance .001 .256 .039 .059 30
Centered Leverage Value .000 .146 .033 .034 30
a. Dependent Variable: pretest
Charts
4. Normal P-P Plot of Regression Standardized Residual
Dependent Variable: pretest
1.0
0.8
Expected Cum Prob
0.6
0.4
0.2
0.0
0.0 0.2 0.4 0.6 0.8 1.0
Observed Cum Prob