
Empfohlen
Weitere ähnliche Inhalte
Ähnlich wie P1 Graph Function Test
Ähnlich wie P1 Graph Function Test (20)
Mehr von guest3952880
Kürzlich hochgeladen
Kürzlich hochgeladen (20)
P1 Graph Function Test
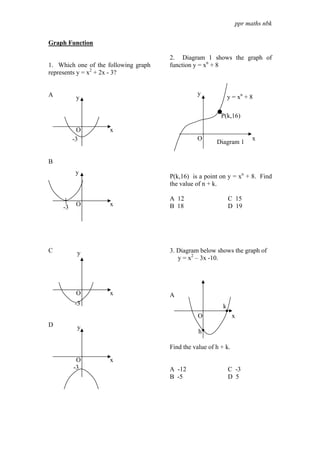
- 1. ppr maths nbk Graph Function 2. Diagram 1 shows the graph of 1. Which one of the following graph function y = xn + 8 represents y = x2 + 2x - 3? A y y y = xn + 8 P(k,16) O x -3 O x Diagram 1 B y P(k,16) is a point on y = xn + 8. Find the value of n + k. A 12 C 15 -3 O x B 18 D 19 C y 3. Diagram below shows the graph of y = x2 – 3x -10. O x A -3 k O x D y h Find the value of h + k. O x -3 A -12 C -3 B -5 D 5
- 2. ppr maths nbk 4. Which of the following graph 5. Which of the following graph 2 represents 3y-5x=15? represents y = ? x A y A y 5 O x -3 O x y y B B O x O 3 x -5 C y C y 5 x 3 x O O y y D D x O x -3 O -5
- 3. ppr maths nbk 6. Which of these graphs represent 7. Which of the following graphs represents y = 2x3? y = ( x + 1) 2 ? A y A y B y O x 1 x 0 1 y B B y D y O x 1 x 0 −1 C y C y x O 1 −1 x y D D y −1 0 x x O -1
- 4. ppr maths nbk 8. The graph below shows A 4 B 0 y =-xn + 8, n is the integer. C 3 D 6 y q 10. Diagram below shows the graph of x function y = x n + 27. y Find the values of n and q. A n=-2, q=8 B n=-3, q=8, P(k,35) C n=2, q=2 D n=3, q=2 x 9. The diagram below shows the graph of y = x2 – 3x -10. P (k,35) is a point on y = x n + 27. Find the value of n + k. A 2 B 3 y C 5 D 11 h 0 k x Find the value of h + k.
- 5. ppr maths nbk 11. Which of the following graphs represents y = x2 – 4? A C B D 1 12. Which of the following shaded regions satisfies the inequalities y ≤x, y≥ x and 2 x ≤ 4? A.. C B.. D
- 6. ppr maths nbk 13. Find the coordinates of p for the graph below A(1, 1) B. (2, 0) C. (1, 0) D. (0, 0) 3 14. Which of the following graphs represents y = − ? x A C B D 15. Which of the following graphs represents y = x3 – 4? A C B D
- 7. ppr maths nbk 16. In the diagram, the equation of the straight line PQR is y = –2xn + c . The value of c is A 4 B. 5 C. 6 D. 7 17. Which set of inequalities in the following defines the shaded region in the diagram? a. y ≥ x3 + 4, y≤ 5 and x ≥ 0 b. y < x3 + 4, y ≤ 5 and x ≤ 0 c. y ≥ x3 + 4, y ≥ 5 and x ≥ 0 d. y < x3 + 4, y ≤ 5 and x ≤0
- 8. ppr maths nbk JAWAPAN: Diagnostic Test 1. C 6. C 11. A 16. B 2. D 7. D 12. B 17. A 3. B 8. D 13. C 4. D 9. D 14. D 5. A 10. C 15. B