SlideShare ist ein Scribd-Unternehmen logo
1 von 22
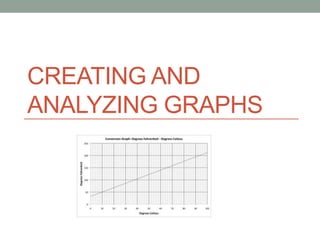
CREATING AND
ANALYZING GRAPHS
Age
(months)
Height
(inches)
18 76.1
19 77
20 78.1
21
22 78.8
23 79.7
24 79.9
25 81.1
26 81.2
27 82.8
28
29 83.5
Plot the data on a
graph and make a
prediction for the
height at:
• 21 months
• 28 months
• 5 years
1) Identify Dependent and Independent Variables
• Before plotting the graph we must choose which
variable is dependent and which is independent.
• Independent Variable: Influences the dependent
variable and is plotted on the horizontal axis.
• Dependent Variable: Depends on the independent
variable and is plotted on the vertical axis.
• In this case which variable is the dependent variable
and which variable is the independent variable?
• Make your graph as large as possible by spreading out
the data on each axis
• Let each space stand for a convenient amount
• In our example, what scale would you choose?
2) Choose your scale carefully
3) Plot the axes and data
• Plot and label (include name of variable and unit) the
independent variable on the horizontal axis (x) and the
dependent variable on the vertical axis (y).
• Plot each data point. These data points are sometimes
referred to as a “scatterplot”
• What does our data look like?
4) Title Your Graph
• Just like you learned for a table, a graph title should be as
descriptive as possible
• Title should clearly state the purpose of the graph and
include the independent and dependent variables
• Choose a descriptive title for the graph we are using as
an example
How the Age of a __________Affects Its Height
5) Draw Line of Best Fit
• Definition - A Line of Best is a straight line on a
Scatterplot that comes closest to all of the dots
on the graph.
• A Line of Best Fit does not touch all of the
dots.
• A good technique is to try to get the same
number of points above the line as below.
• A Line of Best Fit is useful because it allows us
to:
• Understand the type and strength of the relationship
between two sets of data.
• Predict missing values.
• Draw the line of best fit for our data
Predicting Data with Scatterplots
• Interpretation - Making a prediction for an
unknown value within a range of known data
• Extrapolation - Making a prediction for an
unknown value outside of a range of known data.
We must extend the line of best to do this.
• More accurate: Interpretation
• Less accurate: Extrapolation
• Can you use the graph we made to interpolate
and extrapolate the required data?
• Recall that we want to make a prediction of the height
in 5 years.
• Extrapolating the graph to this point would require
drawing the graph with a much larger scale.
• Let’s try determining the equation of the line and using
this to make a prediction.
Predicting Data by Using the Equation of a Line:
The Equation of the Line
• The equation of a line comes in the form: y = mx + b
• m is the slope.
• b is the y-intercept, this is the y-value where the line
crosses the y-axis when x = 0.
• The slope of a line (m) gives the rate at which our
dependent variable changes with respect to the
independent variable.
• We can find the slope of the line by using any two
points on the line of best fit.
• These points do not have to be from the data.
The Slope of the Line
• To calculate the slope we can use the formula:
𝑠𝑙𝑜𝑝𝑒 =
Δ𝑦
Δ𝑥
=
𝑦2 − 𝑦1
𝑥2 − 𝑥1
• The points are: (x1, y1) = (19, 77)
(x2, y2) = (28, 82.9)
𝑠𝑙𝑜𝑝𝑒 =
82.9 − 77
28 − 19
=
5.9
9
= 0.65
The Slope of the Line
• What does this slope mean?
• Let’s look at the units …
• y is inches, x is months.
• Therefore this slope means that on average the _____
grows by 0.65 inches per month.
• m = 0.65 inches/month
The Slope of the Line
The Equation of the Line
• Since our graph does not start at x = 0 we will use the
equation of the line, and one point from the line to
solve for the y-intercept (b):
𝑦 = 𝑚𝑥 + 𝑏 𝑠𝑙𝑜𝑝𝑒 = 𝑚 = 0.65
𝑦 = 0.65𝑥 + 𝑏
• Now let’s find a point on the line.
𝑥, 𝑦 = (22, 79)
𝑦 = 0.65𝑥 + 𝑏
79 = 0.65 22 + 𝑏
79 = 14.3 + 𝑏
79 − 14.3 = 𝑏
64.7 = 𝑏
• Therefore 𝑦 = 0.65𝑥 + 64.7
• We can now use this equation to determine the height
in 5 years.
• 𝑦 = 0.65𝑥 + 64.7
• What is 𝑥?
The age in months.
• What is 𝑦?
The height in inches.
Therefore 5 years in months would be:
𝑥 = 12 5 = 60
The Equation of the Line
• Since 𝑥 = 12 5 = 60
• Plugging into our equation of the line:
𝑦 = 0.65𝑥 + 64.7
𝑦 = 0.65 60 + 64.7
𝑦 = 39 + 64.7
𝑦 = 103.7 𝑖𝑛𝑐ℎ𝑒𝑠
• Therefore the height in 5 years would be 103.7 inches.
The Equation of the Line
Practice Questions
1. Please read page 18 w/b
2. w/b page 19 & 20, 21, 23
3. Hand – in work sheet

Weitere ähnliche Inhalte

Was ist angesagt?

Binomial theorem
Binomial theoremBinomial theorem
Binomial theoremRishabh Dubey
 
Solving System of Equations by Substitution
Solving System of Equations by SubstitutionSolving System of Equations by Substitution
Solving System of Equations by SubstitutionTwinkiebear7
 
Expanding two brackets
Expanding two bracketsExpanding two brackets
Expanding two bracketsJack Warburton
 
Least common multiple (lcm) & greatest
Least common multiple (lcm) & greatestLeast common multiple (lcm) & greatest
Least common multiple (lcm) & greatestShiara Agosto
 
Absolute Value Functions & Graphs
Absolute Value Functions & GraphsAbsolute Value Functions & Graphs
Absolute Value Functions & Graphstoni dimella
 
Solving Literal Equations
Solving Literal EquationsSolving Literal Equations
Solving Literal EquationsClayton Rainsberg
 
Sharing Using Ratios
Sharing Using RatiosSharing Using Ratios
Sharing Using RatiosPassy World
 
Module 10 Topic 4 solving quadratic equations part 1
Module 10 Topic 4   solving quadratic equations part 1Module 10 Topic 4   solving quadratic equations part 1
Module 10 Topic 4 solving quadratic equations part 1Lori Rapp
 
5.1 Graphing Quadratic Functions
5.1 Graphing Quadratic Functions5.1 Graphing Quadratic Functions
5.1 Graphing Quadratic Functionshisema01
 
Sales tax and tip powerpoint
Sales tax and tip  powerpointSales tax and tip  powerpoint
Sales tax and tip powerpointtigergirl823
 
7.5 proportions in triangles
7.5 proportions in triangles7.5 proportions in triangles
7.5 proportions in trianglesRana Kkkk
 
Graphs of Log functions
Graphs of Log functionsGraphs of Log functions
Graphs of Log functionslesurhommemega
 
Exponents Intro with Practice.ppt
Exponents Intro with Practice.pptExponents Intro with Practice.ppt
Exponents Intro with Practice.pptIzah Catli
 
7.7 Solving Radical Equations
7.7 Solving Radical Equations7.7 Solving Radical Equations
7.7 Solving Radical Equationsswartzje
 
Inequalities
InequalitiesInequalities
Inequalitiessusoigto
 

Was ist angesagt? (20)

Binomial theorem
Binomial theoremBinomial theorem
Binomial theorem
 
Solving System of Equations by Substitution
Solving System of Equations by SubstitutionSolving System of Equations by Substitution
Solving System of Equations by Substitution
 
Expanding two brackets
Expanding two bracketsExpanding two brackets
Expanding two brackets
 
Least common multiple (lcm) & greatest
Least common multiple (lcm) & greatestLeast common multiple (lcm) & greatest
Least common multiple (lcm) & greatest
 
Absolute Value Functions & Graphs
Absolute Value Functions & GraphsAbsolute Value Functions & Graphs
Absolute Value Functions & Graphs
 
Solving Literal Equations
Solving Literal EquationsSolving Literal Equations
Solving Literal Equations
 
Sharing Using Ratios
Sharing Using RatiosSharing Using Ratios
Sharing Using Ratios
 
Forming algebraic expressions
Forming algebraic expressionsForming algebraic expressions
Forming algebraic expressions
 
Module 10 Topic 4 solving quadratic equations part 1
Module 10 Topic 4   solving quadratic equations part 1Module 10 Topic 4   solving quadratic equations part 1
Module 10 Topic 4 solving quadratic equations part 1
 
5.1 Graphing Quadratic Functions
5.1 Graphing Quadratic Functions5.1 Graphing Quadratic Functions
5.1 Graphing Quadratic Functions
 
one step equations
one step equations one step equations
one step equations
 
Exponents
ExponentsExponents
Exponents
 
Number problems
Number problemsNumber problems
Number problems
 
Sales tax and tip powerpoint
Sales tax and tip  powerpointSales tax and tip  powerpoint
Sales tax and tip powerpoint
 
7.5 proportions in triangles
7.5 proportions in triangles7.5 proportions in triangles
7.5 proportions in triangles
 
Graphs of Log functions
Graphs of Log functionsGraphs of Log functions
Graphs of Log functions
 
Exponents Intro with Practice.ppt
Exponents Intro with Practice.pptExponents Intro with Practice.ppt
Exponents Intro with Practice.ppt
 
7.7 Solving Radical Equations
7.7 Solving Radical Equations7.7 Solving Radical Equations
7.7 Solving Radical Equations
 
Algebra Terminologies
Algebra TerminologiesAlgebra Terminologies
Algebra Terminologies
 
Inequalities
InequalitiesInequalities
Inequalities
 

Andere mochten auch

Grade 9, U1-L1, Safety Symbols
Grade 9, U1-L1, Safety SymbolsGrade 9, U1-L1, Safety Symbols
Grade 9, U1-L1, Safety Symbolsgruszecki1
 
U1-L2 Particle theory of matter
U1-L2 Particle theory of matterU1-L2 Particle theory of matter
U1-L2 Particle theory of mattergruszecki1
 
Grade9, U1 - L6-Classification of matter
Grade9, U1 - L6-Classification of matterGrade9, U1 - L6-Classification of matter
Grade9, U1 - L6-Classification of mattergruszecki1
 
Grade 9, U1-L3 Phys & Chem Prop
Grade 9, U1-L3 Phys & Chem PropGrade 9, U1-L3 Phys & Chem Prop
Grade 9, U1-L3 Phys & Chem Propgruszecki1
 
Grade 9, U0-L2 Scientific inquiry
Grade 9, U0-L2 Scientific inquiryGrade 9, U0-L2 Scientific inquiry
Grade 9, U0-L2 Scientific inquirygruszecki1
 
Grade 9, U1-L1-LabEquip
Grade 9, U1-L1-LabEquipGrade 9, U1-L1-LabEquip
Grade 9, U1-L1-LabEquipgruszecki1
 
Grade 9, U1-L4-Density
Grade 9, U1-L4-DensityGrade 9, U1-L4-Density
Grade 9, U1-L4-Densitygruszecki1
 
Grade 9, U1-L5 Physical and chemical changes
Grade 9, U1-L5 Physical and chemical changesGrade 9, U1-L5 Physical and chemical changes
Grade 9, U1-L5 Physical and chemical changesgruszecki1
 
3 Things Every Sales Team Needs to Be Thinking About in 2017
3 Things Every Sales Team Needs to Be Thinking About in 20173 Things Every Sales Team Needs to Be Thinking About in 2017
3 Things Every Sales Team Needs to Be Thinking About in 2017Drift
 
How to Become a Thought Leader in Your Niche
How to Become a Thought Leader in Your NicheHow to Become a Thought Leader in Your Niche
How to Become a Thought Leader in Your NicheLeslie Samuel
 

Andere mochten auch (10)

Grade 9, U1-L1, Safety Symbols
Grade 9, U1-L1, Safety SymbolsGrade 9, U1-L1, Safety Symbols
Grade 9, U1-L1, Safety Symbols
 
U1-L2 Particle theory of matter
U1-L2 Particle theory of matterU1-L2 Particle theory of matter
U1-L2 Particle theory of matter
 
Grade9, U1 - L6-Classification of matter
Grade9, U1 - L6-Classification of matterGrade9, U1 - L6-Classification of matter
Grade9, U1 - L6-Classification of matter
 
Grade 9, U1-L3 Phys & Chem Prop
Grade 9, U1-L3 Phys & Chem PropGrade 9, U1-L3 Phys & Chem Prop
Grade 9, U1-L3 Phys & Chem Prop
 
Grade 9, U0-L2 Scientific inquiry
Grade 9, U0-L2 Scientific inquiryGrade 9, U0-L2 Scientific inquiry
Grade 9, U0-L2 Scientific inquiry
 
Grade 9, U1-L1-LabEquip
Grade 9, U1-L1-LabEquipGrade 9, U1-L1-LabEquip
Grade 9, U1-L1-LabEquip
 
Grade 9, U1-L4-Density
Grade 9, U1-L4-DensityGrade 9, U1-L4-Density
Grade 9, U1-L4-Density
 
Grade 9, U1-L5 Physical and chemical changes
Grade 9, U1-L5 Physical and chemical changesGrade 9, U1-L5 Physical and chemical changes
Grade 9, U1-L5 Physical and chemical changes
 
3 Things Every Sales Team Needs to Be Thinking About in 2017
3 Things Every Sales Team Needs to Be Thinking About in 20173 Things Every Sales Team Needs to Be Thinking About in 2017
3 Things Every Sales Team Needs to Be Thinking About in 2017
 
How to Become a Thought Leader in Your Niche
How to Become a Thought Leader in Your NicheHow to Become a Thought Leader in Your Niche
How to Become a Thought Leader in Your Niche
 

Ähnlich wie Grade 9 U0-L5-Graphing

DATA GRAPHICS -REPRESENTATION OF DATA
DATA GRAPHICS -REPRESENTATION OF DATADATA GRAPHICS -REPRESENTATION OF DATA
DATA GRAPHICS -REPRESENTATION OF DATADr-Jitendra Patel
 
Essay On Linear Function
Essay On Linear FunctionEssay On Linear Function
Essay On Linear FunctionAngie Lee
 
Simple Linear Regression: Step-By-Step
Simple Linear Regression: Step-By-StepSimple Linear Regression: Step-By-Step
Simple Linear Regression: Step-By-StepDan Wellisch
 
Week 3-4 solutions
Week 3-4 solutionsWeek 3-4 solutions
Week 3-4 solutionsBrian Larson
 
DATA GRAPHICS 8th Sem.pdf
DATA GRAPHICS 8th Sem.pdfDATA GRAPHICS 8th Sem.pdf
DATA GRAPHICS 8th Sem.pdfRavinandan A P
 
diagrammatic and graphical representation of data
 diagrammatic and graphical representation of data diagrammatic and graphical representation of data
diagrammatic and graphical representation of dataVarun Prem Varu
 
Independent and Dependent Variables
Independent and Dependent VariablesIndependent and Dependent Variables
Independent and Dependent VariablesM.T.H Group
 
Vector scalarquantitiesppt
Vector scalarquantitiespptVector scalarquantitiesppt
Vector scalarquantitiespptTrnka
 
Bootcamp of new world to taken seriously
Bootcamp of new world to taken seriouslyBootcamp of new world to taken seriously
Bootcamp of new world to taken seriouslykhaled125087
 
Different Types of Graphs-1.pptDifferent Types of Graphs-1.ppt
Different Types of Graphs-1.pptDifferent Types of Graphs-1.pptDifferent Types of Graphs-1.pptDifferent Types of Graphs-1.ppt
Different Types of Graphs-1.pptDifferent Types of Graphs-1.pptGilbertGarcia40
 
Different Types of Graphs and their application
Different Types of Graphs and their applicationDifferent Types of Graphs and their application
Different Types of Graphs and their applicationHodaFakour2
 
Different Types of Graphs Grade 10.ppt
Different Types of Graphs Grade 10.pptDifferent Types of Graphs Grade 10.ppt
Different Types of Graphs Grade 10.pptalonajane1
 
Different Types of Graphs
Different Types of GraphsDifferent Types of Graphs
Different Types of GraphsEverromeAsico2
 
Different types of graphs
Different types of graphsDifferent types of graphs
Different types of graphsReymarkDelaAustria
 
Different Types of Graphs.ppt
Different Types of Graphs.pptDifferent Types of Graphs.ppt
Different Types of Graphs.pptJessahMaeRPrincesa
 

Ähnlich wie Grade 9 U0-L5-Graphing (20)

Simple linear regression
Simple linear regressionSimple linear regression
Simple linear regression
 
DATA GRAPHICS -REPRESENTATION OF DATA
DATA GRAPHICS -REPRESENTATION OF DATADATA GRAPHICS -REPRESENTATION OF DATA
DATA GRAPHICS -REPRESENTATION OF DATA
 
Linear relations
   Linear relations   Linear relations
Linear relations
 
Essay On Linear Function
Essay On Linear FunctionEssay On Linear Function
Essay On Linear Function
 
Simple Linear Regression: Step-By-Step
Simple Linear Regression: Step-By-StepSimple Linear Regression: Step-By-Step
Simple Linear Regression: Step-By-Step
 
Week 3-4 solutions
Week 3-4 solutionsWeek 3-4 solutions
Week 3-4 solutions
 
DATA GRAPHICS 8th Sem.pdf
DATA GRAPHICS 8th Sem.pdfDATA GRAPHICS 8th Sem.pdf
DATA GRAPHICS 8th Sem.pdf
 
diagrammatic and graphical representation of data
 diagrammatic and graphical representation of data diagrammatic and graphical representation of data
diagrammatic and graphical representation of data
 
Independent and Dependent Variables
Independent and Dependent VariablesIndependent and Dependent Variables
Independent and Dependent Variables
 
Vector scalarquantitiesppt
Vector scalarquantitiespptVector scalarquantitiesppt
Vector scalarquantitiesppt
 
Covariance.pdf
Covariance.pdfCovariance.pdf
Covariance.pdf
 
Bootcamp of new world to taken seriously
Bootcamp of new world to taken seriouslyBootcamp of new world to taken seriously
Bootcamp of new world to taken seriously
 
Different Types of Graphs-1.pptDifferent Types of Graphs-1.ppt
Different Types of Graphs-1.pptDifferent Types of Graphs-1.pptDifferent Types of Graphs-1.pptDifferent Types of Graphs-1.ppt
Different Types of Graphs-1.pptDifferent Types of Graphs-1.ppt
 
Different Types of Graphs and their application
Different Types of Graphs and their applicationDifferent Types of Graphs and their application
Different Types of Graphs and their application
 
Different types of graphs
Different types of graphsDifferent types of graphs
Different types of graphs
 
Different Types of Graphs Grade 10.ppt
Different Types of Graphs Grade 10.pptDifferent Types of Graphs Grade 10.ppt
Different Types of Graphs Grade 10.ppt
 
Different types of graphs
Different types of graphsDifferent types of graphs
Different types of graphs
 
Different Types of Graphs
Different Types of GraphsDifferent Types of Graphs
Different Types of Graphs
 
Different types of graphs
Different types of graphsDifferent types of graphs
Different types of graphs
 
Different Types of Graphs.ppt
Different Types of Graphs.pptDifferent Types of Graphs.ppt
Different Types of Graphs.ppt
 

Mehr von gruszecki1

Topics for math test 2018
Topics for math test 2018Topics for math test 2018
Topics for math test 2018gruszecki1
 
Grad12, U3-L2A-HorizPM-R
Grad12, U3-L2A-HorizPM-R Grad12, U3-L2A-HorizPM-R
Grad12, U3-L2A-HorizPM-R gruszecki1
 
Grade9, L11-U3Habitat loss and fragmentation
Grade9, L11-U3Habitat loss and fragmentationGrade9, L11-U3Habitat loss and fragmentation
Grade9, L11-U3Habitat loss and fragmentationgruszecki1
 
Grade 9, U3-L10 pesticides and biomagnification
Grade 9, U3-L10 pesticides and biomagnificationGrade 9, U3-L10 pesticides and biomagnification
Grade 9, U3-L10 pesticides and biomagnificationgruszecki1
 
Grade 9-U3-L9-Invasive species
Grade 9-U3-L9-Invasive speciesGrade 9-U3-L9-Invasive species
Grade 9-U3-L9-Invasive speciesgruszecki1
 
Grade 9,U3-L7 population ecology
Grade 9,U3-L7 population ecologyGrade 9,U3-L7 population ecology
Grade 9,U3-L7 population ecologygruszecki1
 
Grade9,U3-L6 Ecological Succession
Grade9,U3-L6 Ecological SuccessionGrade9,U3-L6 Ecological Succession
Grade9,U3-L6 Ecological Successiongruszecki1
 
Grade9, U3-L5 biotic and abiotic factors
Grade9, U3-L5 biotic and abiotic factorsGrade9, U3-L5 biotic and abiotic factors
Grade9, U3-L5 biotic and abiotic factorsgruszecki1
 
Grade 9, U3-L4 Cycles
Grade 9, U3-L4 CyclesGrade 9, U3-L4 Cycles
Grade 9, U3-L4 Cyclesgruszecki1
 
Grade 9, U3-L3 Food Chains and Food Webs
Grade 9, U3-L3 Food Chains and Food WebsGrade 9, U3-L3 Food Chains and Food Webs
Grade 9, U3-L3 Food Chains and Food Websgruszecki1
 
Grade9, U3-L2, Energy flow in ecosystems
Grade9, U3-L2, Energy flow in ecosystemsGrade9, U3-L2, Energy flow in ecosystems
Grade9, U3-L2, Energy flow in ecosystemsgruszecki1
 
Grade 9, U3-L1-Life on planet earth
Grade 9, U3-L1-Life on planet earthGrade 9, U3-L1-Life on planet earth
Grade 9, U3-L1-Life on planet earthgruszecki1
 
Grade9, U2-L7-Power generation, efficiency and cost of electricity
Grade9, U2-L7-Power generation, efficiency and cost of electricityGrade9, U2-L7-Power generation, efficiency and cost of electricity
Grade9, U2-L7-Power generation, efficiency and cost of electricitygruszecki1
 
Grade 9, U2-L6-Circuits
Grade 9, U2-L6-CircuitsGrade 9, U2-L6-Circuits
Grade 9, U2-L6-Circuitsgruszecki1
 
Grade 9, U2-L5 Equivalent Resistance and Complex CCT's
Grade 9, U2-L5 Equivalent Resistance and Complex CCT'sGrade 9, U2-L5 Equivalent Resistance and Complex CCT's
Grade 9, U2-L5 Equivalent Resistance and Complex CCT'sgruszecki1
 
Grade 9, U2-L4-Electrical quantities
Grade 9, U2-L4-Electrical quantitiesGrade 9, U2-L4-Electrical quantities
Grade 9, U2-L4-Electrical quantitiesgruszecki1
 
Grade 9, U2-L3-Current electricity
Grade 9, U2-L3-Current electricityGrade 9, U2-L3-Current electricity
Grade 9, U2-L3-Current electricitygruszecki1
 
Grade 9, U2-L2, Charging and Discharging Objects
Grade 9, U2-L2, Charging and Discharging ObjectsGrade 9, U2-L2, Charging and Discharging Objects
Grade 9, U2-L2, Charging and Discharging Objectsgruszecki1
 
Grade 9-U2-L1-Static electricity
Grade 9-U2-L1-Static electricityGrade 9-U2-L1-Static electricity
Grade 9-U2-L1-Static electricitygruszecki1
 
Grade 9, U1-L13-Molecular Compounds
Grade 9, U1-L13-Molecular CompoundsGrade 9, U1-L13-Molecular Compounds
Grade 9, U1-L13-Molecular Compoundsgruszecki1
 

Mehr von gruszecki1 (20)

Topics for math test 2018
Topics for math test 2018Topics for math test 2018
Topics for math test 2018
 
Grad12, U3-L2A-HorizPM-R
Grad12, U3-L2A-HorizPM-R Grad12, U3-L2A-HorizPM-R
Grad12, U3-L2A-HorizPM-R
 
Grade9, L11-U3Habitat loss and fragmentation
Grade9, L11-U3Habitat loss and fragmentationGrade9, L11-U3Habitat loss and fragmentation
Grade9, L11-U3Habitat loss and fragmentation
 
Grade 9, U3-L10 pesticides and biomagnification
Grade 9, U3-L10 pesticides and biomagnificationGrade 9, U3-L10 pesticides and biomagnification
Grade 9, U3-L10 pesticides and biomagnification
 
Grade 9-U3-L9-Invasive species
Grade 9-U3-L9-Invasive speciesGrade 9-U3-L9-Invasive species
Grade 9-U3-L9-Invasive species
 
Grade 9,U3-L7 population ecology
Grade 9,U3-L7 population ecologyGrade 9,U3-L7 population ecology
Grade 9,U3-L7 population ecology
 
Grade9,U3-L6 Ecological Succession
Grade9,U3-L6 Ecological SuccessionGrade9,U3-L6 Ecological Succession
Grade9,U3-L6 Ecological Succession
 
Grade9, U3-L5 biotic and abiotic factors
Grade9, U3-L5 biotic and abiotic factorsGrade9, U3-L5 biotic and abiotic factors
Grade9, U3-L5 biotic and abiotic factors
 
Grade 9, U3-L4 Cycles
Grade 9, U3-L4 CyclesGrade 9, U3-L4 Cycles
Grade 9, U3-L4 Cycles
 
Grade 9, U3-L3 Food Chains and Food Webs
Grade 9, U3-L3 Food Chains and Food WebsGrade 9, U3-L3 Food Chains and Food Webs
Grade 9, U3-L3 Food Chains and Food Webs
 
Grade9, U3-L2, Energy flow in ecosystems
Grade9, U3-L2, Energy flow in ecosystemsGrade9, U3-L2, Energy flow in ecosystems
Grade9, U3-L2, Energy flow in ecosystems
 
Grade 9, U3-L1-Life on planet earth
Grade 9, U3-L1-Life on planet earthGrade 9, U3-L1-Life on planet earth
Grade 9, U3-L1-Life on planet earth
 
Grade9, U2-L7-Power generation, efficiency and cost of electricity
Grade9, U2-L7-Power generation, efficiency and cost of electricityGrade9, U2-L7-Power generation, efficiency and cost of electricity
Grade9, U2-L7-Power generation, efficiency and cost of electricity
 
Grade 9, U2-L6-Circuits
Grade 9, U2-L6-CircuitsGrade 9, U2-L6-Circuits
Grade 9, U2-L6-Circuits
 
Grade 9, U2-L5 Equivalent Resistance and Complex CCT's
Grade 9, U2-L5 Equivalent Resistance and Complex CCT'sGrade 9, U2-L5 Equivalent Resistance and Complex CCT's
Grade 9, U2-L5 Equivalent Resistance and Complex CCT's
 
Grade 9, U2-L4-Electrical quantities
Grade 9, U2-L4-Electrical quantitiesGrade 9, U2-L4-Electrical quantities
Grade 9, U2-L4-Electrical quantities
 
Grade 9, U2-L3-Current electricity
Grade 9, U2-L3-Current electricityGrade 9, U2-L3-Current electricity
Grade 9, U2-L3-Current electricity
 
Grade 9, U2-L2, Charging and Discharging Objects
Grade 9, U2-L2, Charging and Discharging ObjectsGrade 9, U2-L2, Charging and Discharging Objects
Grade 9, U2-L2, Charging and Discharging Objects
 
Grade 9-U2-L1-Static electricity
Grade 9-U2-L1-Static electricityGrade 9-U2-L1-Static electricity
Grade 9-U2-L1-Static electricity
 
Grade 9, U1-L13-Molecular Compounds
Grade 9, U1-L13-Molecular CompoundsGrade 9, U1-L13-Molecular Compounds
Grade 9, U1-L13-Molecular Compounds
 

KĂźrzlich hochgeladen

Understanding Accommodations and Modifications
Understanding  Accommodations and ModificationsUnderstanding  Accommodations and Modifications
Understanding Accommodations and ModificationsMJDuyan
 
Explore beautiful and ugly buildings. Mathematics helps us create beautiful d...
Explore beautiful and ugly buildings. Mathematics helps us create beautiful d...Explore beautiful and ugly buildings. Mathematics helps us create beautiful d...
Explore beautiful and ugly buildings. Mathematics helps us create beautiful d...christianmathematics
 
PROCESS RECORDING FORMAT.docx
PROCESS      RECORDING        FORMAT.docxPROCESS      RECORDING        FORMAT.docx
PROCESS RECORDING FORMAT.docxPoojaSen20
 
SOC 101 Demonstration of Learning Presentation
SOC 101 Demonstration of Learning PresentationSOC 101 Demonstration of Learning Presentation
SOC 101 Demonstration of Learning Presentationcamerronhm
 
Basic Civil Engineering first year Notes- Chapter 4 Building.pptx
Basic Civil Engineering first year Notes- Chapter 4 Building.pptxBasic Civil Engineering first year Notes- Chapter 4 Building.pptx
Basic Civil Engineering first year Notes- Chapter 4 Building.pptxDenish Jangid
 
1029 - Danh muc Sach Giao Khoa 10 . pdf
1029 -  Danh muc Sach Giao Khoa 10 . pdf1029 -  Danh muc Sach Giao Khoa 10 . pdf
1029 - Danh muc Sach Giao Khoa 10 . pdfQucHHunhnh
 
Dyslexia AI Workshop for Slideshare.pptx
Dyslexia AI Workshop for Slideshare.pptxDyslexia AI Workshop for Slideshare.pptx
Dyslexia AI Workshop for Slideshare.pptxcallscotland1987
 
Jual Obat Aborsi Hongkong ( Asli No.1 ) 085657271886 Obat Penggugur Kandungan...
Jual Obat Aborsi Hongkong ( Asli No.1 ) 085657271886 Obat Penggugur Kandungan...Jual Obat Aborsi Hongkong ( Asli No.1 ) 085657271886 Obat Penggugur Kandungan...
Jual Obat Aborsi Hongkong ( Asli No.1 ) 085657271886 Obat Penggugur Kandungan...ZurliaSoop
 
How to Give a Domain for a Field in Odoo 17
How to Give a Domain for a Field in Odoo 17How to Give a Domain for a Field in Odoo 17
How to Give a Domain for a Field in Odoo 17Celine George
 
General Principles of Intellectual Property: Concepts of Intellectual Proper...
General Principles of Intellectual Property: Concepts of Intellectual  Proper...General Principles of Intellectual Property: Concepts of Intellectual  Proper...
General Principles of Intellectual Property: Concepts of Intellectual Proper...Poonam Aher Patil
 
Python Notes for mca i year students osmania university.docx
Python Notes for mca i year students osmania university.docxPython Notes for mca i year students osmania university.docx
Python Notes for mca i year students osmania university.docxRamakrishna Reddy Bijjam
 
Kodo Millet PPT made by Ghanshyam bairwa college of Agriculture kumher bhara...
Kodo Millet  PPT made by Ghanshyam bairwa college of Agriculture kumher bhara...Kodo Millet  PPT made by Ghanshyam bairwa college of Agriculture kumher bhara...
Kodo Millet PPT made by Ghanshyam bairwa college of Agriculture kumher bhara...pradhanghanshyam7136
 
2024-NATIONAL-LEARNING-CAMP-AND-OTHER.pptx
2024-NATIONAL-LEARNING-CAMP-AND-OTHER.pptx2024-NATIONAL-LEARNING-CAMP-AND-OTHER.pptx
2024-NATIONAL-LEARNING-CAMP-AND-OTHER.pptxMaritesTamaniVerdade
 
TỔNG ÔN TẬP THI VÀO LỚP 10 MÔN TIẾNG ANH NĂM HỌC 2023 - 2024 CÓ ĐÁP ÁN (NGỮ Â...
TỔNG ÔN TẬP THI VÀO LỚP 10 MÔN TIẾNG ANH NĂM HỌC 2023 - 2024 CÓ ĐÁP ÁN (NGỮ Â...TỔNG ÔN TẬP THI VÀO LỚP 10 MÔN TIẾNG ANH NĂM HỌC 2023 - 2024 CÓ ĐÁP ÁN (NGỮ Â...
TỔNG ÔN TẬP THI VÀO LỚP 10 MÔN TIẾNG ANH NĂM HỌC 2023 - 2024 CÓ ĐÁP ÁN (NGỮ Â...Nguyen Thanh Tu Collection
 
microwave assisted reaction. General introduction
microwave assisted reaction. General introductionmicrowave assisted reaction. General introduction
microwave assisted reaction. General introductionMaksud Ahmed
 
Making communications land - Are they received and understood as intended? we...
Making communications land - Are they received and understood as intended? we...Making communications land - Are they received and understood as intended? we...
Making communications land - Are they received and understood as intended? we...Association for Project Management
 
Magic bus Group work1and 2 (Team 3).pptx
Magic bus Group work1and 2 (Team 3).pptxMagic bus Group work1and 2 (Team 3).pptx
Magic bus Group work1and 2 (Team 3).pptxdhanalakshmis0310
 
Introduction to Nonprofit Accounting: The Basics
Introduction to Nonprofit Accounting: The BasicsIntroduction to Nonprofit Accounting: The Basics
Introduction to Nonprofit Accounting: The BasicsTechSoup
 
Micro-Scholarship, What it is, How can it help me.pdf
Micro-Scholarship, What it is, How can it help me.pdfMicro-Scholarship, What it is, How can it help me.pdf
Micro-Scholarship, What it is, How can it help me.pdfPoh-Sun Goh
 
Seal of Good Local Governance (SGLG) 2024Final.pptx
Seal of Good Local Governance (SGLG) 2024Final.pptxSeal of Good Local Governance (SGLG) 2024Final.pptx
Seal of Good Local Governance (SGLG) 2024Final.pptxnegromaestrong
 

KĂźrzlich hochgeladen (20)

Understanding Accommodations and Modifications
Understanding  Accommodations and ModificationsUnderstanding  Accommodations and Modifications
Understanding Accommodations and Modifications
 
Explore beautiful and ugly buildings. Mathematics helps us create beautiful d...
Explore beautiful and ugly buildings. Mathematics helps us create beautiful d...Explore beautiful and ugly buildings. Mathematics helps us create beautiful d...
Explore beautiful and ugly buildings. Mathematics helps us create beautiful d...
 
PROCESS RECORDING FORMAT.docx
PROCESS      RECORDING        FORMAT.docxPROCESS      RECORDING        FORMAT.docx
PROCESS RECORDING FORMAT.docx
 
SOC 101 Demonstration of Learning Presentation
SOC 101 Demonstration of Learning PresentationSOC 101 Demonstration of Learning Presentation
SOC 101 Demonstration of Learning Presentation
 
Basic Civil Engineering first year Notes- Chapter 4 Building.pptx
Basic Civil Engineering first year Notes- Chapter 4 Building.pptxBasic Civil Engineering first year Notes- Chapter 4 Building.pptx
Basic Civil Engineering first year Notes- Chapter 4 Building.pptx
 
1029 - Danh muc Sach Giao Khoa 10 . pdf
1029 -  Danh muc Sach Giao Khoa 10 . pdf1029 -  Danh muc Sach Giao Khoa 10 . pdf
1029 - Danh muc Sach Giao Khoa 10 . pdf
 
Dyslexia AI Workshop for Slideshare.pptx
Dyslexia AI Workshop for Slideshare.pptxDyslexia AI Workshop for Slideshare.pptx
Dyslexia AI Workshop for Slideshare.pptx
 
Jual Obat Aborsi Hongkong ( Asli No.1 ) 085657271886 Obat Penggugur Kandungan...
Jual Obat Aborsi Hongkong ( Asli No.1 ) 085657271886 Obat Penggugur Kandungan...Jual Obat Aborsi Hongkong ( Asli No.1 ) 085657271886 Obat Penggugur Kandungan...
Jual Obat Aborsi Hongkong ( Asli No.1 ) 085657271886 Obat Penggugur Kandungan...
 
How to Give a Domain for a Field in Odoo 17
How to Give a Domain for a Field in Odoo 17How to Give a Domain for a Field in Odoo 17
How to Give a Domain for a Field in Odoo 17
 
General Principles of Intellectual Property: Concepts of Intellectual Proper...
General Principles of Intellectual Property: Concepts of Intellectual  Proper...General Principles of Intellectual Property: Concepts of Intellectual  Proper...
General Principles of Intellectual Property: Concepts of Intellectual Proper...
 
Python Notes for mca i year students osmania university.docx
Python Notes for mca i year students osmania university.docxPython Notes for mca i year students osmania university.docx
Python Notes for mca i year students osmania university.docx
 
Kodo Millet PPT made by Ghanshyam bairwa college of Agriculture kumher bhara...
Kodo Millet  PPT made by Ghanshyam bairwa college of Agriculture kumher bhara...Kodo Millet  PPT made by Ghanshyam bairwa college of Agriculture kumher bhara...
Kodo Millet PPT made by Ghanshyam bairwa college of Agriculture kumher bhara...
 
2024-NATIONAL-LEARNING-CAMP-AND-OTHER.pptx
2024-NATIONAL-LEARNING-CAMP-AND-OTHER.pptx2024-NATIONAL-LEARNING-CAMP-AND-OTHER.pptx
2024-NATIONAL-LEARNING-CAMP-AND-OTHER.pptx
 
TỔNG ÔN TẬP THI VÀO LỚP 10 MÔN TIẾNG ANH NĂM HỌC 2023 - 2024 CÓ ĐÁP ÁN (NGỮ Â...
TỔNG ÔN TẬP THI VÀO LỚP 10 MÔN TIẾNG ANH NĂM HỌC 2023 - 2024 CÓ ĐÁP ÁN (NGỮ Â...TỔNG ÔN TẬP THI VÀO LỚP 10 MÔN TIẾNG ANH NĂM HỌC 2023 - 2024 CÓ ĐÁP ÁN (NGỮ Â...
TỔNG ÔN TẬP THI VÀO LỚP 10 MÔN TIẾNG ANH NĂM HỌC 2023 - 2024 CÓ ĐÁP ÁN (NGỮ Â...
 
microwave assisted reaction. General introduction
microwave assisted reaction. General introductionmicrowave assisted reaction. General introduction
microwave assisted reaction. General introduction
 
Making communications land - Are they received and understood as intended? we...
Making communications land - Are they received and understood as intended? we...Making communications land - Are they received and understood as intended? we...
Making communications land - Are they received and understood as intended? we...
 
Magic bus Group work1and 2 (Team 3).pptx
Magic bus Group work1and 2 (Team 3).pptxMagic bus Group work1and 2 (Team 3).pptx
Magic bus Group work1and 2 (Team 3).pptx
 
Introduction to Nonprofit Accounting: The Basics
Introduction to Nonprofit Accounting: The BasicsIntroduction to Nonprofit Accounting: The Basics
Introduction to Nonprofit Accounting: The Basics
 
Micro-Scholarship, What it is, How can it help me.pdf
Micro-Scholarship, What it is, How can it help me.pdfMicro-Scholarship, What it is, How can it help me.pdf
Micro-Scholarship, What it is, How can it help me.pdf
 
Seal of Good Local Governance (SGLG) 2024Final.pptx
Seal of Good Local Governance (SGLG) 2024Final.pptxSeal of Good Local Governance (SGLG) 2024Final.pptx
Seal of Good Local Governance (SGLG) 2024Final.pptx
 

Grade 9 U0-L5-Graphing

  • 2. Age (months) Height (inches) 18 76.1 19 77 20 78.1 21 22 78.8 23 79.7 24 79.9 25 81.1 26 81.2 27 82.8 28 29 83.5 Plot the data on a graph and make a prediction for the height at: • 21 months • 28 months • 5 years
  • 3. 1) Identify Dependent and Independent Variables • Before plotting the graph we must choose which variable is dependent and which is independent. • Independent Variable: Influences the dependent variable and is plotted on the horizontal axis. • Dependent Variable: Depends on the independent variable and is plotted on the vertical axis. • In this case which variable is the dependent variable and which variable is the independent variable?
  • 4. • Make your graph as large as possible by spreading out the data on each axis • Let each space stand for a convenient amount • In our example, what scale would you choose? 2) Choose your scale carefully
  • 5. 3) Plot the axes and data • Plot and label (include name of variable and unit) the independent variable on the horizontal axis (x) and the dependent variable on the vertical axis (y). • Plot each data point. These data points are sometimes referred to as a “scatterplot” • What does our data look like?
  • 6. 4) Title Your Graph • Just like you learned for a table, a graph title should be as descriptive as possible • Title should clearly state the purpose of the graph and include the independent and dependent variables • Choose a descriptive title for the graph we are using as an example
  • 7. How the Age of a __________Affects Its Height
  • 8. 5) Draw Line of Best Fit • Definition - A Line of Best is a straight line on a Scatterplot that comes closest to all of the dots on the graph. • A Line of Best Fit does not touch all of the dots. • A good technique is to try to get the same number of points above the line as below. • A Line of Best Fit is useful because it allows us to: • Understand the type and strength of the relationship between two sets of data. • Predict missing values. • Draw the line of best fit for our data
  • 9.
  • 10. Predicting Data with Scatterplots • Interpretation - Making a prediction for an unknown value within a range of known data • Extrapolation - Making a prediction for an unknown value outside of a range of known data. We must extend the line of best to do this. • More accurate: Interpretation • Less accurate: Extrapolation • Can you use the graph we made to interpolate and extrapolate the required data?
  • 11.
  • 12. • Recall that we want to make a prediction of the height in 5 years. • Extrapolating the graph to this point would require drawing the graph with a much larger scale. • Let’s try determining the equation of the line and using this to make a prediction. Predicting Data by Using the Equation of a Line:
  • 13. The Equation of the Line • The equation of a line comes in the form: y = mx + b • m is the slope. • b is the y-intercept, this is the y-value where the line crosses the y-axis when x = 0.
  • 14. • The slope of a line (m) gives the rate at which our dependent variable changes with respect to the independent variable. • We can find the slope of the line by using any two points on the line of best fit. • These points do not have to be from the data. The Slope of the Line
  • 15.
  • 16. • To calculate the slope we can use the formula: 𝑠𝑙𝑜𝑝𝑒 = Δ𝑦 Δ𝑥 = 𝑦2 − 𝑦1 𝑥2 − 𝑥1 • The points are: (x1, y1) = (19, 77) (x2, y2) = (28, 82.9) 𝑠𝑙𝑜𝑝𝑒 = 82.9 − 77 28 − 19 = 5.9 9 = 0.65 The Slope of the Line
  • 17. • What does this slope mean? • Let’s look at the units … • y is inches, x is months. • Therefore this slope means that on average the _____ grows by 0.65 inches per month. • m = 0.65 inches/month The Slope of the Line
  • 18. The Equation of the Line • Since our graph does not start at x = 0 we will use the equation of the line, and one point from the line to solve for the y-intercept (b): 𝑦 = 𝑚𝑥 + 𝑏 𝑠𝑙𝑜𝑝𝑒 = 𝑚 = 0.65 𝑦 = 0.65𝑥 + 𝑏 • Now let’s find a point on the line. 𝑥, 𝑦 = (22, 79) 𝑦 = 0.65𝑥 + 𝑏 79 = 0.65 22 + 𝑏 79 = 14.3 + 𝑏 79 − 14.3 = 𝑏 64.7 = 𝑏 • Therefore 𝑦 = 0.65𝑥 + 64.7
  • 19.
  • 20. • We can now use this equation to determine the height in 5 years. • 𝑦 = 0.65𝑥 + 64.7 • What is 𝑥? The age in months. • What is 𝑦? The height in inches. Therefore 5 years in months would be: 𝑥 = 12 5 = 60 The Equation of the Line
  • 21. • Since 𝑥 = 12 5 = 60 • Plugging into our equation of the line: 𝑦 = 0.65𝑥 + 64.7 𝑦 = 0.65 60 + 64.7 𝑦 = 39 + 64.7 𝑦 = 103.7 𝑖𝑛𝑐ℎ𝑒𝑠 • Therefore the height in 5 years would be 103.7 inches. The Equation of the Line
  • 22. Practice Questions 1. Please read page 18 w/b 2. w/b page 19 & 20, 21, 23 3. Hand – in work sheet