
Empfohlen
Weitere ähnliche Inhalte
Was ist angesagt?
Was ist angesagt? (20)
Andere mochten auch
Andere mochten auch (20)
Ähnlich wie Day1 2 1
Ähnlich wie Day1 2 1 (20)
Mehr von groundwatercop
Mehr von groundwatercop (20)
Kürzlich hochgeladen
Kürzlich hochgeladen (20)
Day1 2 1
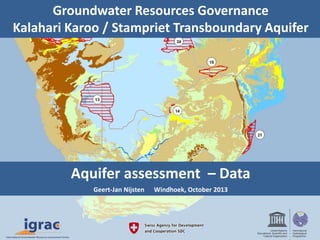
- 1. Groundwater Resources Governance Kalahari Karoo / Stampriet Transboundary Aquifer Aquifer assessment – Data Geert-Jan Nijsten Windhoek, October 2013
- 2. Groundwater assessment in general Environmental issues Socio-economic aspects Institutional settings Legal framework Hydrogeological Aspects Delineation and description Static data and time-variable Classification, diagnostic analysis and zoning Data harmonisation and information management 700 800 900 1000 1100 1200 1300 1400 (m ASL) NW SE 50 100 150 200 250 3000 (Km) K Kalahari Beds B Kalkland Basalt Do Karoo Dolerite R Rietmond Member A Auob Member M Mukorob Member N Nossob Member P.E. Pre-Ecca Group Geological Cross Section-6 2641823769 396 514 105658 6646 J-9(Sw art Modder) J-5(Martzivilla) 110 1288 392 528 GR-1 555 AC P-29 AC P-30 2931 12756 JO 5-N(7995)Goachas 452 DW A-2 J-8(Tw eeriver) 32272 328 1310 N N P.E. P.E. N P.E. Do P.E. B B M M M A A A A A R R R R R R K K K K Hoachanas Stampriet Gochas Auob R. Tweeriver Auob R. Section-3 Section-4 Section-2Section-1
- 3. Transboundary assessment: What’s so special ? • Sharing knowledge and data between countries • Harmonising information And ultimately to agree on: • Most important issues for priority action, and • Agree on the actions to be taken
- 4. Aquifer Assessment - a definition a consideration of all the facts about it (=the aquifer) and a judgement or opinion of the position and of what is likely to happen. source: Collins – English language dictionary This project: Administrative, hydrogeology, usage, governance, etc. Indicators Projections
- 5. Aquifer Assessment - 1: a consideration of all the facts about the aquifer and a judgement or opinion of the position and of what is likely to happen.
- 6. • Aquifer location and geometry (3D) • Countries sharing • Lithology of aquifer formations • Hydraulics: (un)confined, transmissivity, porosity • Hydrological: recharge rate, source and area, and an estimate of volume of groundwater resources • Natural water quality and vulnerability to pollution Table 5 in methodology report/handout Key aquifer properties - more or less Static -
- 7. Time dependent variables • Drivers: demography, climate, water supply and sanitation, water scarcity • Pressures : recharge, abstraction (groundwater + blue water), pollution, sea water intrusion • State: quantity, quality • Impact: human usage / dependency, impact on ecosystems • Responses: Legal instrument, institutional framework, law & regulations, incentives / hindrances, infrastructure Table 6 in methodology report/handout
- 8. Time dependent variables (1) Population Climate and replenishment of resource: – Rainfall and evapo(transpi)ration – Natural recharge and source of recharge – Managed aquifer recharge and induced recharge But also – Availability of surface water
- 9. Time dependent variables (2) Groundwater usage • Total groundwater abstractions • Abstraction per sector (domestic, agriculture, industry, wildlife, etc) But also: • Surface water usage
- 10. Time dependent variables (3) • Groundwater depletion / decline
- 11. Pollution related – Percentage of population covered by public sanitation services – Percentage of waste water treated before re- entering – Areas of aquifer exposed to pollution – Natural suitability of groundwater Time dependent variables (4)
- 12. “Groundwater services” • Groundwater dependent eco-systems (shallow water tables) • Groundwater dependent agricultural land (shallow water tables) • Agriculture irrigated by groundwater Time dependent variables (5)
- 13. Legal instruments • Existing agreements and their scope Institutional • Transboundary/Domestic, Mandate and Capacity Time dependent variables (6)
- 14. Implementation of laws / regulations: (incentives / disincentives) • Well drilling permits • Abstraction permits • Land use regulations and/or groundwater protection zones • Waste disposal regulations • Subsidies or taxes on wells / groundwater use • Subsidies on water savings schemes • Public awareness Time dependent variables (7)
- 15. Aquifer Assessment - 2: a consideration of all the facts about the aquifer and a judgement or opinion of the position and of what is likely to happen.
- 16. How to judge or give an opinion?
- 17. Using indicators To simplify complex systems
- 18. 20 indicators in 6 categories 1. Defining or constraining the value of aquifers and their potential functions 2. Role and importance of groundwater for humans & environment 3. Changes in groundwater state 4. Drivers of change and pressures 5. Enabling environment for TBA/SIDS resource management 6. Implementation of groundwater resources management measures The in-depth assessment will try to assess al 20 (TWAP does only 10) Table 7 in methodology report/handout
- 19. Indicator group 1: Defining or constraining the value of aquifers and their potential functions
- 20. Long term mean groundwater recharge, incl. man- made components. 1. Very low: < 2 mm/yr 2. Low: 2 -20 mm/yr 3. Medium: 20-100 mm/yr 4. High: 100-300 mm/yr 5. Very high: > 300 mm/yr 1.1 Recharge Rate
- 21. 1.2 Renewable groundwater per capita Long term mean gw recharge volume, incl. man-made components, divided by inhabitants on aquifer. 1. Low: < 1000 m3/yr/capita 2. Medium: 1000 – 5000 m3/yr/capita 3. High: > 5000 m3/yr/capita
- 22. Percentage of area of aquifer with natural groundwater quality satisfying local drinking water standards. 1.3 Natural Background Quality 1. Very low: < 20% 2. Low: 20 - 40% 3. Medium: 40-60% 4. High: 60-80% 5. Very high: > 80%
- 23. Indicator group 2: Role and importance of groundwater for humans & environment
- 24. Percentage of groundwater in total water abstraction for all human water uses. Groundwater Groundwater 2.1 Human dependancy on Groundwater 1. Very low: < 20% 2. Low: 20 -40% 3. Medium: 40-60% 4. High: 60-80% 5. Very high: > 80%
- 25. Indicator group 3: Changes in groundwater state
- 26. 1. Absent to very low: < 2 mm/yr 2. Low: 2 -20 mm/yr 3. Medium: 20-50 mm/yr 4. High: 50-100 mm/yr 5. Very high: > 100 mm/yr Current rate of long term decrease of groundwater storage averaged over aquifer area. 3.1 Groundwater depletion
- 27. Observed polluted zones as percentage of total aquifer. 3.2 Groundwater Pollution 1. Very low: < 5% 2. Low: 5 – 10% 3. Medium: 10-25% 4. High: 25-50% 5. Very high: > 50%
- 28. Indicator group 4: Drivers of change and pressures
- 29. Number of people on top of aquifer per unit of area. 4.1 Population Density on Transboundary Aquifer Very low: < 1 p/km2 2. Low: 1-10 p/km2 3. Medium: 10-100 p/km2 4. High: 100-1000 p/km2 5. Very high: > 1000 p/km2
- 30. Total annual groundwater abstraction divided by long- term mean annual recharge. 1. Very low: < 2% 2. Low: 2-20% 3. Medium: 20-50% 4. High: 50-100% 5. Very high: > 100% 4.2:
- 31. Indicator group 5: Enabling environment for TBA/SIDS resource management
- 32. Indicator group 5: Enabling environment for transboundary aquifer resources management/SIDS groundwater management (2 core out of 2) 5.1: Transboundary legal framework / SIDS groundwater management legal framework 1. None in existence, nor under preparation 2. under preparation or available as an unsigned draft 3. limited scope signed by all parties (e.g. agreement to co- operate or exchange information) 4. full scope for TBA management or SIDS groundwater management signed by all parties.
- 33. Indicator group 5: Enabling environment for transboundary aquifer resources management/SIDS groundwater management (2 core out of 2) 5.1: Transboundary institutional framework/SIDS groundwater management institutional framework Mandate and capacity for TBA/SIDS groundwater management 1. None in existence 2. Exist, but with limitations in mandate and/or capability 3. Domestic agencies do exist with full mandate and adequate capabilities 4. A special bi- or multi-national transboundary institution has been established with full mandate and adequate capabilities
- 34. Aquifer Assessment - 3: a consideration of all the facts about the aquifer and a judgement or opinion of the position and of what is likely to happen.
- 35. Indicative Projections for 2030 and 2050 Groundwater • Annual amount of renewable groundwater resources per capita (indicator 1.2) • Human dependency on groundwater (indicator 2.1) • Population density (indicator 4.1) • Groundwater development stress (indicator 4.2)
- 36. Thank you
Hinweis der Redaktion
- Presentation to give an idea about what an aquifer assessment entails. It will focus on the type of data to collect and how value can be added to these data by using indicators. Certain aspects of this will be dealed with in more detail tomorrow.
- Data harmonisation in particular, we will talk about in more detail tomorrow, but I thought it is good to get a clear understanding of groundwater assessment in general and transboundary assessment in particular. Now let’s move on to the proposed assessment methodology
- Aquifer assessment: a consideration of all the facts about the aquifer and a judgement or opinion of the position and of what is likely to happen. all the facts: describing an aquifer in many parameters as already touched upon by Jac: Different categories of variables: Static time dependent. “administrative, hydrogeological, usage, governance etc) judgement: indicators what is likely to happen: projections through modelling + expert judgement Will use this definition as a guide or general outline for my presentation.
- Aquifer assessment: a consideration of all the facts about the aquifer and a judgement or opinion of the position and of what is likely to happen. 1 – all the facts: Static data, not time dependent. Aquifer location and geometry: Boundary, horizontal extend, thickness, depth Countries sharing: names of countries, size of national segment Lithology: predominant lithology Hydraulic setting: type of voids, (un)confined, transmissivity Hydrological setting: source of recharge, discharge type, recharge amount, recharge area, gw volume Water quality: natural quality, vulnerability to polution
- Aquifer assessment: a consideration of all the facts about the aquifer and a judgement or opinion of the position and of what is likely to happen. 1 – all the facts: The additional 67! Parameters are time dependent parameters describing the aquifer more in depth. The parameters can be grouped into 5 main categories, based on the DPSIR framework of analyses (optional additional slide in the end)
- Explain the reasoning behind indicators: We’ll have more than 150 aquifers, some 50 Small Island Developing States and for each one of these we’re looking for 84 parameters MORE THAN 15000 data! How to go into part two of an assessment: judge or give an opinion of the position?
- Role of indicators: to simplify AND to bring a message across to none-hydrogeologists: policy makers / decision makers
- Explain that in total 20 indicators have been developed, but that we will use only 10 of them as the core indicators For budgetary reasons cut down from 20 to 10. Between Medium sized project and start of Full size project the methodology has been reviewed in this process the 20 indicators have been divided into two groups
- Explain that in total 20 indicators have been developed, but that we will use only 10 of them as the core indicators For budgetary reasons cut down from 20 to 10. Between Medium sized project and start of Full size project the methodology has been reviewed in this process the 20 indicators have been divided into two groups
- Recharge rate: Long-term mean ground-water recharge, including man-made components (return-flows, induced recharge, artificial recharge), divided by area Example: Netherlands groundwater recharge in the order of 300 – 350 mm Remember some research I took part in in the Kalahari desert: recharge rates in an order of magnitude of 10th of mm to mm. REASON FOR CLASSIFICATIONS: Again to simplify to get the message across!
- Renewable groundwater resources per capita: Long-term mean ground-water recharge (VOLUME), including man-made components, divided by the number of inhabitants of the area occupied by the aquifer This gives an indication of the sustainability of the system and the carrying capacity of the groundwater system in relation to the population.
- Natural background quality: Percentage of the area occupied by the aquifer where groundwater is found of which natural quality satisfies local drinking water standards
- Explain that in total 20 indicators have been developed, but that we will use only 10 of them as the core indicators For budgetary reasons cut down from 20 to 10. Between Medium sized project and start of Full size project the methodology has been reviewed in this process the 20 indicators have been divided into two groups
- Definitions: Human dependency on groundwater: Percentage of groundwater in total water abstraction for all human water uses. So this includes: domestic, agricultural and industrial
- Explain that in total 20 indicators have been developed, but that we will use only 10 of them as the core indicators For budgetary reasons cut down from 20 to 10. Between Medium sized project and start of Full size project the methodology has been reviewed in this process the 20 indicators have been divided into two groups
- Groundwater depletion: Observed current rate of long-term progressive decrease of groundwater storage (accompanied by steadily declining ground-water levels), expressed as an equivalent depth of water averaged over the aquifer. NOTE: depletion is NOT the same as water level decline or cone of depression!
- Groundwater pollution: Observed polluted zones as a percentage of total aquifer area (due to pollution caused water quality to exceed drinking water quality standards)
- Explain that in total 20 indicators have been developed, but that we will use only 10 of them as the core indicators For budgetary reasons cut down from 20 to 10. Between Medium sized project and start of Full size project the methodology has been reviewed in this process the 20 indicators have been divided into two groups
- Population density: Number of people per unit of area on top of the aquifer All components will be using the same data of “Gridded population of the world” a 10 x 10 km2 grid?! consistency between the TWAP components
- Groundwater development stress: Total annual groundwater abstraction divided by long-term mean annual groundwater recharge Note: It’s not by definition “good enough” to stay below 100% It depends on the system what is a critical value. In some systems 20% might already cause problems.
- Explain that in total 20 indicators have been developed, but that we will use only 10 of them as the core indicators For budgetary reasons cut down from 20 to 10. Between Medium sized project and start of Full size project the methodology has been reviewed in this process the 20 indicators have been divided into two groups
- Transboundary legal framework/SIDS groundwater management legal framework: Existence, status and comprehensiveness of a binding agreement on the transboundary aquifer or SIDS groundwater under consideration GOVERNANCE ASPECTS
- GOVERNANCE ASPECTS continued Transboundary institutional framework/SIDS groundwater management institutional framework: Existence, mandate and capabilities of institutions or institutional arrangements for managing the transboundary aquifer or SIDS groundwater under consideration (all types of interventions)
- Aquifer assessment: a consideration of all the facts about the aquifer and a judgement or opinion of the position and of what is likely to happen. 3 – what is likely to happen: projections through modelling + expert judgement
- In the TWAP project the university of Frankfurt is working with a