2024: Domino Containers - The Next Step. News from the Domino Container commu...
City vs suburbs 3.26 chicre
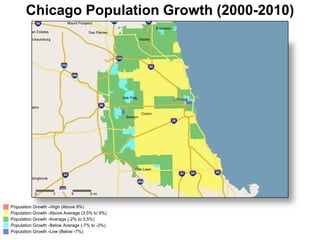
1. Population Growth -Low (Below -7%)
Population Growth -Below Average (-7% to -2%)
Population Growth -Average (-2% to 3.5%)
Population Growth -Above Average (3.5% to 9%)
Population Growth –High (Above 9%)
Chicago Population Growth (2000-2010)
2. Chicago Population Growth (2013-2018)
Population Growth -Low (Below -7%)
Population Growth -Below Average (-7% to -2%)
Population Growth -Average (-2% to 3.5%)
Population Growth -Above Average (3.5% to 9%)
Population Growth –High (Above 9%)
3. Chicago 20-34 Cohort Growth (2000-2010)
20-34 Year Old Population Growth –Low (Below -0.9%)
20-34 Year Old Population Growth -Below Average (-0.9% to -0.2%)
20-34 Year Old Population Growth -Average (-0.2% to 0.5%)
20-34 Year Old Population Growth -Above Average (0.5% to 1.25%)
20-34 Year Old Population Growth -High (Above 1.25%)
4. Chicago 20-34 Cohort Growth (2013-2018)
20-34 Year Old Population Growth –Low (Below -0.9%)
20-34 Year Old Population Growth -Below Average (-0.9% to -0.2%)
20-34 Year Old Population Growth -Average (-0.2% to 0.5%)
20-34 Year Old Population Growth -Above Average (0.5% to 1.25%)
20-34 Year Old Population Growth -High (Above 1.25%)
6. 0%
6%
12%
18%
24%
Suburbs City United States
2007-2011 2012 2013 2014*
AverageVacancyRate
Chicago Office Vacancy Rate Trends
* Forecast
Sources: Marcus & Millichap Research Services, CoStar Group, Inc.
7. Chicago Office Asking Rent Trends
-10%
-5%
0%
5%
10%
Suburbs City United States
2008-2011 2012 2013 2014*
Y-O-YPercentChange
* Forecast
Sources: Marcus & Millichap Research Services, CoStar Group, Inc.
8. 0
70
140
210
280
Suburbs City
2005-2011 2012 2013*
TotalTransactions
Chicago Office Transaction Activity
* Estimate
Includes sales $1,000,000 and greater
Sources: Marcus & Millichap Research Services, CoStar Group, Inc., Real Capital Analytics
9. 2%
4%
6%
8%
10%
Suburbs City United States
2005-2011 2012 2013
AverageCapRate
Office Cap Rate Trends
Includes sales $1,000,000 and greater
Sources: Marcus & Millichap Research Services, CoStar Group, Inc., Real Capital Analytics