SlideShare ist ein Scribd-Unternehmen logo
1 von 9
Downloaden Sie, um offline zu lesen
British Geological Survey
Risk list 2011 — Current supply risk index for chemical elements or element groups which are of economic value

Element or element group                                    Symbol                  Relative supply   Leading producer
                                                                                      risk index
antimony                                                       Sb                         8.5              China
platinum group elements                                       PGE                         8.5           South Africa
mercury                                                        Hg                         8.5              China
tungsten                                                       W                          8.5               China
rare earth elements                                           REE                         8.0               China
niobium                                                       Nb                          8.0               Brazil
strontium                                                      Sr                         7.5               China
bismuth                                                        Bi                         7.0               China
thorium                                                       Th                          7.0                India
bromine                                                        Br                         7.0                USA
carbon (graphite)                                              C                          7.0               China
rhenium                                                       Re                          6.5               Chile
iodine                                                          I                         6.5               Chile
indium                                                         In                         6.5               China
germanium                                                     Ge                          6.5               China
beryllium                                                     Be                          6.5                USA
molybdenum                                                    Mo                          6.5              Mexico
helium                                                        He                          6.5                USA
tin                                                           Sn                          6.0               China
arsenic                                                       As                          6.0               China
silver                                                        Ag                          6.0                Peru
tantalum                                                       Ta                         6.0             Rwanda
manganese                                                     Mn                          5.5               China
magnesium                                                     Mg                          5.5               China
cobalt                                                        Co                          5.5                DRC
gold                                                          Au                          5.5               China
cadmium                                                       Cd                          5.5               China
lithium                                                        Li                         5.5             Australia
calcium                                                       Ca                          5.5               China
phosphorous                                                    P                          5.0               China
barium                                                        Ba                          5.0               China
boron                                                          B                          4.5              Turkey
zirconium                                                      Zr                         4.5             Australia
vanadium                                                       V                          4.5              Russia
lead                                                          Pb                          4.5               China
potassium                                                      K                          4.5              Canada
gallium                                                       Ga                          4.5               China
fluorine                                                        F                         4.5               China
copper                                                        Cu                          4.5               Chile
selenium                                                      Se                          4.5               Japan
carbon (coal)                                                  C                          4.5               China
zinc                                                          Zn                          4.0               China
uranium                                                        U                          4.0            Kazakhstan
nickel                                                        Ni                          4.0              Russia
chlorine                                                       Cl                         4.0               China
sodium                                                        Na                          4.0               China
carbon (diamonds)                                              C                          4.0              Russia
sulphur                                                        S                          3.5               China
iron                                                          Fe                          3.5               China
chromium                                                       Cr                         3.5              Canada
aluminium                                                      Al                         3.5             Australia
titanium                                                       Ti                         2.5             Australia
Supply risk index runs from 1 (blue — very low risk) to 10 (red — very high risk)
Copyright NERC 2011
Limitations and methodology are set out in accompanying notes
Risk List 2011                                             British Geological Survey

A new supply risk index for chemical elements or element groups
which are of economic value
The risk list gives a quick and simple indication of the relative risk in 2011 to the supply of the 52
chemical elements or element groups which we need to maintain our economy and lifestyle. The
position of an element on this list is determined by a number of factors which might impact on
supply. These include the abundance of elements in the Earth’s crust, the location of current
production and reserves, and the political stability of those locations. Data sources used in the
compilation of the list are internationally recognised and publicly available.

The risk list highlights a group of elements where global production is concentrated in a very few
countries. The restricted supply base and the relatively low political stability ratings for some major
producing countries combine to significantly increase risk to supply. Restriction on the availability of
rare earth elements has received a good deal of attention recently and this group features close to
the top of the list. However, the list highlights other economically important metals with similar high
levels of risk to supply disruption including platinum group metals (active component in auto-
catalysts), niobium (used in MRI scanners and touch screens) and tungsten (key hard metal used in
almost all cutting tools). The list also shows the current importance of China in production of many
metals and minerals. China is now the leading global producer of 27 of the 52 elements and element
groups on the list (and as shown in Figure 1).

As demand for metals and minerals increases, driven by relentless growth in the emerging
economies in Asia and South America, competition for resources is growing. The risk list gives an
indication which elements might be subject to supply disruption, most likely from human factors
such as geopolitics (‘haves’ seeking to influence ‘have nots’) or resource nationalism (state control of
production), along with events such as strikes and accidents. Policy-makers, industry and consumers
should be concerned about supply risk and the need to diversify supply from Earth resources, from
recycling more and doing more with less, and also about the environmental implications of
burgeoning consumption.

The list focuses on risks to supply and does not include any assessment of factors that influence
demand, such as criticality of an element to a particular technology or how easy it is to substitute
that element with another.

A more in-depth discussion of the risk list methodology and limitations can be found below.


www.mineralsuk.com
Risk List 2011                                               British Geological Survey

                                   South Africa,
         Kazakhstan, 1                   1                        Where in the world do
                               Mexico, 1    Rwanda, 1             the elements we need
            Japan, 1                Peru, 1      Turkey, 1        come from?
            India, 1

        DRC, 1
    Brazil, 1
  Canada,

             USA, 3                                                                   China, 27

                Chile, 3

                       Russia, 3

                                    Australia, 4


   Figure 1. Chart indicates the number of times a country is the leading global producer of an
   element or element group of economic value.
   Source: BGS World Mineral Statistics


Methodology for estimating the relative risk to supply of the chemical elements

The following methodology was used to define the relative risk to supply of the following elements:

Ag; Al; As; Au; B; Ba; Be; Bi; Br; C (coal, diamond and graphite); Ca; Cd; Cl; Co; Cr; Cu; F; Fe; Ga; Ge;
He; Hg; I; In; K; Li; Mg; Mn; Mo; Na; Nb; Ni; P; Pb; PGE (Ru, Pd, Os, Ir and Pt) ; Re; REE (La, Ce, Pr, Nd,
Sm, Eu, Gd, Tb, Dy, Ho, Er, Tm, Yb and Lu); S; Sb; Se; Sn; Sr; Ta; Th; Ti; U; V; W; Zn; and Zr.

Elements not included are those for which insufficient data exist. An Excel spreadsheet was used to
rank the above elements in terms of the relative risk to supply. The ranking system was based on
four criteria scored between 1 and 5.

       Scarcity
       Production concentration
       Reserve base distribution
       Governance

A score of 1 indicates that a particular criterion has a low contribution to supply risk, while a score of
5 indicates a high risk. The scores for each criterion were summed to give an overall risk to supply,
the larger the score the greater the potential risk to supply. Each criterion was given equal weight.
The elements were ranked according to their score and a gradational colour scale applied such that
increased risk is indicated by hotter colours.


www.mineralsuk.com
Risk List 2011                                                      British Geological Survey

Scarcity

Crustal abundances (Table 1) provide an indication of the scarcity of a given element on a global
scale. For example, gold would be classified as high-risk due to its low crustal abundance of 0.0013
ppm, while iron would classified as low-risk with a crustal abundance of about 52,157 ppm.

The scores were allocated as follows:

1 (low)                      >100 to 1000 ppm
2 (medium to low)            >10 to 100 ppm
3 (medium)                   >1 to 10 ppm
4 (medium to high)           >0.1 to 1 ppm
5 (high)                     <0.1 ppm

Where data are unavailable an arbitrary score of 2 was allocated. For example, He is allocated a
score of 2 since crustal abundance data is unavailable.

 Element     Abundance (ppm)         Element     Abundance (ppm)
 Ag          0.055                   Mn          774
 Al          84,149                  Mo          0.8
 As          2.5                     Na          22,774
 Au          0.0013                  Nb          8
 B           11                      Nd          20
 Ba          456                     Ni          26.6
 Be          1.9                     Os          0.000041
 Bi          0.18                    P           567
 Br          0.88                    Pb          11
 Cd          0.08                    Pd          0.0015
 Ce          43                      Pr          4.9
 Co          26.6                    Pt          0.0015
 Cr          135                     Re          0.000188
 Cu          27                      Ru          0.00057
 Dy          3.6                     S           404
 Er          2.1                     Sb          0.2
 Eu          1.1                     Se          0.13
 F           553                     Sm          3.9
 Fe          52,157                  Sn          1.7
 Ga          16                      Sr          320
 Gd          3.7                     Ta          0.7
 Ge          1.3                     Tb          0.6
 Hg          0.03                    Th          5.6
 Ho          0.77                    Ti          4136
 I           0.71                    Tm          0.28
 In          0.052                   U           1.3
 Ir          0.000037                V           138
 K           15 025                  W           1
 La          20                      Yb          1.9
 Li          16                      Zn          72
 Lu          0.3                     Zr          132
 Mg          28 104

Table 1. Average total crustal abundance of the elements included in this study. Data from Rudnick and Gao (2003).


www.mineralsuk.com
Risk List 2011                                          British Geological Survey

Production concentration

Where the production of a given commodity is concentrated in a few countries this can increase the
risk to supply. For example, about 83 per cent of the world’s tungsten is currently sourced from
China. The BGS’ World Mineral Production data (2005-2009) were used to identify the top three
producing countries and the percentage of world supply for which the leading country is responsible.

The percentage production for the top three countries was scored as follows:

1 (low)                 0 to 30 %
2 (medium-low)          >30 to 45 %
3 (medium)              >45 to 60 %
4 (medium-high)         >60 to 75 %
5 (high)                >75 %

Reserve base distribution

It is important to assess where elements might be sourced in the future. However, for many
elements the global distribution of resources is poorly known, while reserves1 are often localised.
Accordingly we have used reserve base2 distribution data from the USGS to provide an indication of
future sources of supplies. Where the reserve base of a given commodity is concentrated in a few
countries this leads to increased risk to future supplies. For example, nearly 87 per cent of the
world’s reserve base of niobium is found in Brazil. The USGS’ Commodity Summaries (2009) reserve
base data were used to identify the three countries contributing the largest share to the global
reserve base and the percentage of the world reserve base held by the top country.

The percentage of the global reserve base held by the top three countries was scored as follows:

1 (low)                 0 to 30 %
2 (medium-low)          >30 to 45 %
3 (medium)              >45 to 60 %
4 (medium-high)         >60 to 75 %
5 (high)                >75 %

Where data are unavailable an arbitrary score of 2 was allocated. For example, Be, As, Na, S, In, Cl,
Ca and Ge are allocated a score of 2 since reserve base information is unavailable. Reserve base data
are also unavailable for coal; however, reserve data for 2008 are available from the Energy
Information Administration (EIA).


www.mineralsuk.com
Risk List 2011                                                         British Geological Survey

Governance indicators

The political stability of a producing country may impact upon the supply of mineral commodities
e.g. supplies may be interrupted by war, government intervention, famine or other forms of unrest.
A combined overall political stability score was calculated, using World Bank (WB) governance
indicators, for the leading three producing countries. The World Bank website provides percentile
rank information for 213 countries on six different criteria: voice and accountability; political
stability; government effectiveness; regulatory equality; rule of law; and control of corruption. Only
political stability was considered as part of this study.

Countries with a political stability percentile of <33.3 per cent were scored 3, those with a percentile
between >33.3 and 66.6 per cent were scored 2 and those with a percentile of >66.6 per cent were
scored 1.

A combined overall political stability value was calculated by summing the individual political
stability scores for the three leading global producers for each element and scored as follows:

1 (low)                       0 to 2
2 (medium-low)                3 to 4
3 (medium)                    5 to 6
4 (medium-high)               7 to 8
5 (high)                      9

For example, the three leading producing countries for REE are China, Brazil and Russia. Their
combined political stability factor would be calculated thus: China (WB percentile rank is 29.7 = 3),
Brazil (WB percentile rank is 54.2 = 2), and Russia (WB percentile rank is 21.7 = 3), as shown in Figure
2. Combining these scores gives a combined political stability factor of 8 which equates to an overall
score of 4 (medium-high risk).


Figure 2. Political stability indicators for Brazil, China and Russia. Data from the World Bank after Kaufmann et al. (2010).


www.mineralsuk.com
Risk List 2011                                                       British Geological Survey

Supply risk

An integrated supply risk was calculated by combining the scores for each of the four criteria. This is
illustrated for two elements, iron and niobium, in Table 2.

 Category                                          Iron Score               Niobium Score
                                              Value          Score       Value        Score
 Crustal abundance (ppm)                    56,300        1            8           3
 Reserve base distribution (%)              21.4          1            86.7        5
 Production concentration (%)               39.1          2            95.8        5
 Political Stability                        6             3            6           3
 Total                                                    7                        16
 Supply Risk Index (Total/ 2)                             3.5                      8

Table 2. The calculation of a supply risk index.

Aggregate scores were divided by 2 to produce a simple supply risk index from 1 (very low risk) to 10
(very high risk). For example, iron has an initial aggregate score of 7. This is divided by 2 to give a
score of 3.5. This shows that iron has a lower relative risk to supply compared to niobium with a
score of 8.

Limitations to the methodology

Previous studies of this nature have included information pertaining to the environment, supply and
demand, TMR (total material requirements), climate change, and substitution and recycling. This
study omits many of these factors. For instance, we have not taken into account the potential
impact of supply disruptions e.g. Hg is little used therefore the impact would be less than for an
interrupted supply of PGE.

IMPORTANTLY - this represents a ‘snapshot’ in time and does not take in to account future issues
and supply-demand scenarios. The minerals market is not static, new reserves are continually added
in response to drivers such as demand and advances in technology. Also recycling is likely to
contribute an increasing share to the global market in the future.

Crustal abundance values do not take into account crustal dispersion, nor do they account for the
tendency of an element to become economically concentrated.

Where more than one mineral source exists for a given element e.g. Ti occurring in rutile, leucoxene
and ilmenite, all sources have been combined to give a total.

Where appropriate, groups of elements have been combined and dealt with a single commodity e.g.
PGE and REE. For these grouped elements a worst case scenario has been taken in terms of the
crustal abundance e.g. Lu at 0.3 ppm has been used to calculate the crustal abundance risk for REE
rather than Ce at 43 ppm. Likewise, Ir 0.000037 ppm has been used to calculate the crustal
abundance risk for PGE rather than Pd at 0.0015 ppm.


www.mineralsuk.com
Risk List 2011                                                      British Geological Survey
Certain commodities have been used as a proxy for a given element; this approach may mean that
not all sources of an element have been included in the production and reserve base calculations
(Table 3).

 Element                               Proxy
 Sodium                                Halite - NaCl (+ sea salt and brine)
 Calcium                               Lime - CaO
 Fluorine                              Fluorspar - CaF2
 Carbon                                Coal, diamonds, and graphite
 Barium                                Barytes - BaSO4
 Beryllium                             Beryl - Be3Al2(SiO3)6
 Boron                                 Borate
 Potassium                             Potash - K2O content
 Titanium                              Rutile and Ilmenite - TiO2 and FeTiO3
 Magnesium                             Magnesite - MgCO3
 REE                                   Rare Earth Oxides (REO)

Table 3 - Element proxies used in production and reserve base calculations.


Mineral resources3 have been omitted from this study since resources are not measured and the
global distribution is poorly defined.

Elements that have little or no commercial use have been omitted from this study e.g. Po, At, and
Ra. Likewise, synthetic or ‘manufactured’ elements have also been omitted e.g. elements of atomic
number 95 to 114, and H. Elements naturally occurring in a gaseous state are also not included e.g.
the Noble gases, O and N because the criteria used are unsuitable for assessing the supply risk of
these elements. Production and reserve base information for some of the minor metals e.g. Sc, Y, Cs,
Te, Tl, and Rb is unavailable because they are commonly produced as by-products or as co-metals.
For example, Y is often associated with REE-bearing minerals; Sc is found in trace amounts in
minerals such as beryl, garnet and wolframite; Cs is often a by-product of Li extraction; and Te, along
with Se, is a common by-product of nickel and copper ore extraction.

Definitions

1. Reserves - a ‘mineral reserve’ is the part of the resource which has been fully geologically
   evaluated and is commercially and legally mineable. Reserves may be regarded as ‘working
   inventories’, which are continually revised in the light of various ‘modifying factors’ related to
   mining, metallurgy, economics, marketing, law, the environment, communities, government, etc,
   etc (USGS, 2010).

2. Reserve Base - the ‘reserve base’ includes the ‘mineral reserve’ plus those parts of the resources
   that have a reasonable potential for becoming economically available within planning horizons
   beyond those that assume proven technology and current economics. It has been a widely
   utilised concept. However, publication of reserve base estimates was discontinued in 2010 (USGS,
   2010).


www.mineralsuk.com
Risk List 2011                                                      British Geological Survey
3. Resources - a ‘mineral resource’ regroups all identified resources. It is a natural concentration of
   minerals or a body of rock that is, or may become, of potential economic interest as a basis for
   the extraction of a mineral commodity. A resource has physical and/ or chemical properties that
   make it suitable for specific uses and it is present in sufficient quantity to be of intrinsic economic
   interest. It encompasses ‘mineral reserve’ and ‘reserve base’ plus other identified resources
   which could be exploited in the future if required according to the economic situation (USGS,
   2010).


Figure 3 - Graphical representation of the relationship between reserves, the reserve base and resources.


References

British Geological Survey (2011) World mineral production 2005-2009. Available:
http://www.bgs.ac.uk/downloads/start.cfm?id=1987

Kaufmann, D., Kraay, A. and Mastruzzi, M. (2010) The Worldwide Governance Indicators:
Methodology and Analytical Issues. World Bank Policy Research Working Paper No. 5430. Available:
http://info.worldbank.org [accessed July 2011).

Rudnick, R.L. and Gao, S. (2003). Composition of the Continental Crust. In The Crust (ed. Rudnick
R.L.) volume 3, pages 1-64 of Treatise on Geochemistry (eds. Holland, H.D. and Turekian K.K.),
Elsevier-Pergamon, Oxford.

United States Geological Survey. (2009). Mineral Commodity Summaries [online]. Available:
www.usgs.gov [accessed July 2011).


www.mineralsuk.com

Weitere ähnliche Inhalte

Mehr von Christopher R Anderson

Maedels - June Edition - Predicting a bottom -
Maedels - June Edition - Predicting a bottom - Maedels - June Edition - Predicting a bottom -
Maedels - June Edition - Predicting a bottom - Christopher R Anderson
 
The lithium market is growing here is a very interesting commentary from cana...
The lithium market is growing here is a very interesting commentary from cana...The lithium market is growing here is a very interesting commentary from cana...
The lithium market is growing here is a very interesting commentary from cana...Christopher R Anderson
 

Mehr von Christopher R Anderson (20)

Graphite NB-Golden Gove Report
Graphite NB-Golden Gove ReportGraphite NB-Golden Gove Report
Graphite NB-Golden Gove Report
 
Graphite sept-1-2011
Graphite sept-1-2011Graphite sept-1-2011
Graphite sept-1-2011
 
Pan Am March Boca 2011 power point
Pan Am March Boca 2011 power pointPan Am March Boca 2011 power point
Pan Am March Boca 2011 power point
 
Rare earth elements summary
Rare earth elements summaryRare earth elements summary
Rare earth elements summary
 
Rare earth elements summary
Rare earth elements summaryRare earth elements summary
Rare earth elements summary
 
Arizona Real Estate
Arizona Real EstateArizona Real Estate
Arizona Real Estate
 
Keith Richards-review on his book
Keith Richards-review on his bookKeith Richards-review on his book
Keith Richards-review on his book
 
Aliance Mining nov final 2010 pp (9)
Aliance Mining nov final 2010 pp  (9)Aliance Mining nov final 2010 pp  (9)
Aliance Mining nov final 2010 pp (9)
 
November 19 2010
November 19 2010November 19 2010
November 19 2010
 
Kempt and Cowan Gold Mines
Kempt and Cowan Gold MinesKempt and Cowan Gold Mines
Kempt and Cowan Gold Mines
 
7waystousesocialmediatobuildbrands
7waystousesocialmediatobuildbrands7waystousesocialmediatobuildbrands
7waystousesocialmediatobuildbrands
 
RCR Quarterly Report- Oct-10-Copper
RCR Quarterly Report- Oct-10-CopperRCR Quarterly Report- Oct-10-Copper
RCR Quarterly Report- Oct-10-Copper
 
Facebook - Internet Marketing
Facebook - Internet MarketingFacebook - Internet Marketing
Facebook - Internet Marketing
 
Pan American Power Point Sept 2010
Pan American Power Point Sept 2010Pan American Power Point Sept 2010
Pan American Power Point Sept 2010
 
Ue pan american-news max-sept-2010
Ue pan american-news max-sept-2010Ue pan american-news max-sept-2010
Ue pan american-news max-sept-2010
 
Pan american article
Pan american articlePan american article
Pan american article
 
Investment rate
Investment rateInvestment rate
Investment rate
 
Maedels - June Edition - Predicting a bottom -
Maedels - June Edition - Predicting a bottom - Maedels - June Edition - Predicting a bottom -
Maedels - June Edition - Predicting a bottom -
 
First star presentation May 28 2010
First star presentation May 28  2010First star presentation May 28  2010
First star presentation May 28 2010
 
The lithium market is growing here is a very interesting commentary from cana...
The lithium market is growing here is a very interesting commentary from cana...The lithium market is growing here is a very interesting commentary from cana...
The lithium market is growing here is a very interesting commentary from cana...
 

Kürzlich hochgeladen

VIP 7001035870 Find & Meet Hyderabad Call Girls Miyapur high-profile Call Girl
VIP 7001035870 Find & Meet Hyderabad Call Girls Miyapur high-profile Call GirlVIP 7001035870 Find & Meet Hyderabad Call Girls Miyapur high-profile Call Girl
VIP 7001035870 Find & Meet Hyderabad Call Girls Miyapur high-profile Call Girladitipandeya
 
CALL ON ➥8923113531 🔝Call Girls Fazullaganj Lucknow best sexual service
CALL ON ➥8923113531 🔝Call Girls Fazullaganj Lucknow best sexual serviceCALL ON ➥8923113531 🔝Call Girls Fazullaganj Lucknow best sexual service
CALL ON ➥8923113531 🔝Call Girls Fazullaganj Lucknow best sexual serviceanilsa9823
 
Ambala Escorts Service ☎️ 6378878445 ( Sakshi Sinha ) High Profile Call Girls...
Ambala Escorts Service ☎️ 6378878445 ( Sakshi Sinha ) High Profile Call Girls...Ambala Escorts Service ☎️ 6378878445 ( Sakshi Sinha ) High Profile Call Girls...
Ambala Escorts Service ☎️ 6378878445 ( Sakshi Sinha ) High Profile Call Girls...mriyagarg453
 
VVIP Pune Call Girls Sopan Baug WhatSapp Number 8005736733 With Elite Staff A...
VVIP Pune Call Girls Sopan Baug WhatSapp Number 8005736733 With Elite Staff A...VVIP Pune Call Girls Sopan Baug WhatSapp Number 8005736733 With Elite Staff A...
VVIP Pune Call Girls Sopan Baug WhatSapp Number 8005736733 With Elite Staff A...SUHANI PANDEY
 
Collective Mining | Corporate Presentation - May 2024
Collective Mining | Corporate Presentation - May 2024Collective Mining | Corporate Presentation - May 2024
Collective Mining | Corporate Presentation - May 2024CollectiveMining1
 
Q3 FY24 Earnings Conference Call Presentation
Q3 FY24 Earnings Conference Call PresentationQ3 FY24 Earnings Conference Call Presentation
Q3 FY24 Earnings Conference Call PresentationSysco_Investors
 
SME IPO and sme ipo listing consultants .pptx
SME IPO and sme ipo listing consultants .pptxSME IPO and sme ipo listing consultants .pptx
SME IPO and sme ipo listing consultants .pptxindia IPO
 
slideshare Call girls Noida Escorts 9999965857 henakhan
slideshare Call girls Noida Escorts 9999965857 henakhanslideshare Call girls Noida Escorts 9999965857 henakhan
slideshare Call girls Noida Escorts 9999965857 henakhanhanshkumar9870
 
Pakistani Call girls in Ajman +971563133746 Ajman Call girls
Pakistani Call girls in Ajman +971563133746 Ajman Call girlsPakistani Call girls in Ajman +971563133746 Ajman Call girls
Pakistani Call girls in Ajman +971563133746 Ajman Call girlsgwenoracqe6
 
Collective Mining | Corporate Presentation - May 2024
Collective Mining | Corporate Presentation - May 2024Collective Mining | Corporate Presentation - May 2024
Collective Mining | Corporate Presentation - May 2024CollectiveMining1
 
Call Girls In Amritsar 💯Call Us 🔝 76967 34778🔝 💃 Independent Escort In Amritsar
Call Girls In Amritsar 💯Call Us 🔝 76967 34778🔝 💃 Independent Escort In AmritsarCall Girls In Amritsar 💯Call Us 🔝 76967 34778🔝 💃 Independent Escort In Amritsar
Call Girls In Amritsar 💯Call Us 🔝 76967 34778🔝 💃 Independent Escort In Amritsaronly4webmaster01
 
Diligence Checklist for Early Stage Startups
Diligence Checklist for Early Stage StartupsDiligence Checklist for Early Stage Startups
Diligence Checklist for Early Stage StartupsTILDEN
 
✂️ 👅 Independent Goregaon Escorts With Room Vashi Call Girls 💃 9004004663
✂️ 👅 Independent Goregaon Escorts With Room Vashi Call Girls 💃 9004004663✂️ 👅 Independent Goregaon Escorts With Room Vashi Call Girls 💃 9004004663
✂️ 👅 Independent Goregaon Escorts With Room Vashi Call Girls 💃 9004004663Call Girls Mumbai
 
Call Girls in Friends Colony 9711199171 Delhi Enjoy Call Girls With Our Escorts
Call Girls in Friends Colony 9711199171 Delhi Enjoy Call Girls With Our EscortsCall Girls in Friends Colony 9711199171 Delhi Enjoy Call Girls With Our Escorts
Call Girls in Friends Colony 9711199171 Delhi Enjoy Call Girls With Our Escortsindian call girls near you
 
Teck Investor Presentation, April 24, 2024
Teck Investor Presentation, April 24, 2024Teck Investor Presentation, April 24, 2024
Teck Investor Presentation, April 24, 2024TeckResourcesLtd
 
Vijayawada ( Call Girls ) Pune 6297143586 Hot Model With Sexy Bhabi Ready F...
Vijayawada ( Call Girls ) Pune  6297143586  Hot Model With Sexy Bhabi Ready F...Vijayawada ( Call Girls ) Pune  6297143586  Hot Model With Sexy Bhabi Ready F...
Vijayawada ( Call Girls ) Pune 6297143586 Hot Model With Sexy Bhabi Ready F...tanu pandey
 

Kürzlich hochgeladen (20)

VIP 7001035870 Find & Meet Hyderabad Call Girls Miyapur high-profile Call Girl
VIP 7001035870 Find & Meet Hyderabad Call Girls Miyapur high-profile Call GirlVIP 7001035870 Find & Meet Hyderabad Call Girls Miyapur high-profile Call Girl
VIP 7001035870 Find & Meet Hyderabad Call Girls Miyapur high-profile Call Girl
 
Rohini Sector 17 Call Girls Delhi 9999965857 @Sabina Saikh No Advance
Rohini Sector 17 Call Girls Delhi 9999965857 @Sabina Saikh No AdvanceRohini Sector 17 Call Girls Delhi 9999965857 @Sabina Saikh No Advance
Rohini Sector 17 Call Girls Delhi 9999965857 @Sabina Saikh No Advance
 
CALL ON ➥8923113531 🔝Call Girls Fazullaganj Lucknow best sexual service
CALL ON ➥8923113531 🔝Call Girls Fazullaganj Lucknow best sexual serviceCALL ON ➥8923113531 🔝Call Girls Fazullaganj Lucknow best sexual service
CALL ON ➥8923113531 🔝Call Girls Fazullaganj Lucknow best sexual service
 
Ambala Escorts Service ☎️ 6378878445 ( Sakshi Sinha ) High Profile Call Girls...
Ambala Escorts Service ☎️ 6378878445 ( Sakshi Sinha ) High Profile Call Girls...Ambala Escorts Service ☎️ 6378878445 ( Sakshi Sinha ) High Profile Call Girls...
Ambala Escorts Service ☎️ 6378878445 ( Sakshi Sinha ) High Profile Call Girls...
 
VVIP Pune Call Girls Sopan Baug WhatSapp Number 8005736733 With Elite Staff A...
VVIP Pune Call Girls Sopan Baug WhatSapp Number 8005736733 With Elite Staff A...VVIP Pune Call Girls Sopan Baug WhatSapp Number 8005736733 With Elite Staff A...
VVIP Pune Call Girls Sopan Baug WhatSapp Number 8005736733 With Elite Staff A...
 
Collective Mining | Corporate Presentation - May 2024
Collective Mining | Corporate Presentation - May 2024Collective Mining | Corporate Presentation - May 2024
Collective Mining | Corporate Presentation - May 2024
 
Q3 FY24 Earnings Conference Call Presentation
Q3 FY24 Earnings Conference Call PresentationQ3 FY24 Earnings Conference Call Presentation
Q3 FY24 Earnings Conference Call Presentation
 
SME IPO and sme ipo listing consultants .pptx
SME IPO and sme ipo listing consultants .pptxSME IPO and sme ipo listing consultants .pptx
SME IPO and sme ipo listing consultants .pptx
 
(‿ˠ‿) Independent Call Girls Laxmi Nagar 👉 9999965857 👈 Delhi : 9999 Cash Pa...
(‿ˠ‿) Independent Call Girls Laxmi Nagar 👉 9999965857 👈 Delhi  : 9999 Cash Pa...(‿ˠ‿) Independent Call Girls Laxmi Nagar 👉 9999965857 👈 Delhi  : 9999 Cash Pa...
(‿ˠ‿) Independent Call Girls Laxmi Nagar 👉 9999965857 👈 Delhi : 9999 Cash Pa...
 
slideshare Call girls Noida Escorts 9999965857 henakhan
slideshare Call girls Noida Escorts 9999965857 henakhanslideshare Call girls Noida Escorts 9999965857 henakhan
slideshare Call girls Noida Escorts 9999965857 henakhan
 
Pakistani Call girls in Ajman +971563133746 Ajman Call girls
Pakistani Call girls in Ajman +971563133746 Ajman Call girlsPakistani Call girls in Ajman +971563133746 Ajman Call girls
Pakistani Call girls in Ajman +971563133746 Ajman Call girls
 
Collective Mining | Corporate Presentation - May 2024
Collective Mining | Corporate Presentation - May 2024Collective Mining | Corporate Presentation - May 2024
Collective Mining | Corporate Presentation - May 2024
 
Vip Call Girls Vasant Kunj ➡️ Delhi ➡️ 9999965857 No Advance 24HRS Live
Vip Call Girls Vasant Kunj ➡️ Delhi ➡️ 9999965857 No Advance 24HRS LiveVip Call Girls Vasant Kunj ➡️ Delhi ➡️ 9999965857 No Advance 24HRS Live
Vip Call Girls Vasant Kunj ➡️ Delhi ➡️ 9999965857 No Advance 24HRS Live
 
Call Girls In Amritsar 💯Call Us 🔝 76967 34778🔝 💃 Independent Escort In Amritsar
Call Girls In Amritsar 💯Call Us 🔝 76967 34778🔝 💃 Independent Escort In AmritsarCall Girls In Amritsar 💯Call Us 🔝 76967 34778🔝 💃 Independent Escort In Amritsar
Call Girls In Amritsar 💯Call Us 🔝 76967 34778🔝 💃 Independent Escort In Amritsar
 
Diligence Checklist for Early Stage Startups
Diligence Checklist for Early Stage StartupsDiligence Checklist for Early Stage Startups
Diligence Checklist for Early Stage Startups
 
✂️ 👅 Independent Goregaon Escorts With Room Vashi Call Girls 💃 9004004663
✂️ 👅 Independent Goregaon Escorts With Room Vashi Call Girls 💃 9004004663✂️ 👅 Independent Goregaon Escorts With Room Vashi Call Girls 💃 9004004663
✂️ 👅 Independent Goregaon Escorts With Room Vashi Call Girls 💃 9004004663
 
Call Girls in Friends Colony 9711199171 Delhi Enjoy Call Girls With Our Escorts
Call Girls in Friends Colony 9711199171 Delhi Enjoy Call Girls With Our EscortsCall Girls in Friends Colony 9711199171 Delhi Enjoy Call Girls With Our Escorts
Call Girls in Friends Colony 9711199171 Delhi Enjoy Call Girls With Our Escorts
 
Teck Investor Presentation, April 24, 2024
Teck Investor Presentation, April 24, 2024Teck Investor Presentation, April 24, 2024
Teck Investor Presentation, April 24, 2024
 
Russian Call Girls Rohini Sector 3 💓 Delhi 9999965857 @Sabina Modi VVIP MODEL...
Russian Call Girls Rohini Sector 3 💓 Delhi 9999965857 @Sabina Modi VVIP MODEL...Russian Call Girls Rohini Sector 3 💓 Delhi 9999965857 @Sabina Modi VVIP MODEL...
Russian Call Girls Rohini Sector 3 💓 Delhi 9999965857 @Sabina Modi VVIP MODEL...
 
Vijayawada ( Call Girls ) Pune 6297143586 Hot Model With Sexy Bhabi Ready F...
Vijayawada ( Call Girls ) Pune  6297143586  Hot Model With Sexy Bhabi Ready F...Vijayawada ( Call Girls ) Pune  6297143586  Hot Model With Sexy Bhabi Ready F...
Vijayawada ( Call Girls ) Pune 6297143586 Hot Model With Sexy Bhabi Ready F...
 

British Geological Survey risk list2011

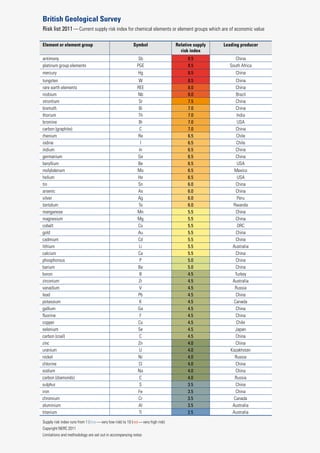
  • 1. British Geological Survey Risk list 2011 — Current supply risk index for chemical elements or element groups which are of economic value Element or element group Symbol Relative supply Leading producer risk index antimony Sb 8.5 China platinum group elements PGE 8.5 South Africa mercury Hg 8.5 China tungsten W 8.5 China rare earth elements REE 8.0 China niobium Nb 8.0 Brazil strontium Sr 7.5 China bismuth Bi 7.0 China thorium Th 7.0 India bromine Br 7.0 USA carbon (graphite) C 7.0 China rhenium Re 6.5 Chile iodine I 6.5 Chile indium In 6.5 China germanium Ge 6.5 China beryllium Be 6.5 USA molybdenum Mo 6.5 Mexico helium He 6.5 USA tin Sn 6.0 China arsenic As 6.0 China silver Ag 6.0 Peru tantalum Ta 6.0 Rwanda manganese Mn 5.5 China magnesium Mg 5.5 China cobalt Co 5.5 DRC gold Au 5.5 China cadmium Cd 5.5 China lithium Li 5.5 Australia calcium Ca 5.5 China phosphorous P 5.0 China barium Ba 5.0 China boron B 4.5 Turkey zirconium Zr 4.5 Australia vanadium V 4.5 Russia lead Pb 4.5 China potassium K 4.5 Canada gallium Ga 4.5 China fluorine F 4.5 China copper Cu 4.5 Chile selenium Se 4.5 Japan carbon (coal) C 4.5 China zinc Zn 4.0 China uranium U 4.0 Kazakhstan nickel Ni 4.0 Russia chlorine Cl 4.0 China sodium Na 4.0 China carbon (diamonds) C 4.0 Russia sulphur S 3.5 China iron Fe 3.5 China chromium Cr 3.5 Canada aluminium Al 3.5 Australia titanium Ti 2.5 Australia Supply risk index runs from 1 (blue — very low risk) to 10 (red — very high risk) Copyright NERC 2011 Limitations and methodology are set out in accompanying notes
  • 2. Risk List 2011 British Geological Survey A new supply risk index for chemical elements or element groups which are of economic value The risk list gives a quick and simple indication of the relative risk in 2011 to the supply of the 52 chemical elements or element groups which we need to maintain our economy and lifestyle. The position of an element on this list is determined by a number of factors which might impact on supply. These include the abundance of elements in the Earth’s crust, the location of current production and reserves, and the political stability of those locations. Data sources used in the compilation of the list are internationally recognised and publicly available. The risk list highlights a group of elements where global production is concentrated in a very few countries. The restricted supply base and the relatively low political stability ratings for some major producing countries combine to significantly increase risk to supply. Restriction on the availability of rare earth elements has received a good deal of attention recently and this group features close to the top of the list. However, the list highlights other economically important metals with similar high levels of risk to supply disruption including platinum group metals (active component in auto- catalysts), niobium (used in MRI scanners and touch screens) and tungsten (key hard metal used in almost all cutting tools). The list also shows the current importance of China in production of many metals and minerals. China is now the leading global producer of 27 of the 52 elements and element groups on the list (and as shown in Figure 1). As demand for metals and minerals increases, driven by relentless growth in the emerging economies in Asia and South America, competition for resources is growing. The risk list gives an indication which elements might be subject to supply disruption, most likely from human factors such as geopolitics (‘haves’ seeking to influence ‘have nots’) or resource nationalism (state control of production), along with events such as strikes and accidents. Policy-makers, industry and consumers should be concerned about supply risk and the need to diversify supply from Earth resources, from recycling more and doing more with less, and also about the environmental implications of burgeoning consumption. The list focuses on risks to supply and does not include any assessment of factors that influence demand, such as criticality of an element to a particular technology or how easy it is to substitute that element with another. A more in-depth discussion of the risk list methodology and limitations can be found below. www.mineralsuk.com
  • 3. Risk List 2011 British Geological Survey South Africa, Kazakhstan, 1 1 Where in the world do Mexico, 1 Rwanda, 1 the elements we need Japan, 1 Peru, 1 Turkey, 1 come from? India, 1 DRC, 1 Brazil, 1 Canada, USA, 3 China, 27 Chile, 3 Russia, 3 Australia, 4 Figure 1. Chart indicates the number of times a country is the leading global producer of an element or element group of economic value. Source: BGS World Mineral Statistics Methodology for estimating the relative risk to supply of the chemical elements The following methodology was used to define the relative risk to supply of the following elements: Ag; Al; As; Au; B; Ba; Be; Bi; Br; C (coal, diamond and graphite); Ca; Cd; Cl; Co; Cr; Cu; F; Fe; Ga; Ge; He; Hg; I; In; K; Li; Mg; Mn; Mo; Na; Nb; Ni; P; Pb; PGE (Ru, Pd, Os, Ir and Pt) ; Re; REE (La, Ce, Pr, Nd, Sm, Eu, Gd, Tb, Dy, Ho, Er, Tm, Yb and Lu); S; Sb; Se; Sn; Sr; Ta; Th; Ti; U; V; W; Zn; and Zr. Elements not included are those for which insufficient data exist. An Excel spreadsheet was used to rank the above elements in terms of the relative risk to supply. The ranking system was based on four criteria scored between 1 and 5.  Scarcity  Production concentration  Reserve base distribution  Governance A score of 1 indicates that a particular criterion has a low contribution to supply risk, while a score of 5 indicates a high risk. The scores for each criterion were summed to give an overall risk to supply, the larger the score the greater the potential risk to supply. Each criterion was given equal weight. The elements were ranked according to their score and a gradational colour scale applied such that increased risk is indicated by hotter colours. www.mineralsuk.com
  • 4. Risk List 2011 British Geological Survey Scarcity Crustal abundances (Table 1) provide an indication of the scarcity of a given element on a global scale. For example, gold would be classified as high-risk due to its low crustal abundance of 0.0013 ppm, while iron would classified as low-risk with a crustal abundance of about 52,157 ppm. The scores were allocated as follows: 1 (low) >100 to 1000 ppm 2 (medium to low) >10 to 100 ppm 3 (medium) >1 to 10 ppm 4 (medium to high) >0.1 to 1 ppm 5 (high) <0.1 ppm Where data are unavailable an arbitrary score of 2 was allocated. For example, He is allocated a score of 2 since crustal abundance data is unavailable. Element Abundance (ppm) Element Abundance (ppm) Ag 0.055 Mn 774 Al 84,149 Mo 0.8 As 2.5 Na 22,774 Au 0.0013 Nb 8 B 11 Nd 20 Ba 456 Ni 26.6 Be 1.9 Os 0.000041 Bi 0.18 P 567 Br 0.88 Pb 11 Cd 0.08 Pd 0.0015 Ce 43 Pr 4.9 Co 26.6 Pt 0.0015 Cr 135 Re 0.000188 Cu 27 Ru 0.00057 Dy 3.6 S 404 Er 2.1 Sb 0.2 Eu 1.1 Se 0.13 F 553 Sm 3.9 Fe 52,157 Sn 1.7 Ga 16 Sr 320 Gd 3.7 Ta 0.7 Ge 1.3 Tb 0.6 Hg 0.03 Th 5.6 Ho 0.77 Ti 4136 I 0.71 Tm 0.28 In 0.052 U 1.3 Ir 0.000037 V 138 K 15 025 W 1 La 20 Yb 1.9 Li 16 Zn 72 Lu 0.3 Zr 132 Mg 28 104 Table 1. Average total crustal abundance of the elements included in this study. Data from Rudnick and Gao (2003). www.mineralsuk.com
  • 5. Risk List 2011 British Geological Survey Production concentration Where the production of a given commodity is concentrated in a few countries this can increase the risk to supply. For example, about 83 per cent of the world’s tungsten is currently sourced from China. The BGS’ World Mineral Production data (2005-2009) were used to identify the top three producing countries and the percentage of world supply for which the leading country is responsible. The percentage production for the top three countries was scored as follows: 1 (low) 0 to 30 % 2 (medium-low) >30 to 45 % 3 (medium) >45 to 60 % 4 (medium-high) >60 to 75 % 5 (high) >75 % Reserve base distribution It is important to assess where elements might be sourced in the future. However, for many elements the global distribution of resources is poorly known, while reserves1 are often localised. Accordingly we have used reserve base2 distribution data from the USGS to provide an indication of future sources of supplies. Where the reserve base of a given commodity is concentrated in a few countries this leads to increased risk to future supplies. For example, nearly 87 per cent of the world’s reserve base of niobium is found in Brazil. The USGS’ Commodity Summaries (2009) reserve base data were used to identify the three countries contributing the largest share to the global reserve base and the percentage of the world reserve base held by the top country. The percentage of the global reserve base held by the top three countries was scored as follows: 1 (low) 0 to 30 % 2 (medium-low) >30 to 45 % 3 (medium) >45 to 60 % 4 (medium-high) >60 to 75 % 5 (high) >75 % Where data are unavailable an arbitrary score of 2 was allocated. For example, Be, As, Na, S, In, Cl, Ca and Ge are allocated a score of 2 since reserve base information is unavailable. Reserve base data are also unavailable for coal; however, reserve data for 2008 are available from the Energy Information Administration (EIA). www.mineralsuk.com
  • 6. Risk List 2011 British Geological Survey Governance indicators The political stability of a producing country may impact upon the supply of mineral commodities e.g. supplies may be interrupted by war, government intervention, famine or other forms of unrest. A combined overall political stability score was calculated, using World Bank (WB) governance indicators, for the leading three producing countries. The World Bank website provides percentile rank information for 213 countries on six different criteria: voice and accountability; political stability; government effectiveness; regulatory equality; rule of law; and control of corruption. Only political stability was considered as part of this study. Countries with a political stability percentile of <33.3 per cent were scored 3, those with a percentile between >33.3 and 66.6 per cent were scored 2 and those with a percentile of >66.6 per cent were scored 1. A combined overall political stability value was calculated by summing the individual political stability scores for the three leading global producers for each element and scored as follows: 1 (low) 0 to 2 2 (medium-low) 3 to 4 3 (medium) 5 to 6 4 (medium-high) 7 to 8 5 (high) 9 For example, the three leading producing countries for REE are China, Brazil and Russia. Their combined political stability factor would be calculated thus: China (WB percentile rank is 29.7 = 3), Brazil (WB percentile rank is 54.2 = 2), and Russia (WB percentile rank is 21.7 = 3), as shown in Figure 2. Combining these scores gives a combined political stability factor of 8 which equates to an overall score of 4 (medium-high risk). Figure 2. Political stability indicators for Brazil, China and Russia. Data from the World Bank after Kaufmann et al. (2010). www.mineralsuk.com
  • 7. Risk List 2011 British Geological Survey Supply risk An integrated supply risk was calculated by combining the scores for each of the four criteria. This is illustrated for two elements, iron and niobium, in Table 2. Category Iron Score Niobium Score Value Score Value Score Crustal abundance (ppm) 56,300 1 8 3 Reserve base distribution (%) 21.4 1 86.7 5 Production concentration (%) 39.1 2 95.8 5 Political Stability 6 3 6 3 Total 7 16 Supply Risk Index (Total/ 2) 3.5 8 Table 2. The calculation of a supply risk index. Aggregate scores were divided by 2 to produce a simple supply risk index from 1 (very low risk) to 10 (very high risk). For example, iron has an initial aggregate score of 7. This is divided by 2 to give a score of 3.5. This shows that iron has a lower relative risk to supply compared to niobium with a score of 8. Limitations to the methodology Previous studies of this nature have included information pertaining to the environment, supply and demand, TMR (total material requirements), climate change, and substitution and recycling. This study omits many of these factors. For instance, we have not taken into account the potential impact of supply disruptions e.g. Hg is little used therefore the impact would be less than for an interrupted supply of PGE. IMPORTANTLY - this represents a ‘snapshot’ in time and does not take in to account future issues and supply-demand scenarios. The minerals market is not static, new reserves are continually added in response to drivers such as demand and advances in technology. Also recycling is likely to contribute an increasing share to the global market in the future. Crustal abundance values do not take into account crustal dispersion, nor do they account for the tendency of an element to become economically concentrated. Where more than one mineral source exists for a given element e.g. Ti occurring in rutile, leucoxene and ilmenite, all sources have been combined to give a total. Where appropriate, groups of elements have been combined and dealt with a single commodity e.g. PGE and REE. For these grouped elements a worst case scenario has been taken in terms of the crustal abundance e.g. Lu at 0.3 ppm has been used to calculate the crustal abundance risk for REE rather than Ce at 43 ppm. Likewise, Ir 0.000037 ppm has been used to calculate the crustal abundance risk for PGE rather than Pd at 0.0015 ppm. www.mineralsuk.com
  • 8. Risk List 2011 British Geological Survey Certain commodities have been used as a proxy for a given element; this approach may mean that not all sources of an element have been included in the production and reserve base calculations (Table 3). Element Proxy Sodium Halite - NaCl (+ sea salt and brine) Calcium Lime - CaO Fluorine Fluorspar - CaF2 Carbon Coal, diamonds, and graphite Barium Barytes - BaSO4 Beryllium Beryl - Be3Al2(SiO3)6 Boron Borate Potassium Potash - K2O content Titanium Rutile and Ilmenite - TiO2 and FeTiO3 Magnesium Magnesite - MgCO3 REE Rare Earth Oxides (REO) Table 3 - Element proxies used in production and reserve base calculations. Mineral resources3 have been omitted from this study since resources are not measured and the global distribution is poorly defined. Elements that have little or no commercial use have been omitted from this study e.g. Po, At, and Ra. Likewise, synthetic or ‘manufactured’ elements have also been omitted e.g. elements of atomic number 95 to 114, and H. Elements naturally occurring in a gaseous state are also not included e.g. the Noble gases, O and N because the criteria used are unsuitable for assessing the supply risk of these elements. Production and reserve base information for some of the minor metals e.g. Sc, Y, Cs, Te, Tl, and Rb is unavailable because they are commonly produced as by-products or as co-metals. For example, Y is often associated with REE-bearing minerals; Sc is found in trace amounts in minerals such as beryl, garnet and wolframite; Cs is often a by-product of Li extraction; and Te, along with Se, is a common by-product of nickel and copper ore extraction. Definitions 1. Reserves - a ‘mineral reserve’ is the part of the resource which has been fully geologically evaluated and is commercially and legally mineable. Reserves may be regarded as ‘working inventories’, which are continually revised in the light of various ‘modifying factors’ related to mining, metallurgy, economics, marketing, law, the environment, communities, government, etc, etc (USGS, 2010). 2. Reserve Base - the ‘reserve base’ includes the ‘mineral reserve’ plus those parts of the resources that have a reasonable potential for becoming economically available within planning horizons beyond those that assume proven technology and current economics. It has been a widely utilised concept. However, publication of reserve base estimates was discontinued in 2010 (USGS, 2010). www.mineralsuk.com
  • 9. Risk List 2011 British Geological Survey 3. Resources - a ‘mineral resource’ regroups all identified resources. It is a natural concentration of minerals or a body of rock that is, or may become, of potential economic interest as a basis for the extraction of a mineral commodity. A resource has physical and/ or chemical properties that make it suitable for specific uses and it is present in sufficient quantity to be of intrinsic economic interest. It encompasses ‘mineral reserve’ and ‘reserve base’ plus other identified resources which could be exploited in the future if required according to the economic situation (USGS, 2010). Figure 3 - Graphical representation of the relationship between reserves, the reserve base and resources. References British Geological Survey (2011) World mineral production 2005-2009. Available: http://www.bgs.ac.uk/downloads/start.cfm?id=1987 Kaufmann, D., Kraay, A. and Mastruzzi, M. (2010) The Worldwide Governance Indicators: Methodology and Analytical Issues. World Bank Policy Research Working Paper No. 5430. Available: http://info.worldbank.org [accessed July 2011). Rudnick, R.L. and Gao, S. (2003). Composition of the Continental Crust. In The Crust (ed. Rudnick R.L.) volume 3, pages 1-64 of Treatise on Geochemistry (eds. Holland, H.D. and Turekian K.K.), Elsevier-Pergamon, Oxford. United States Geological Survey. (2009). Mineral Commodity Summaries [online]. Available: www.usgs.gov [accessed July 2011). www.mineralsuk.com