1. Pedestrians
Project co-financed by the European Commission, Directorate-General Energy and Transport 1 / 12
Issued: Feb / 08
Motorcycles&
Mopeds
ChildrenYoungPeople
HeavyGoods
Vehicles
CarOccupantsBicyclesMotorwaysJunctionsUrbanAreasMainFiguresTheElderlyPedestrians
Traffic Safety Basic Facts 2007
Pedestrians
In 20051
, 3.683 pedestrians were killed in road traffic accidents in
the EU-142
(EU-15 without Germany). This is 14,1% of all fatalities
in 2005. In the last decade, pedestrian fatalities have reduced by
36,8%, while the total number of fatalities has reduced by one
quarter (25,3%). Road safety measures implemented in the last 10
years may thus have considerably improved pedestrian fatality
numbers.
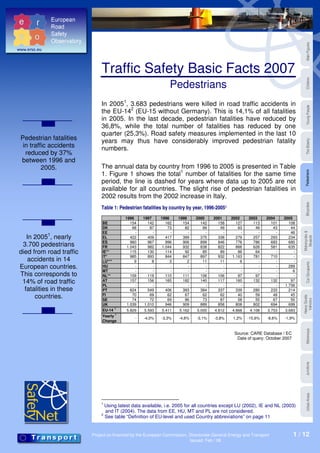
The annual data by country from 1996 to 2005 is presented in Table
1. Figure 1 shows the total1
number of fatalities for the same time
period, the line is dashed for years where data up to 2005 are not
available for all countries. The slight rise of pedestrian fatalities in
2002 results from the 2002 increase in Italy.
Table 1: Pedestrian fatalities by country by year, 1996-20051
1996 1997 1998 1999 2000 2001 2002 2003 2004 2005
BE 154 142 162 154 142 158 127 113 101 108
DK 68 87 73 82 99 49 63 49 43 44
EE - - - - - - - - - 46
EL 422 409 417 399 375 338 279 257 293 234
ES 960 967 996 906 899 846 776 786 683 680
FR 1.043 982 1.044 932 838 822 866 626 581 635
IE** 115 130 114 92 85 89 86 64 - -
IT* 985 893 844 847 897 932 1.163 781 710 -
LU*** 9 8 3 2 11 11 6 - - -
HU - - - - - - - - - 289
MT - - - - - - - - - 6
NL** 109 119 110 111 106 106 97 97 - -
AT 157 156 165 182 140 117 160 132 132 97
PL - - - - - - - - - 1.756
PT 624 549 406 393 384 337 339 280 233 214
FI 70 69 62 67 62 62 40 59 49 45
SE 74 72 69 86 73 87 58 55 67 50
UK 1.039 1.010 946 909 889 858 808 802 694 699
EU-14
1
5.829 5.593 5.411 5.162 5.000 4.812 4.868 4.108 3.753 3.683
Yearly
1
Change
- -4,0% -3,3% -4,6% -3,1% -3,8% 1,2% -15,6% -8,6% -1,9%
Source: CARE Database / EC
Date of query: October 2007
1
Using latest data available, i.e. 2005 for all countries except LU (2002), IE and NL (2003)
and IT (2004). The data from EE, HU, MT and PL are not considered.
2
See table “Definition of EU-level and used Country abbreviations” on page 11
Pedestrian fatalities
in traffic accidents
reduced by 37%
between 1996 and
2005.
In 20051
, nearly
3.700 pedestrians
died from road traffic
accidents in 14
European countries.
This corresponds to
14% of road traffic
fatalities in these
countries.
2. Pedestrians
Project co-financed by the European Commission, Directorate-General Energy and Transport 2 / 12
Motorcycles&
Mopeds
ChildrenYoungPeople
HeavyGoods
Vehicles
CarOccupantsBicyclesMotorwaysJunctionsUrbanAreasMainFiguresTheElderlyPedestrians
Figure 1: Number of pedestrian fatalities and proportion on total fatalities in EU-14, 1996-
20051
16,7%
16,1%
15,7%
15,1% 14,9% 14,6%
15,3%
14,0% 13,9% 14,1%
0%
2%
4%
6%
8%
10%
12%
14%
16%
18%
1996 1997 1998 1999 2000 2001 2002 2003¹ 2004¹ 2005¹
Pedestrianfatalities/totalfatalities
-
1.000
2.000
3.000
4.000
5.000
6.000
7.000
Pedestrianfatalities
Share on total fatalities Pedestrian fatalities
Source: CARE Database / EC
Date of query: October 2007
To compare the pedestrian fatality numbers of different countries
the respective population size has been taken into account (see
Table 2). The rate varies from 5,5 pedestrian fatalities per million
inhabitants in Sweden to 46,0 pedestrian fatalities by million
inhabitants in Poland, a rate which is more than 8 times higher.
Table 2: Pedestrian fatalities per million inhabitants by country, 2005
Pedestrian
fatalities
Population
[million]
Pedestrian fatalities per
million inhabitants
BE 108 10,4 10,4
DK 44 5,4 8,1
EE 46 1,3 34,2
EL 234 11,1 21,1
ES 680 43,4 15,7
FR 635 62,7 10,1
IE** 64 4,1 15,7
IT* 710 58,2 12,2
LU*** 6,00 0,5 13,2
HU 289 10,1 28,7
MT 6 0,4 14,9
NL** 97 16,3 6,0
AT 97 8,2 11,8
PL 1.756 38,2 46,0
PT 214 10,5 20,3
FI 45 5,2 8,6
SE 50 9,0 5,5
UK 699 60,2 11,6
EU-18 5.780 355,3 16,3
* Data from 2004 Source: CARE Database / EC
** Data from 2003 Date of query: October 2007
*** Data from 2002 Source of population data: EUROSTAT
The proportion of
fatalities who were
pedestrians fell
slightly between
1996 and 2005.
The rate of
pedestrian fatalities
per million
population is highest
in Poland and
Estonia.
3. Pedestrians
Project co-financed by the European Commission, Directorate-General Energy and Transport 3 / 12
Motorcycles&
Mopeds
ChildrenYoungPeople
HeavyGoods
Vehicles
CarOccupantsBicyclesMotorwaysJunctionsUrbanAreasMainFiguresTheElderlyPedestrians
Figure 2: Pedestrian fatalities per million inhabitants by country, 2005
46,0
34,2
28,7
21,1
12,2 11,8 11,6
10,3 10,1
8,6 8,1
6,0 5,5
14,9
13,2
15,7
20,3
15,7
0,0
5,0
10,0
15,0
20,0
25,0
30,0
35,0
40,0
45,0
50,0
PL EE HU EL PT ES IE** MT LU*** IT* AT UK BE FR FI DK NL** SE
Pedestrianfatalitiesbymillioninhabitants
EU-18 average = 16,3
* Data from 2004 Source: CARE Database / EC
** Data from 2003 Date of query: October 2007
*** Data from 2002 Source of population data: EUROSTAT
The proportion of pedestrian fatalities in the total number of road
traffic fatalities in each country is shown in Table 3. The proportion
is lowest in The Netherlands, Belgium and Sweden, compared to
35,3% in Malta, 32,3% in Poland, and 27,2% in Estonia (see Figure
3). The EU-18 average is 17,5%.
Table 3: Pedestrian fatalities as a percentage of total fatalities, 2005
Pedestrian fatalities Total fatalities Ratio
BE 108 1.089 9,9%
DK 44 331 13,3%
EE 46 169 27,2%
EL 234 1.658 14,1%
ES 680 4.442 15,3%
FR 635 5.318 11,9%
IE** 64 337 19,0%
IT* 710 5.625 12,6%
LU*** 6 62 9,7%
HU 289 1.278 22,6%
MT 6 17 35,3%
NL** 97 1.028 9,4%
AT 97 768 12,6%
PL 1.756 5.444 32,3%
PT 214 1.247 17,2%
FI 45 379 11,9%
SE 50 440 11,4%
UK 699 3.336 21,0%
EU-18 5.780 32.968 17,5%
* Data from 2004 Source: CARE Database / EC
** Data from 2003 Date of query: October 2007
*** Data from 2002
The proportion of
fatalities who were
pedestrians is
lowest in Belgium
and The
Netherlands.
4. Pedestrians
Project co-financed by the European Commission, Directorate-General Energy and Transport 4 / 12
Motorcycles&
Mopeds
ChildrenYoungPeople
HeavyGoods
Vehicles
CarOccupantsBicyclesMotorwaysJunctionsUrbanAreasMainFiguresTheElderlyPedestrians
Figure 3: Pedestrian fatalities as a percentage of total fatalities, 2005
35,3%
32,3%
27,2%
22,6%
13,3% 12,6% 12,6%
11,9% 11,9% 11,4%
9,9% 9,7% 9,4%
19,0%
21,0%
17,2%
14,1%
15,3%
0%
5%
10%
15%
20%
25%
30%
35%
40%
MT PL EE HU UK IE** PT ES EL DK AT IT* FR FI SE BE LU*** NL**
Pedestrianfatalities/totalfatalities
EU-18 average = 17,5%
* Data from 2004 Source: CARE Database / EC
** Data from 2003 Date of query: October 2007
*** Data from 2002
Age and gender
The elderly are still the largest group in pedestrian fatalities. The
very high number of the elderly (aged >64) pedestrian fatalities
decreased in the last 10 years from 2.476 to 1.450 people (-41,4%),
while all pedestrian fatalities were reduced by 36,8% in the same
time period. The elderly are still the largest group in pedestrian
fatalities. The change in pedestrian fatalities from 1996 to 20051
by
age groups is presented in Figure 4.
Figure 4: EU-14 evolution of pedestrian fatalities by age group, 1996-20051
125
180 181
245
218
246
218
234 225
254
238
291
413
458
585
543 533
357
166
73 61
87
144
175
151 163 150
178 193 192 186 179
234
334
400 399
83 78
0
100
200
300
400
500
600
0-4
5-9
10-14
15-19
20-24
25-29
30-34
35-39
40-44
45-49
50-54
55-59
60-64
65-69
70-74
75-79
80-84
85+
unknown
Age group
Pedestrian fatalities 1996 EU-14 Pedestrian fatalities 2005¹EU-14
Source: CARE Database / EC
Date of query: October 2007
In Malta and Poland
about one in three
road accident
fatalities is a
pedestrian.
The pedestrian
fatality rate peaks
about the age of 75.
5. Pedestrians
Project co-financed by the European Commission, Directorate-General Energy and Transport 5 / 12
Motorcycles&
Mopeds
ChildrenYoungPeople
HeavyGoods
Vehicles
CarOccupantsBicyclesMotorwaysJunctionsUrbanAreasMainFiguresTheElderlyPedestrians
The proportion of fatalities who are pedestrians is high for children
as well as the elderly (see Figure 5). A reason for this could be the
lower level of motorization in these age groups. Table 4, Figure 5,
and Figure 6 show that the elderly are a very important group when
dealing with pedestrian road safety.
Figure 5: Pedestrian fatalities as a percentage of total fatalities by age group in EU-18, 20053
34% 35%
28%
8% 7% 7%
9%
10%
14%
19%
21% 20%
25%
28%
33%
39%
44%
54%
0%
10%
20%
30%
40%
50%
60%
0-4
5-9
10-14
15-19
20-24
25-29
30-34
35-39
40-44
45-49
50-54
55-59
60-64
65-69
70-74
75-79
80-84
85+
Age group
Source: CARE Database / EC
Date of query: October 2007
Although children have a high proportion on pedestrian fatalities,
they have a lower fatality rate as the average population (16,3
pedestrian fatalities by million inhabitants). The pedestrian fatality
rate of the elderly is much higher than the average, increasing up
from the age of 70 (see Figure 6). For total numbers of child and
senior pedestrian fatalities see Table 4.
3
Using last data available, i.e. 2005 for all countries except LU (2002), IE and NL (2003)
and IT (2004).
The proportion of
fatalities who are
pedestrians is
higher for children
and the elderly than
for other age groups
6. Pedestrians
Project co-financed by the European Commission, Directorate-General Energy and Transport 6 / 12
Motorcycles&
Mopeds
ChildrenYoungPeople
HeavyGoods
Vehicles
CarOccupantsBicyclesMotorwaysJunctionsUrbanAreasMainFiguresTheElderlyPedestrians
Table 4: Child (age 0-15) and elderly (age >64) pedestrian fatalities, 2005
Child pedestrian
fatalities (age 0-15)
Elderly pedestrian
fatalities (age >64)
Total pedestrian
fatalities
BE 9 54 108
DK 3 18 44
EE 4 10 46
EL 11 126 234
ES 29 285 680
FR 40 325 635
IE** 8 22 64
IT* 23 381 710
LU*** 1 3 6
HU 9 90 289
MT 2 2 6
NL** 17 39 97
AT 11 43 97
PL 78 512 1.756
PT 10 87 214
FI 7 20 45
SE 3 22 50
UK 69 250 699
EU-18 334 2.288 5.780
* Data from 2004 Source: CARE Database / EC
** Data from 2003 Date of query: October 2007
*** Data from 2002
Figure 6: Pedestrian fatalities per million inhabitants by age group, 20053 EU-18
4,4 4,9 6,1
10,0
16,1
17,8
15,4
18,0
22,0
33,0
46,0
56,8
60,9
9,0
12,7
9,8
11,6
9,2
0
10
20
30
40
50
60
70
0-4
5-9
10-14
15-19
20-24
25-29
30-34
35-39
40-44
45-49
50-54
55-59
60-64
65-69
70-74
75-79
80-84
85+
Age group
Pedestrianfatalitiespermillioninhabitantsperagegroup
Source: CARE Database / EC
Date of query: October 2007
Source of population data: EUROSTAT
Pedestrian fatalities of elderly people as a percentage of total
pedestrian fatalities vary between countries (see Figure 7). In
Greece, Italy, and France more than half of all pedestrian fatalities
are the elderly, while elderly people account only for about one third
of fatalities in the United Kingdom, Ireland and the new member
states Malta, Poland and Hungary. Estonia has the lowest rate with
only 21,7% senior pedestrian fatalities to total pedestrian fatalities.
The European average lies at 39,6%.
The fatality rate of
pedestrians at least
80 years old is ten
times the rate for
children
7. Pedestrians
Project co-financed by the European Commission, Directorate-General Energy and Transport 7 / 12
Motorcycles&
Mopeds
ChildrenYoungPeople
HeavyGoods
Vehicles
CarOccupantsBicyclesMotorwaysJunctionsUrbanAreasMainFiguresTheElderlyPedestrians
Figure 7: Senior pedestrian fatalities (age >64) as a percentage of total pedestrian fatalities,
2005
53,8% 53,7%
51,2%
40,9% 40,4% 40,2%
34,4% 33,3%
31,1%
29,2%
21,7%
35,8%
50,0%
44,4%
50,0%
44,3%
41,9%
44,0%
0%
10%
20%
30%
40%
50%
60%
EL IT* FR BE LU*** FI AT SE ES DK PT NL** UK IE** MT HU PL EE
Seniorpedestrianfatalities/totalpedestrianfatalities
EU-18 average = 39,6%
* Data from 2004 Source: CARE Database / EC
** Data from 2003 Date of query: October 2007
*** Data from 2002
The proportion of pedestrian fatalities who are children varies
widely among the EU-18 countries. 18% of pedestrian fatalities in
the Netherlands are children, compared with 3% of Italy and
Hungary (see Figure 8)
Figure 8: Child pedestrian fatalities (age 0-15) as a percentage of total pedestrian fatalities,
2005
17,5%
16,7%
15,6%
6,8% 6,3% 6,0%
3,1%3,2%
4,3%4,4%
4,7%4,8%
33,3%
8,7% 8,3%
9,9%
12,5%
11,3%
0%
5%
10%
15%
20%
25%
30%
35%
MT NL** LU*** FI IE** AT UK EE BE DK FR SE PT EL PL ES IT* HU
Childpedestrianfatalities/totalpedestrianfatalities
EU-18 average = 5,8%
* Data from 2003 Source: CARE Database / EC
** Data from 2002 Date of query: October 2007
*** Data from 2002
The different gender patterns of the mode of transport are reflected
in the high proportion of female pedestrian fatalities, which is more
than one third for pedestrian fatalities, while only being less than
one quarter of all fatalities (see Figure 9). Figure 10 shows the
details of gender distribution of pedestrian fatalities in the different
Member States.
In Greece, Italy and
France more than
half of all pedestrian
fatalities are the
elderly.
The proportion of
pedestrian fatalities
who are children
varies widely among
the EU-18 countries.
8. Pedestrians
Project co-financed by the European Commission, Directorate-General Energy and Transport 8 / 12
Motorcycles&
Mopeds
ChildrenYoungPeople
HeavyGoods
Vehicles
CarOccupantsBicyclesMotorwaysJunctionsUrbanAreasMainFiguresTheElderlyPedestrians
Figure 9: Share of gender for pedestrians and for total fatalities in EU-18, 20053
Pedestrian fatalities by gender
female; 34%
male; 66%
Source: CARE Database / EC
Date of query: October 2007
Figure 10: Pedestrian fatalities by gender by country, 2005
60%
68% 72%
59%
64%
58%
65%
69% 67% 67%
33%
59% 57%
71% 71%
64% 62% 63% 66%
40%
32% 28%
41%
36%
42%
35%
31% 33% 33%
67%
41% 43%
29% 29%
36% 38% 37% 34%
0%
10%
20%
30%
40%
50%
60%
70%
80%
90%
100%
BE DK EE EL ES FR IE** IT* LU*** HU MT NL** AT PL PT FI SE UK EU-18
male female
* Data from 2004 Source: CARE Database / EC
** Data from 2003 Date of query: October 2007
*** Data from 2002
Light conditions
The distribution of fatalities by light conditions (see Table 5) shows
that pedestrians are in most danger during darkness with an
average of 45,5%. This varies between the respective countries,
from 85% in Estonia to 35% in The Netherlands, as presented in
Figure 11. Luxemburg and Italy are excluded due to a high
proportion of fatalities with unknown light conditions.
The proportion of
pedestrian fatalities
who are female is
higher than the
overall proportion.
In every country,
except Malta, are
more male than
female fatalities.
Total fatalities by gender
female; 23%
male; 77%
9. Pedestrians
Project co-financed by the European Commission, Directorate-General Energy and Transport 9 / 12
Motorcycles&
Mopeds
ChildrenYoungPeople
HeavyGoods
Vehicles
CarOccupantsBicyclesMotorwaysJunctionsUrbanAreasMainFiguresTheElderlyPedestrians
Table 5: Pedestrian fatalities by light conditions by country, 2005
Darkness Daylight Daylight
or twilight
Twilight Unknown Total
BE 55 47 - 6 - 108
DK 20 17 - 6 1 44
EE 39 7 - - - 46
EL 97 115 - 22 - 234
ES 327 321 - 31 - 680
FR 253 344 - 38 - 635
IE** 36 - 28 - - 64
IT* - - - - 710 710
LU*** 1 - - - 5 6
HU 169 108 - 12 - 289
MT 4 2 - - - 6
NL** 34 57 - 6 - 97
AT 57 36 - 4 - 97
PL 1.038 541 - 177 - 1.756
PT 108 93 - 13 - 214
FI 23 22 - - - 45
SE 22 26 - 1 1 50
UK 348 10 334 - 7 699
EU-18 2.631 1.747 362 316 724 5.780
Share 45,5% 30,2% 6,3% 5,5% 12,5% 100,0%
* Data from 2004 Source: CARE Database / EC
** Data from 2003 Date of query: October 2007
*** Data from 2002
Figure 11: Pedestrian fatalities during darkness as a proportion of all pedestrian fatalities by
country 2005 (excluding Italy and Luxembourg)
85%
67%
50%
48%
40%
35%
59% 59%
41%
51% 51%51%
58% 56%
47% 45%
0%
10%
20%
30%
40%
50%
60%
70%
80%
90%
EE MT PL AT HU IE** FI BE PT UK ES DK SE EL FR NL** IT* LU***
Shareofpedestrianfatalitiesduringdarkness
(lightconditionknown)
EU-18 average = 52,7%
* Data from 2004 Source: CARE Database / EC
** Data from 2003 Date of query: October 2007
*** Data from 2002
Seasonality
Table 6 shows the proportion of pedestrian fatalities in each quarter
of 20051
. Generally pedestrian fatalities are most frequent from
October to December and least frequent from April to June. The
proportion of the months October to December is especially high in
northern countries like Finland Sweden. Only The Netherlands have
less than a fifth of their pedestrian fatalities occurring between
October and December.
Nearly half of all
pedestrian fatalities
(45%) die in
darkness.
10. Pedestrians
Project co-financed by the European Commission, Directorate-General Energy and Transport 10 / 12
Motorcycles&
Mopeds
ChildrenYoungPeople
HeavyGoods
Vehicles
CarOccupantsBicyclesMotorwaysJunctionsUrbanAreasMainFiguresTheElderlyPedestrians
Table 6: Pedestrian fatalities by quarter of year by country, 2005
January -
March
April -
June
July -
September
October -
December
Total
BE 38 20 22 28 108
DK 14 10 8 12 44
EE 12 6 7 21 46
EL 60 53 49 72 234
ES 192 154 157 177 680
FR 162 125 149 199 635
IE** 20 15 9 20 64
IT* 178 145 152 235 710
LU*** - 1 1 4 6
HU 77 53 65 94 289
MT 2 1 3 - 6
NL** 32 22 26 17 97
AT 23 22 23 29 97
PL 430 296 430 600 1.756
PT 55 51 44 64 214
FI 16 5 7 17 45
SE 17 8 6 19 50
UK 184 166 138 211 699
EU-18 1.512 1.154 1.296 1.819 5.780
Share 26,2% 20,0% 22,4% 31,5% 100,0%
* Data from 2004 Source: CARE Database / EC
** Data from 2003 Date of query: October 2007
*** Data from 2002
Pedestrian fatalities show large differences in their seasonality
compared to total fatalities (see Figure 12). They increase in
autumn and decrease in spring with highest fatality numbers from
November to January, while the peak season for total fatalities is in
summer. The increased pedestrian fatalities during the winter
compared to other seasons, are probably caused by the higher
danger for pedestrians in darkness. The time of darkness/twilight is
longer than in other seasons and compared to vehicles that use
lights, pedestrians are much less visible. The months with the
lowest numbers of killed pedestrians are April and May.
Figure 12: Pedestrian fatalities and total fatalities by month in EU-18, 20053
0
100
200
300
400
500
600
700
Jan Feb Mar Apr May Jun Jul Aug Sep Oct Nov Dec
Month
Numberofpedestrianfatalities
0
500
1.000
1.500
2.000
2.500
3.000
3.500
4.000
Numberoftotalfatalities
Pedestrian fatalities 2005² Total fatalities 2005²
Source: CARE Database / EC
Date of query: October 2007
April to June is the
period of the year
with the lowest
number of
pedestrian fatalities.
The number of
pedestrian fatalities
per month peaks in
the winter, whereas
the overall number
of fatalities peaks in
the summer
11. Pedestrians
Project co-financed by the European Commission, Directorate-General Energy and Transport 11 / 12
Motorcycles&
Mopeds
ChildrenYoungPeople
HeavyGoods
Vehicles
CarOccupantsBicyclesMotorwaysJunctionsUrbanAreasMainFiguresTheElderlyPedestrians
Disclaimer
The information in this document is provided as it is and no
guarantee or warranty is given that the information is fit for any
particular purpose. Therefore, the reader uses the information at
their own risk and liability.
For more information
Further statistical information about fatalities is available from the
CARE database at the Directorate-General for Energy and
Transport of the European Commission, 28 Rue de Mot, B-1040
Brussels (see
ec.europa.eu/transport/roadsafety/road_safety_observatory/care_re
ports_en.htm).
Traffic Safety Basic Fact Sheets available from the European
Commission concern:
• Main Figures
• Children (Aged <16)
• Young People (Aged 16-24)
• The Elderly (Aged >64)
• Pedestrians
• Bicycles
• Motorcycle and Mopeds
• Car-Occupants
• Heavy Goods Vehicles
• Motorways
• Junctions
• Urban Areas
Definition of used Country abbreviations
BE Belgium EE Estonia
DK Denmark HU Hungary
EL Greece MT Malta
ES Spain PL Poland
FR France
IE Ireland
IT Italy BG Bulgaria
LU Luxembourg CZ Czech Republic
NL Netherlands DE Germany
AT Austria CY Cyprus
PT Portugal LV Latvia
FI Finland LT Lithuania
SE Sweden RO Romania
UK United Kingdom SI Slovenia
SK Slovakia
EU 14 EU 18 = EU 14 +
EU 27 = EU 18 +
Detailed data on traffic accidents are published annually by the
European Commission in the Annual Statistical Report. This
includes a glossary of definitions on all variables used.
12. Pedestrians
Project co-financed by the European Commission, Directorate-General Energy and Transport 12 / 12
Motorcycles&
Mopeds
ChildrenYoungPeople
HeavyGoods
Vehicles
CarOccupantsBicyclesMotorwaysJunctionsUrbanAreasMainFiguresTheElderlyPedestrians
All these reports and more information on the Integrated Project
SafetyNet, co-financed by the European Commission, Directorate-
General Energy and Transport are also available at the SafetyNet
Website: www.erso.eu/.
Authors
Stefan Hoeglinger, Thomas Leitner KfV, Austria
George Yannis and Petros Evgenikos NTUA, Greece
Niels Bos and Martine Reurings SWOV, The Netherlands
Jeremy Broughton, Brian Lawton and
Louise Walter
TRL, United Kingdom
Manuel Andreu, Jean-François Pace and Jaime
Sanmartín
INTRAS-UVEG, Spain

![Pedestrians
Project co-financed by the European Commission, Directorate-General Energy and Transport 2 / 12
Motorcycles&
Mopeds
ChildrenYoungPeople
HeavyGoods
Vehicles
CarOccupantsBicyclesMotorwaysJunctionsUrbanAreasMainFiguresTheElderlyPedestrians
Figure 1: Number of pedestrian fatalities and proportion on total fatalities in EU-14, 1996-
20051
16,7%
16,1%
15,7%
15,1% 14,9% 14,6%
15,3%
14,0% 13,9% 14,1%
0%
2%
4%
6%
8%
10%
12%
14%
16%
18%
1996 1997 1998 1999 2000 2001 2002 2003¹ 2004¹ 2005¹
Pedestrianfatalities/totalfatalities
-
1.000
2.000
3.000
4.000
5.000
6.000
7.000
Pedestrianfatalities
Share on total fatalities Pedestrian fatalities
Source: CARE Database / EC
Date of query: October 2007
To compare the pedestrian fatality numbers of different countries
the respective population size has been taken into account (see
Table 2). The rate varies from 5,5 pedestrian fatalities per million
inhabitants in Sweden to 46,0 pedestrian fatalities by million
inhabitants in Poland, a rate which is more than 8 times higher.
Table 2: Pedestrian fatalities per million inhabitants by country, 2005
Pedestrian
fatalities
Population
[million]
Pedestrian fatalities per
million inhabitants
BE 108 10,4 10,4
DK 44 5,4 8,1
EE 46 1,3 34,2
EL 234 11,1 21,1
ES 680 43,4 15,7
FR 635 62,7 10,1
IE** 64 4,1 15,7
IT* 710 58,2 12,2
LU*** 6,00 0,5 13,2
HU 289 10,1 28,7
MT 6 0,4 14,9
NL** 97 16,3 6,0
AT 97 8,2 11,8
PL 1.756 38,2 46,0
PT 214 10,5 20,3
FI 45 5,2 8,6
SE 50 9,0 5,5
UK 699 60,2 11,6
EU-18 5.780 355,3 16,3
* Data from 2004 Source: CARE Database / EC
** Data from 2003 Date of query: October 2007
*** Data from 2002 Source of population data: EUROSTAT
The proportion of
fatalities who were
pedestrians fell
slightly between
1996 and 2005.
The rate of
pedestrian fatalities
per million
population is highest
in Poland and
Estonia.](data:image/gif;base64,R0lGODlhAQABAIAAAAAAAP///yH5BAEAAAAALAAAAAABAAEAAAIBRAA7)