Data around Grit and Outcomes
•
1 gefällt mir•956 views

Data that explores the issues around grit and potential questions

Empfohlen
Empfohlen
Weitere ähnliche Inhalte
Andere mochten auch
Andere mochten auch (13)
Mehr von David Rogers
Mehr von David Rogers (20)
Kürzlich hochgeladen
Kürzlich hochgeladen (20)
Data around Grit and Outcomes
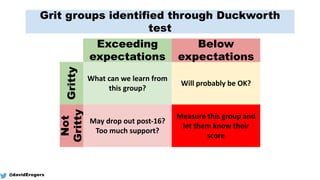
- 1. Grit groups identified through Duckworth test Exceeding expectations Below expectations Gritty Not Gritty What can we learn from this group? May drop out post-‐16? Too much support? Will probably be OK? Measure this group and let them know their score @davidErogers
- 2. Grit Groups and Progress 8 Exceeding expectations Below expectations Gritty Not Gritty 0.50 0.22 -‐0.55 -‐0.85 ) @davidErogers
- 3. Grit Groups and Attendance Exceeding expectations Below expectations Gritty Not Gritty 97% 96% 87% 92% @davidErogers
- 4. Grit Groups and Proportion of Pupil Premium Exceeding expectations Below expectations Gritty Not Gritty 18% 27.5% 36% 30% @davidErogers
- 5. Grit Groups and proportion of girls Exceeding expectations Below expectations Gritty Not Gritty 56% 60% 48% 34% @davidErogers