

Empfohlen
Weitere ähnliche Inhalte
Was ist angesagt?
Was ist angesagt? (20)
Andere mochten auch
Andere mochten auch (20)
Ähnlich wie Population lesson 3
Ähnlich wie Population lesson 3 (20)
Mehr von Mrs Coles
Mehr von Mrs Coles (20)
Kürzlich hochgeladen
Kürzlich hochgeladen (20)
Population lesson 3
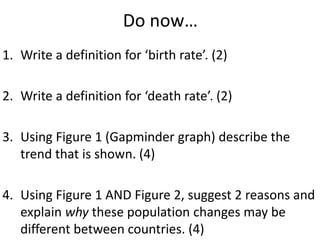
- 1. Do now… 1. Write a definition for ‘birth rate’. (2) 2. Write a definition for ‘death rate’. (2) 3. Using Figure 1 (Gapminder graph) describe the trend that is shown. (4) 4. Using Figure 1 AND Figure 2, suggest 2 reasons and explain why these population changes may be different between countries. (4)
- 2. Figure 1.
- 3. Figure 2.
- 4. Figure 1. Figure 2. 1. Write a definition for ‘birth rate’. (2) 2. Write a definition for ‘death rate’. (2) 3. Using Figure 1 (Gapminder graph) describe the trend that is shown. (4) 4. Using Figure 1 AND Figure 2, suggest 2 reasons and explain why these population changes may be different between countries. (4)
- 5. How and why are there variations between the population structures of countries? How and why have birth rates changed over time?
- 7. Team challenge – DTM memory test Teams of 2-3. 3 viewings (30 seconds) each. Recreate the DTM as accurately as possible.
- 8. Demographic Transition Model Two colours to annotate: one colour to annotate shape of the graph / trend, second colour to annotate possible reasons or example countries
- 9. Homework: Model stages of population change GCSE Geography OCR B photocopy Pg 132-133 Activities 1-4
- 11. Birth Rate Death Rate Population Change A. Billy White loses his job as a grave digger. B. Parents are now able to plan how many children they will have. C. Children share one bedroom with their brothers and sisters. D. There are more wedding anniversaries for couples married for 50 years. E. A mother cries at the grave of her sixth child who has died of the disease typhoid. All of her children have died. F. A lot more houses are being built. G. The public health inspector smiles as the building of new drainage systems for sewage (waste material from toilets) is finished. H. Fewer children share a bedroom with their brothers and sisters. I. Not many grandparents alive. J. People are encouraged to leave their home countries and settle in other lands. Make an estimate for birth rate / death rate / population change by using the DTM graph.
- 12. Statement Which stage on the DTM? Why here? PROVE IT. Jack realises there is not enough farmland available in his village for everyone to grow what they need to survive. He and his wife and 5 children migrate to another area where there is fewer people & more land available. Hospitals are overcrowded with high waiting lists due to an increased demand for joint replacement surgery or to treat geriatric illnesses. Parents of children face difficulty placing their child in schools close to home due to conflict and waiting lists to attend a school of their choice. Energy bills in winter rise each year due to pressure on the energy grid to provide enough gas and electricity to meet consumer demand. The population remains reasonably steady despite fluctuations in birth and death rate. In teams of 3, you must decide…. • Where on the Demographic Transition Model you would put each statement. You must be able to… • Justify your decision by referring to birth rates, death rates or population changes. e.g. This is because birth rates are high but death rate is falling so people live longer so natural increase is occurring and exponential growth. This means there is not enough farmland or resources because the total population is now too high, with overcrowding. Stage 2
- 13. DTM Exam style questions 3 statements. State where in the DTM they belong, with justification for your answer. P E E 1. Politicians worry about the ‘oldies’ vote. 2. Baby booms produce larger school classes. 3. Immigration of key skilled workers is encouraged.