Realtor Property Resource Report - Lake Elsinore CA
•
0 gefällt mir•235 views

A demographic breakdown of Lake Elsinore.

Empfohlen
Weitere ähnliche Inhalte
Andere mochten auch
Andere mochten auch (8)
Ähnlich wie Realtor Property Resource Report - Lake Elsinore CA
Ähnlich wie Realtor Property Resource Report - Lake Elsinore CA (20)
Mehr von Southwest Riverside County Association of Realtors
Mehr von Southwest Riverside County Association of Realtors (20)
Kürzlich hochgeladen
Kürzlich hochgeladen (20)
Realtor Property Resource Report - Lake Elsinore CA
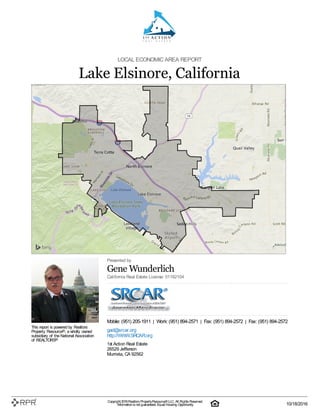
- 1. LOCAL ECONOMIC AREA REPORT Lake Elsinore, California This report is powered by Realtors Property Resource®, a wholly owned subsidiary of the National Association of REALTORS® Presented by Gene Wunderlich California Real Estate License: 01182104 Mobile: (951) 205-1911 | Work: (951) 894-2571 | Fax: (951) 894-2572 | Fax: (951) 894-2572 gad@srcar.org http://WWW.SRCAR.org 1st Action Real Estate 26529 Jefferson Murrieta, CA 92562 Copyright 2016Realtors PropertyResource®LLC. All Rights Reserved. Informationis not guaranteed. Equal Housing Opportunity. 10/18/2016
- 2. CriteriaUsedfor Analysis Income: Median Household Income Age: Median Age PopulationStats: Total Population Segmentation: 1st Dominant Segment $56,972 30.6 59,254 Up and Coming Families Consumer Segmentation Life Mode Urbanization What are the people like that live in this area? Ethnic Enclaves Established diversity--young, Hispanic homeowners with families Where do people like this usually live? Suburban Periphery Affluence in the suburbs, married couple-families, longer commutes Top Tapestry Segments Up and Coming Families Soccer Moms American Dreamers Metro Fusion Front Porches % of Households 6,133 (36.4%) 3,503 (20.8%) 2,234 (13.3%) 1,385 (8.2%) 1,270 (7.5%) % of Riverside County 62,438 (8.8%) 36,539 (5.2%) 55,568 (7.8%) 10,534 (1.5%) 12,200 (1.7%) Lifestyle Group Ethnic Enclaves Family Landscapes Ethnic Enclaves Midtown Singles Middle Ground Urbanization Group Suburban Periphery Suburban Periphery Urban Periphery Urban Periphery Metro Cities Residence Type Single Family Single Family Single Family Multi-Unit Rentals; Single Family Multi-Units; Single Family Household Type Married Couples Married Couples Married Couples Singles Married Couples Average Household Size 3.1 2.96 3.16 2.63 2.55 Median Age 30.7 36.6 31.8 28.8 34.2 Diversity Index 72.4 48.3 83.3 84 70.4 Median Household Income $64,000 $84,000 $48,000 $33,000 $39,000 Median Net Worth $96,000 $252,000 $53,000 $12,000 $21,000 Median Home Value $174,000 $226,000 $130,000 – – Homeownership 74.1 % 85.5 % 65 % 25 % 47.8 % Average Monthly Rent – – – $880 $890 Employment Professional or Services Professional or Management Servicesor Administration Services, Administration or Professional Services, Professional or Administration Education College Degree College Degree High School Graduate College Degree High School Graduate Preferred Activities Visit theme parks, zoos. Contract for home and landscaping services. Go jogging, biking, target shooting. Visit theme parks, zoos. Own feature-rich cell phones. Pay bills, socialize online. Spend money on what'shot unless saving for something specific. Follow football, soccer. Go online for games; visit dating websites, chat rooms. Play bingo, video games. Financial Hold student loans, mortgages Carry high level of debt Spend money carefully; buy necessities Shop at discount grocery stores, Kmart, Walmart Have loansto pay bills Media Go online to shop, bank, for entertainment Shop, bankonline Listen to urban or Hispanic radio Listen to R&B, rap, Latin, reggae music Watch Comedy Central, Nickelodeon, PBS KidsSprout Vehicle Own late-model compact car, SUV Own 2+ vehicles (minivans, SUVs) One or two vehicles Ownsused vehicles Enjoy fun-to-drive cars Lake Elsinore, California Copyright 2016Realtors PropertyResource®LLC. All Rights Reserved. Informationis not guaranteed. Equal Housing Opportunity. 10/18/2016
- 3. Who We Are Up and Coming Families is a market in transition--residents are younger and more mobile and ethnicallydiverse than the previous generation. Theyare ambitious, working hard to get ahead, and willing to take some risks to achieve their goals. The recession has impacted their financial well-being, but theyare optimistic. Their homes are new; their families are young. And this is one of the fastest-growing markets in the country. Our Neighborhood Newsuburban periphery: newfamiliesin new housing subdivisions. Building began in the housing boom of the 2000sand continuesin thisfast-growing market. Single-family homeswith a median value of $174,000 and a lower vacancy rate. The price of affordable housing: longer commute times. Socioeconomic Traits Education: 66%have some college education or degree(s). Hard-working labor force with a participation rate of 71%and lowunemployment at 7%. Most households(63%) have two or more workers. Careful shoppers, aware of prices, willing to shop around for the best dealsand open to influence by others' opinions. Seekthe latest and best in technology. Young familiesstill feathering the nest and establishing their style. Market Profile Rely on the Internet for entertainment, information, shopping and banking. Prefer imported SUVsor compact cars, late models. Carry debt from credit card balancesto student loansand mortgages, but also maintain retirement plansand make charitable contributions. Busy with workand family; use home and landscaping servicesto save time. Find leisure in family activities, moviesat home, tripsto theme parksor the zoo, and sports, from backpacking and baseball to weight lifting and yoga. An overview of who makes up this segment across the United States Thedemographic segmentationshownherecanhelpyouunderstandthelifestyles andlifestages of consumers inamarket. Dataprovider Esri classifies U.S. residential neighborhoods into67uniquemarket segments basedonsocioeconomic anddemographic characteristics. DataSource: Esri 2015. Update Frequency: Annually. Thisisthe #1 dominant segment for thisarea In thisarea 36.4% of householdsfall into thissegment In the United States 2.2% of householdsfall into thissegment About this segment Up and Coming Families Lake Elsinore, California Copyright 2016Realtors PropertyResource®LLC. All Rights Reserved. Informationis not guaranteed. Equal Housing Opportunity. 10/18/2016
- 4. Who We Are Soccer Moms is an affluent, family- oriented market with a countryflavor. Residents are partial to new housing awayfrom the bustle of the citybut close enough to commute to professional job centers. Life in this suburban wilderness offsets the hectic pace of two working parents with growing children. Theyfavor time-saving devices, like banking online or housekeeping services, and family- oriented pursuits. Our Neighborhood Soccer Momsresidentsprefer the suburban periphery of metropolitan areas. Predominantly single family, homesare in newer neighborhoods, 36%built in the 1990s, 31%built since 2000. Owner-occupied homeshave high rate of mortgagesat 74%, and lowrate vacancy at 5%. Median home value is$226,000. Most householdsare married coupleswith children; average household size is2.96. Most householdshave 2 or 3 vehicles; long travel time to workincluding a disproportionate number commuting from a different county Socioeconomic Traits Education: 37.7%college graduates; more than 70%with some college education. Lowunemployment at 5.9%; high labor force participation rate at 72%; 2 out of 3 householdsinclude 2+ workers. Connected, with a host of wirelessdevicesfrom iPodsto tablets--anything that enables convenience, like banking, paying billsor even shopping online. Well insured and invested in a range of funds, from savingsaccountsor bondsto stocks. Carry a higher level of debt, including first and second mortgagesand auto loans Market Profile Most householdsown at least two vehicles; the most popular typesare minivansand SUVs. Family-oriented purchasesand activities dominate, like 4+ televisions, movie purchases or rentals, children'sapparel and toys, and visitsto theme parksor zoos. Outdoor activitiesand sportsare characteristic of life in the suburban periphery, like bicycling, jogging, golfing, boating, and target shooting. Home maintenance servicesare frequently contracted, but these familiesalso like their gardensand own the toolsfor minor upkeep, like riding mowersand tillers. An overview of who makes up this segment across the United States Thedemographic segmentationshownherecanhelpyouunderstandthelifestyles andlifestages of consumers inamarket. Dataprovider Esri classifies U.S. residential neighborhoods into67uniquemarket segments basedonsocioeconomic anddemographic characteristics. DataSource: Esri 2015. Update Frequency: Annually. Thisisthe #2 dominant segment for thisarea In thisarea 20.8% of householdsfall into thissegment In the United States 2.8% of householdsfall into thissegment About this segment Soccer Moms Lake Elsinore, California Copyright 2016Realtors PropertyResource®LLC. All Rights Reserved. Informationis not guaranteed. Equal Housing Opportunity. 10/18/2016
- 5. Who We Are Located throughout the South and West, most American Dreamers residents own their own homes, primarilysingle-family housing--farther out of the city, where housing is more affordable. Median household income is slightlybelow average. The majorityof households include younger married-couple families with children and, frequently, grandparents. Diversityis high; many residents are foreign born, of Hispanic origin. Hard work and sacrifice have improved their economic circumstance as theypursue a better life for themselves and their family. Spending is focused more on the members of the household than the home. Entertainment includes multiple televisions, movie rentals and video games at home or visits to theme parks and zoos. This market is connected and adept at accessing what theywant from the Internet. Our Neighborhood American Dreamersresidentsare family-centric and diverse. Most are married coupleswith children of all agesor single parents; multigenerational homesare common. Average household size ishigher than U.S. average at 3.16. Residentstend to live further out from urban centers--more affordable single-family homes and more elbowroom. Tenure isslightly above average with 65% owner occupancy; primarily single-family homeswith more mortgagesand slightly higher monthly costs. Three quartersof all housing were built since 1970. Many neighborhoodsare located in the urban periphery of the largest metropolitan areas acrossthe South and West. Most householdshave one or two vehicles available and a longer commute to work. Socioeconomic Traits While nearly 16%have earned a college degree, the majority, or 63%, hold a high school diploma only or spent some time at a college or university. Unemployment ishigher at 10.7%; labor force participation isalso higher at 67%. Most American Dreamersresidentsderive income from wagesor salaries, but the rate of poverty isa bit higher in thismarket. They tend to spend money carefully and focus more on necessities. They are captivated by newtechnology, particularly feature-rich smartphones. Connected: They use the Internet primarily for socializing but also for convenience, like paying billsonline. Market Profile When dining out, these residentsfavor fast- food dining placessuch asTaco Bell or Wendy's, aswell asfamily-friendly restaurants like Olive Garden, Denny'sor IHOP. Cell phonesare preferred over landlines. Favorite channelsinclude Animal Planet, MTV, Cartoon Network, and Disney, aswell as programming on Spanish TV. Residentslisten to urban or Hispanic radio. During the summer, family outingsto theme parksare especially popular. An overview of who makes up this segment across the United States Thedemographic segmentationshownherecanhelpyouunderstandthelifestyles andlifestages of consumers inamarket. Dataprovider Esri classifies U.S. residential neighborhoods into67uniquemarket segments basedonsocioeconomic anddemographic characteristics. DataSource: Esri 2015. Update Frequency: Annually. Thisisthe #3 dominant segment for thisarea In thisarea 13.3% of householdsfall into thissegment In the United States 1.5% of householdsfall into thissegment About this segment American Dreamers Lake Elsinore, California Copyright 2016Realtors PropertyResource®LLC. All Rights Reserved. Informationis not guaranteed. Equal Housing Opportunity. 10/18/2016
- 6. Who We Are Metro Fusion is a young, diverse market. Manyresidents do not speak English fluentlyand have moved into their homes recently. Theyare highlymobile. More than three-quarters of households are occupied byrenters. Manyhouseholds have young children; a quarter are single- parent families. The majorityof residents live in midsize apartment buildings. Metro Fusion is a hard-working market with residents who are dedicated to climbing the ladders of their professional and social lives. This is particularlydifficult for the single parents due to median incomes that are 35 percent lower than the U.S. average. Our Neighborhood Over 60%of the homesare multi-unit structureslocated in the urban periphery. Three quartersof residentsare renters, and rentsare about ten percent lessthan the U.S. average. The majority of housing unitswere built before 1990. Single-parent and single-person households make up over half of all households. Socioeconomic Traits They're a diverse market with 30%black, 34% Hispanic and 20%foreign born. Younger residentsare highly connected, while older residentsdo not have much use for the latest and greatest technology. They workhard to advance in their professions, including working weekends. They take pride in their appearance, consider their fashion trendy, and stickwith the same fewdesigner brands. They spend money readily on what'shot unless saving for something specific. Social statusisvery important; they lookto impresswith fashion and electronics. Market Profile They enjoy watching MTV, BET, Spanish TV networksand pay-per-view. They listen to R&B, rap, Latin and reggae music. Football and soccer are popular sports. They shop at discount grocery stores, Kmart and Walmart. They often eat frozen dinners, but when dining out prefer McDonald's, Wendy'sand IHOP. An overview of who makes up this segment across the United States Thedemographic segmentationshownherecanhelpyouunderstandthelifestyles andlifestages of consumers inamarket. Dataprovider Esri classifies U.S. residential neighborhoods into67uniquemarket segments basedonsocioeconomic anddemographic characteristics. DataSource: Esri 2015. Update Frequency: Annually. Thisisthe #4 dominant segment for thisarea In thisarea 8.2% of householdsfall into thissegment In the United States 1.4% of householdsfall into thissegment About this segment Metro Fusion Lake Elsinore, California Copyright 2016Realtors PropertyResource®LLC. All Rights Reserved. Informationis not guaranteed. Equal Housing Opportunity. 10/18/2016
- 7. Who We Are Front Porches blends household types, with more young families with children or single households than average. This group is also more diverse than the U.S. Half of householders are renters, and manyof the homes are older townhomes or duplexes. Friends and familyare central to Front Porches residents and help to influence household buying decisions. Residents enjoytheir automobiles and like cars that are fun to drive. Income and net worth are well below the U.S. average, and manyfamilies have taken out loans to make ends meet. Our Neighborhood Nearly one in five homesisa duplex, triplex or quad; half are older single-family dwellings. Just over half the homesare occupied by renters. Older, established neighborhoods; three quartersof all homeswere built before 1980. Single-parent familiesor singlesliving alone make up almost half of the households. Socioeconomic Traits Composed of a blue-collar workforce with a strong labor force participation rate, but unemployment ishigh at 11%. Price ismore important than brand namesor style to these consumers. With limited incomes, these are not adventurousshoppers. They would rather cooka meal at home than dine out. They seekadventure and strive to have fun. Market Profile Go online for gaming, online dating and chat rooms. Use their cell phonesto redeem mobile couponsand listen to hip hop and R&B music. Drinkenergy and sportsdrinks. Participate in leisure activitiesincluding sports, indoor water parks, bingo and video games. Watch Comedy Central, Nickelodeon and PBS KidsSprout. An overview of who makes up this segment across the United States Thedemographic segmentationshownherecanhelpyouunderstandthelifestyles andlifestages of consumers inamarket. Dataprovider Esri classifies U.S. residential neighborhoods into67uniquemarket segments basedonsocioeconomic anddemographic characteristics. DataSource: Esri 2015. Update Frequency: Annually. Thisisthe #5 dominant segment for thisarea In thisarea 7.5% of householdsfall into thissegment In the United States 1.6% of householdsfall into thissegment About this segment Front Porches Lake Elsinore, California Copyright 2016Realtors PropertyResource®LLC. All Rights Reserved. Informationis not guaranteed. Equal Housing Opportunity. 10/18/2016
- 8. 2015 2020 (Projected) Total Population Thischart showsthe total population in an area, compared with other geographies. Data Source: U.S. CensusAmerican Community Survey via Esri, 2015 Update Frequency: Annually 2015 2020 (Projected) PopulationDensity Thischart showsthe number of people per square mile in an area, compared with other geographies. Data Source: U.S. CensusAmerican Community Survey via Esri, 2015 Update Frequency: Annually 2015 2020 (Projected) PopulationChange Since 2010 Thischart showsthe percentage change in area'spopulation from 2010 to 2015, compared with other geographies. Data Source: U.S. CensusAmerican Community Survey via Esri, 2015 Update Frequency: Annually 2015 2020 (Projected) Average HouseholdSize Thischart showsthe average household size in an area, compared with other geographies. Data Source: U.S. CensusAmerican Community Survey via Esri, 2015 Update Frequency: Annually Lake Elsinore, California: Population Comparison Lake Elsinore, California Copyright 2016Realtors PropertyResource®LLC. All Rights Reserved. Informationis not guaranteed. Equal Housing Opportunity. 10/18/2016
- 9. 2015 2020 (Projected) PopulationLivinginFamily Households Thischart showsthe percentage of an area’spopulation that livesin a household with one or more individuals related by birth, marriage or adoption, compared with other geographies. Data Source: U.S. CensusAmerican Community Survey via Esri, 2015 Update Frequency: Annually Women 2015 Men 2015 Women 2020 (Projected) Men 2020 (Projected) Female / Male Ratio Thischart showsthe ratio of femalesto malesin an area, compared with other geographies. Data Source: U.S. CensusAmerican Community Survey via Esri, 2015 Update Frequency: Annually Lake Elsinore, California Copyright 2016Realtors PropertyResource®LLC. All Rights Reserved. Informationis not guaranteed. Equal Housing Opportunity. 10/18/2016
- 10. 2015 2020 (Projected) MedianAge Thischart showsthe median age in an area, compared with other geographies. Data Source: U.S. CensusAmerican Community Survey via Esri, 2015 Update Frequency: Annually 2015 2020 (Projected) Populationby Age Thischart breaksdown the population of an area by age group. Data Source: U.S. CensusAmerican Community Survey via Esri, 2015 Update Frequency: Annually Lake Elsinore, California: Age Comparison Lake Elsinore, California Copyright 2016Realtors PropertyResource®LLC. All Rights Reserved. Informationis not guaranteed. Equal Housing Opportunity. 10/18/2016
- 11. Married Unmarried Married/ UnmarriedAdults Ratio Thischart showsthe ratio of married to unmarried adultsin an area, compared with other geographies. Data Source: U.S. CensusAmerican Community Survey via Esri, 2015 Update Frequency: Annually Married Thischart showsthe number of people in an area who are married, compared with other geographies. Data Source: U.S. CensusAmerican Community Survey via Esri, 2015 Update Frequency: Annually Never Married Thischart showsthe number of people in an area who have never been married, compared with other geographies. Data Source: U.S. CensusAmerican Community Survey via Esri, 2015 Update Frequency: Annually Widowed Thischart showsthe number of people in an area who are widowed, compared with other geographies. Data Source: U.S. CensusAmerican Community Survey via Esri, 2015 Update Frequency: Annually Divorced Thischart showsthe number of people in an area who are divorced, compared with other geographies. Data Source: U.S. CensusAmerican Community Survey via Esri, 2015 Update Frequency: Annually Lake Elsinore, California: Marital Status Comparison Lake Elsinore, California Copyright 2016Realtors PropertyResource®LLC. All Rights Reserved. Informationis not guaranteed. Equal Housing Opportunity. 10/18/2016
- 12. 2015 2020 (Projected) Average HouseholdIncome Thischart showsthe average household income in an area, compared with other geographies. Data Source: U.S. CensusAmerican Community Survey via Esri, 2015 Update Frequency: Annually 2015 2020 (Projected) MedianHouseholdIncome Thischart showsthe median household income in an area, compared with other geographies. Data Source: U.S. CensusAmerican Community Survey via Esri, 2015 Update Frequency: Annually 2015 2020 (Projected) Per CapitaIncome Thischart showsper capita income in an area, compared with other geographies. Data Source: U.S. CensusAmerican Community Survey via Esri, 2015 Update Frequency: Annually Average Disposable Income Thischart showsthe average disposable income in an area, compared with other geographies. Data Source: U.S. CensusAmerican Community Survey via Esri, 2015 Update Frequency: Annually Lake Elsinore, California: Economic Comparison Lake Elsinore, California Copyright 2016Realtors PropertyResource®LLC. All Rights Reserved. Informationis not guaranteed. Equal Housing Opportunity. 10/18/2016
- 13. Lake Elsinore Riverside County California USA Unemployment Rate Thischart showsthe unemployment trend in an area, compared with other geographies. Data Source: Bureau of Labor Statistics via 3DL Update Frequency: Monthly Employment Count by Industry Thischart showsindustriesin an area and the number of people employed in each category. Data Source: Bureau of Labor Statistics via Esri, 2015 Update Frequency: Annually Lake Elsinore, California Copyright 2016Realtors PropertyResource®LLC. All Rights Reserved. Informationis not guaranteed. Equal Housing Opportunity. 10/18/2016
- 14. Less than9thGrade Thischart showsthe percentage of people in an area who have lessthan a ninth grade education, compared with other geographies. Data Source: U.S. CensusAmerican Community Survey via Esri, 2015 Update Frequency: Annually Some HighSchool Thischart showsthe percentage of people in an area whose highest educational achievement issome high school, without graduating or passing a high school GEDtest, compared with other geographies. Data Source: U.S. CensusAmerican Community Survey via Esri, 2015 Update Frequency: Annually HighSchool GED Thischart showsthe percentage of people in an area whose highest educational achievement ispassing a high school GEDtest, compared with other geographies. Data Source: U.S. CensusAmerican Community Survey via Esri, 2015 Update Frequency: Annually HighSchool Graduate Thischart showsthe percentage of people in an area whose highest educational achievement ishigh school, compared with other geographies. Data Source: U.S. CensusAmerican Community Survey via Esri, 2015 Update Frequency: Annually Some College Thischart showsthe percentage of people in an area whose highest educational achievement issome college, without receiving a degree, compared with other geographies. Data Source: U.S. CensusAmerican Community Survey via Esri, 2015 Update Frequency: Annually Lake Elsinore, California: Education Comparison Lake Elsinore, California Copyright 2016Realtors PropertyResource®LLC. All Rights Reserved. Informationis not guaranteed. Equal Housing Opportunity. 10/18/2016
- 15. Associate Degree Thischart showsthe percentage of people in an area whose highest educational achievement isan associate degree, compared with other geographies. Data Source: U.S. CensusAmerican Community Survey via Esri, 2015 Update Frequency: Annually Bachelor's Degree Thischart showsthe percentage of people in an area whose highest educational achievement isa bachelor's degree, compared with other geographies. Data Source: U.S. CensusAmerican Community Survey via Esri, 2015 Update Frequency: Annually Grad/Professional Degree Thischart showsthe percentage of people in an area whose highest educational achievement isa graduate or professional degree, compared with other geographies. Data Source: U.S. CensusAmerican Community Survey via Esri, 2015 Update Frequency: Annually Lake Elsinore, California Copyright 2016Realtors PropertyResource®LLC. All Rights Reserved. Informationis not guaranteed. Equal Housing Opportunity. 10/18/2016
- 16. MedianEstimatedHome Value Thischart displaysproperty estimatesfor an area and a subject property, where one hasbeen selected. Estimated home valuesare generated by a valuation model and are not formal appraisals. Data Source: Valuation calculations based on public recordsand MLS sources where licensed Update Frequency: Monthly 12-MonthChange inMedian EstimatedHome Value Thischart showsthe 12-month change in the estimated value of all homesin this area, the county and the state. Estimated home valuesare generated by a valuation model and are not formal appraisals. Data Source: Valuation calculations based on public recordsand MLS sources where licensed Update Frequency: Monthly Lake Elsinore, California: Home Value Comparison Lake Elsinore, California Copyright 2016Realtors PropertyResource®LLC. All Rights Reserved. Informationis not guaranteed. Equal Housing Opportunity. 10/18/2016
- 17. Best Retail Businesses Thischart showsthe typesof businessesthat consumersare leaving an area to find. The businesstypesrepresented by blue barsare relatively scarce in the area, so consumersgo elsewhere to have their needsmet. The orange businesstypesare relatively plentiful in the area, meaning there are existing competitorsfor the dollarsthat consumersspend in these categories. Data Source: Retail Marketplace via Esri, 2015 Update Frequency: Annually Indexed ValuesFrom -100 to 100 Lake Elsinore, California Copyright 2016Realtors PropertyResource®LLC. All Rights Reserved. Informationis not guaranteed. Equal Housing Opportunity. 10/18/2016
- 18. RPRcompilesthe data in thisreport from a variety of sources: • Censusdata from the U.S. CensusAmerican Community Survey, provided by data partner 3DL • Demographic data known asTapestry Segmentation, provided by data partner Esri. Tapestry classifiesU.S. residential neighborhoodsinto unique market segmentsbased on socioeconomic and demographic characteristics. • Valuation calculationsare based on public recordsand MLS sources where licensed • Retail Marketplace data shown in the Best Businessesanalysisis provided by data partner Esri. Thisanalysiscomparessupply and demand for specific retail products. The resultsare presented asthe gap between the two in a location. Most data typesin thisreport are refreshed on an annual basis. The U.S. Censussource datesare shown with each chart. The Esri Tapestry Segment data is2015. The home valuation information isrefreshed monthly. About RPR What is RPR? Comprehensive data, powerful analyticsand dynamic reportsfor membersof the National Association of REALTORS® 100% Owned by REALTORS® Created by NARfor the sole purpose of providing REALTORS® with the data they need to meet the demandsof their clients. Learn More For more information about RPRand our programming, please visit our public website: http://blog.narrpr.com About Our Data RealtorsProperty Resource® isa wholly owned subsidiary of the National Association of REALTORS® provided exclusively to itsmembers. Thisreport has been provided to you asa public service by a member of NAR. Lake Elsinore, California Copyright 2016Realtors PropertyResource®LLC. All Rights Reserved. Informationis not guaranteed. Equal Housing Opportunity. 10/18/2016