
Empfohlen
Weitere ähnliche Inhalte
Andere mochten auch
Andere mochten auch (13)
Ähnlich wie relative wages history in the US (modified EPI spreadsheet
Ähnlich wie relative wages history in the US (modified EPI spreadsheet (12)
Mehr von genauer
Mehr von genauer (15)
Kürzlich hochgeladen
Kürzlich hochgeladen (20)
relative wages history in the US (modified EPI spreadsheet
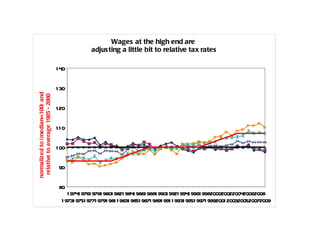
- 1. Wages at the high end are adjus ting a little bit to relative tax rates 1 40 1 30 normalized to ( median=100) and relative to average 1985 - 2000 1 20 110 1 00 90 80 1 9741 9761 9781 9801 9821 9841 9861 9881 9901 9921 9941 9961 99820002002200420062008 1 9731 9751 9771 9791 981 1 9831 9851 9871 9891 991 1 9931 9951 9971 9992001 2003200520072009
- 2. Figure: Change in men's real hourly wage by percentile, 1973-2009 for discussion in http://jaredbernsteinblog.com/the-shape-of-inequality-and-its-impact-on-growth/#comment-9244 original data obtained from http://www.stateofworkingamerica.org/charts/view/15 and modified with normalization Figure data median Wage index (1973 = 100) YEAR PTILE10 PTILE20 PTILE50 PTILE80 PTILE90 PTILE95 Productivity Baseline 1973 103.9 101.7 100.0 94.9 93.0 93.6 75.8 100.0 1974 103.7 101.9 100.0 95.7 94.1 92.2 74.5 100.0 1975 105.0 104.3 100.0 96.7 95.1 95.0 76.6 100.0 1976 103.8 103.0 100.0 96.5 94.5 93.3 79.1 100.0 1977 103.8 101.7 100.0 98.1 93.5 91.4 80.4 100.0 1978 104.7 102.3 100.0 98.2 95.5 91.7 81.4 100.0 1979 101.0 99.9 100.0 96.8 92.2 90.3 81.1 100.0 1980 102.6 101.7 100.0 98.2 93.4 90.9 80.9 100.0 1981 100.5 101.3 100.0 98.0 94.4 91.6 82.0 100.0 1982 100.7 100.3 100.0 97.8 94.2 92.3 81.2 100.0 1983 99.2 98.7 100.0 96.3 94.7 94.3 84.7 100.0 1984 100.5 99.6 100.0 98.8 96.9 95.7 86.4 100.0 1985 102.0 101.4 100.0 100.1 96.5 98.0 87.8 100.0 1986 100.8 100.9 100.0 98.2 96.6 96.5 90.6 100.0 1987 101.2 102.6 100.0 98.7 98.6 96.6 90.8 100.0 1988 100.1 101.5 100.0 99.1 99.0 98.6 92.3 100.0 1989 99.6 99.2 100.0 99.3 97.7 96.3 93.0 100.0 1990 100.7 99.5 100.0 99.9 99.3 99.3 94.7 100.0 1991 101.7 100.3 100.0 99.7 100.3 100.3 96.2 100.0 1992 102.3 99.7 100.0 100.3 98.8 98.5 100.0 100.0 1993 100.5 100.3 100.0 100.2 99.3 96.6 100.6 100.0 1994 98.9 99.4 100.0 101.1 101.3 101.8 101.6 100.0 1995 98.1 99.0 100.0 100.5 101.2 101.8 102.0 100.0 1996 97.4 98.1 100.0 100.3 101.2 101.9 104.7 100.0 1997 99.4 99.4 100.0 101.1 102.5 102.9 106.3 100.0 1998 99.0 99.3 100.0 100.0 102.2 102.2 109.4 100.0 1999 100.0 100.0 100.0 100.6 102.2 103.0 113.0 100.0 2000 98.7 99.6 100.0 100.9 102.7 105.1 116.9 100.0 2001 99.3 99.2 100.0 100.4 104.5 105.6 120.3 100.0 2002 98.8 98.4 100.0 100.9 104.6 107.7 125.8 100.0 2003 99.6 99.1 100.0 101.4 104.9 105.9 130.3 100.0 2004 100.8 99.9 100.0 103.0 105.3 108.3 133.9 100.0 2005 99.6 100.0 100.0 102.2 105.8 109.0 136.1 100.0 2006 101.3 100.6 100.0 102.9 108.2 111.0 137.4 100.0 2007 98.3 99.5 100.0 102.4 107.1 110.9 139.5 100.0 2008 98.6 99.0 100.0 102.5 107.4 112.1 141.0 100.0 2009 97.5 98.4 100.0 102.4 107.0 110.1 145.9 100.0
- 3. Explanations & Sources Figure data explanations median tax-rel. Column wage index ptile"X": For each year in each real wage percentile index column ptile"X", divide the year in the real wage percentile column by the wage for 1973 in the same column* 100 0.974 93 0.953 93 Example: Index PTILE20year=1999 = (Real wage PTILE20year=1999/Real wage PTILE20year=1973) * 100 0.943 93 0.960 93 0.961 93 Original data sources 0.961 93 0.987 93 Columns real PTILE"X": EPI analysis of Current Population Survey, Outgoing 0.962 93 Rotations Group, microdata 0.957 93 0.968 94 Note: Real wages deflated using the CPI-U-RS available at: 0.978 95 http://www.bls.gov/cpi/cpiurs1978_2009.pdf 0.970 96 0.965 97 0.994 98 Data before 1978 estimated using the annual change in the Consumer Price Index for All Urban Consumers 0.991 99 Series ID: CUUR0000SA0 0.996 100 0.995 100 0.984 100 0.980 100 0.982 100 0.993 100 0.991 100 0.992 100 0.995 100 0.998 100 1.030 101 1.051 102 1.062 103 1.078 104 1.093 105 1.097 106 1.084 107 1.084 107 1.070 107 1.094 107 1.095 107 1.126 107
- 4. 1992.5 7.202 8.899 10.575 12.423 0.100 0.200 0.300 0.400 0.600 -0.667 -0.500 -0.333 -0.167 model 0.513 0.607 0.717 0.846 data 0.495 0.612 0.727 0.854 0.05 delta 0.037 -0.009 -0.015 -0.009 Original data Real hourly wages (2009 dollars) ndex column ptile"X", 10th/50th 50th/90th YEAR PTILE10 PTILE20 PTILE30 PTILE40 n the same column* 100 52.3% 52.2% 1973 $7.70 $9.29 $11.04 $12.85 E20year=1973) * 100 52.9% 51.5% 1974 $7.60 $9.12 $10.83 $12.55 51.5% 51.6% 1975 $7.41 $9.05 $10.70 $12.42 55.1% 51.3% 1976 $7.97 $9.26 $10.78 $12.46 54.3% 51.9% 1977 $7.87 $9.12 $10.65 $12.37 53.2% 51.2% 1978 $7.78 $9.20 $10.71 $12.49 56.1% 51.2% 1979 $8.14 $9.28 $10.90 $12.82 53.6% 51.3% 1980 $7.69 $9.10 $10.67 $12.40 55.8% 49.7% 1981 $7.81 $8.90 $10.60 $12.12 53.0% 50.0% 1982 $7.51 $8.75 $10.46 $12.17 51.6% 48.9% 1983 $7.28 $8.58 $10.25 $12.01 50.1% 48.5% 1984 $7.11 $8.62 $10.18 $11.97 48.9% 49.4% 1985 $6.99 $8.71 $10.25 $12.00 rice Index for All Urban Consumers 47.9% 48.8% 1986 $6.98 $8.92 $10.54 $12.44 47.7% 47.9% 1987 $6.96 $8.85 $10.58 $12.53 48.0% 47.2% 1988 $6.96 $8.78 $10.51 $12.52 48.2% 47.7% 1989 $6.95 $8.65 $10.38 $12.40 49.1% 47.4% 1990 $7.07 $8.75 $10.49 $12.37 49.7% 47.3% 1991 $7.20 $8.83 $10.53 $12.31 49.2% 48.4% 1992 $7.19 $8.75 $10.47 $12.23 49.3% 47.3% 1993 $7.16 $8.74 $10.46 $12.29 49.7% 45.6% 1994 $7.08 $8.65 $10.28 $12.06 50.0% 45.3% 1995 $7.07 $8.65 $10.33 $12.16 50.0% 45.0% 1996 $7.04 $8.72 $10.44 $12.17 50.5% 45.3% 1997 $7.28 $8.98 $10.57 $12.32 51.8% 45.3% 1998 $7.67 $9.26 $10.85 $12.90 50.9% 45.7% 1999 $7.78 $9.47 $11.22 $13.00 51.5% 44.9% 2000 $7.86 $9.67 $11.30 $13.07 52.1% 44.4% 2001 $8.11 $9.77 $11.65 $13.35 52.2% 44.1% 2002 $8.20 $9.81 $11.74 $13.48 51.4% 44.4% 2003 $8.16 $9.87 $11.66 $13.71 50.7% 44.7% 2004 $8.05 $9.82 $11.45 $13.57 50.4% 44.0% 2005 $7.91 $9.71 $11.22 $13.31 50.5% 43.8% 2006 $7.95 $9.69 $11.36 $13.36 51.5% 42.9% 2007 $8.06 $9.78 $11.41 $13.39 50.8% 42.9% 2008 $7.98 $9.77 $11.49 $13.50 50.4% 42.6% 2009 $8.05 $9.83 $11.62 $13.71 51.1% 47.3%
- 5. 14.543 17.050 20.135 24.250 31.122 38.797 73.46 0.500 0.600 0.700 0.800 0.900 0.950 0.000 0.167 0.333 0.500 0.667 0.750 1.000 1.181 1.396 1.649 1.948 2.117 1.000 1.172 1.385 1.668 2.140 2.668 0.000 0.008 0.008 -0.011 -0.090 -0.206 Productivity PTILE50 PTILE60 PTILE70 PTILE80 PTILE90 PTILE95 (2005 = 100) $14.73 $16.89 $19.62 $22.43 $28.19 $35.37 55.654 $14.37 $16.54 $19.18 $22.10 $27.89 $34.08 54.759 $14.40 $16.78 $18.99 $22.12 $27.92 $34.77 56.265 $14.48 $16.85 $19.32 $22.46 $28.23 $34.73 58.141 $14.50 $16.67 $19.35 $22.85 $27.96 $34.06 59.050 $14.64 $16.77 $19.35 $22.89 $28.56 $34.18 59.826 $14.50 $16.81 $19.87 $23.15 $28.32 $34.59 59.585 $14.36 $16.69 $19.38 $22.92 $27.97 $33.93 59.427 $13.98 $16.53 $19.27 $22.74 $28.12 $33.99 60.263 $14.18 $16.55 $19.49 $22.97 $28.38 $34.65 59.623 $14.11 $16.45 $19.68 $22.82 $28.82 $35.75 62.244 $14.18 $16.47 $19.54 $23.24 $29.26 $36.04 63.499 $14.30 $16.67 $19.42 $23.42 $28.98 $36.68 64.534 $14.58 $17.11 $20.02 $23.67 $29.88 $37.21 66.524 $14.58 $17.34 $19.96 $23.72 $30.44 $37.15 66.719 $14.49 $17.23 $20.05 $23.94 $30.68 $38.08 67.818 $14.41 $16.83 $20.03 $23.94 $30.25 $37.18 68.337 $14.41 $16.70 $19.81 $23.84 $30.41 $37.90 69.592 $14.49 $16.77 $19.74 $23.70 $30.61 $38.14 70.665 $14.62 $16.70 $19.78 $23.89 $30.21 $37.54 73.490 $14.52 $16.98 $20.00 $24.12 $30.70 $37.20 73.899 $14.26 $16.79 $19.96 $24.30 $31.24 $39.14 74.656 $14.15 $16.75 $19.97 $24.17 $31.24 $39.17 74.961 $14.09 $16.64 $20.04 $24.22 $31.33 $39.36 76.897 $14.42 $16.91 $20.09 $24.47 $31.83 $39.83 78.075 $14.83 $17.43 $20.74 $24.98 $32.75 $40.83 80.368 $15.28 $17.93 $21.17 $25.64 $33.43 $42.02 83.036 $15.24 $18.03 $21.39 $25.98 $33.96 $43.32 85.856 $15.57 $18.22 $21.70 $26.25 $35.07 $44.17 88.367 $15.70 $18.33 $22.01 $26.76 $35.58 $45.66 92.396 $15.89 $18.54 $22.09 $26.98 $35.81 $45.07 95.737 $15.89 $18.45 $21.82 $27.07 $35.51 $45.52 98.404 $15.70 $18.48 $21.82 $26.85 $35.70 $45.82 100.000 $15.77 $18.35 $21.54 $26.70 $36.04 $46.06 100.914 $15.64 $18.55 $22.03 $27.17 $36.45 $47.09 102.517 $15.70 $18.48 $22.04 $27.21 $36.57 $47.59 103.582 $15.96 $18.89 $22.67 $27.97 $37.49 $48.08 107.212