Call Girls in Gomti Nagar - 7388211116 - With room Service
Singland Fy08 130209
1. Singapore Property 13 February 2008
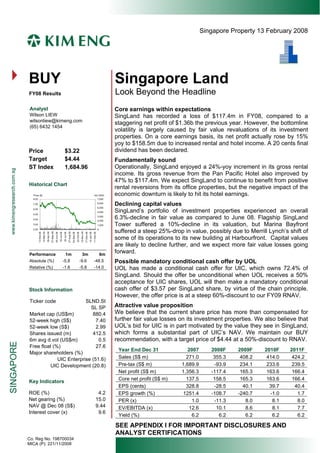
BUY Singapore Land
Look Beyond the Headline
FY08 Results
Analyst Core earnings within expectations
Wilson LIEW SingLand has recorded a loss of $117.4m in FY08, compared to a
wilsonliew@kimeng.com
staggering net profit of $1.36b the previous year. However, the bottomline
(65) 6432 1454
volatility is largely caused by fair value revaluations of its investment
properties. On a core earnings basis, its net profit actually rose by 15%
yoy to $158.5m due to increased rental and hotel income. A 20 cents final
dividend has been declared.
Price $3.22
Target $4.44 Fundamentally sound
Operationally, SingLand enjoyed a 24%-yoy increment in its gross rental
ST Index 1,684.96
income. Its gross revenue from the Pan Pacific Hotel also improved by
47% to $117.4m. We expect SingLand to continue to benefit from positive
Historical Chart
rental reversions from its office properties, but the negative impact of the
economic downturn is likely to hit its hotel earnings.
Price ($) Vol ('000)
8.00 7,000
Declining capital values
6,000
7.00
5,000
6.00
SingLand’s portfolio of investment properties experienced an overall
4,000
5.00
6.3%-decline in fair value as compared to June 08. Flagship SingLand
3,000
4.00
2,000
Tower suffered a 10%-decline in its valuation, but Marina Bayfront
3.00 1,000
2.00 0
suffered a steep 25%-drop in value, possibly due to Merrill Lynch’s shift of
07-May-08
12-Mar-08
09-Apr-08
27-Aug-08
19-Nov-08
13-Feb-08
04-Jun-08
02-Jul-08
30-Jul-08
24-Sep-08
22-Oct-08
17-Dec-08
14-Jan-09
11-Feb-09
some of its operations to its new building at Harbourfront. Capital values
are likely to decline further, and we expect more fair value losses going
forward.
Performance 1m 3m 6m
Possible mandatory conditional cash offer by UOL
Absolute (%) -5.8 -9.6 -48.5
Relative (%) -1.6 -5.8 -14.0 UOL has made a conditional cash offer for UIC, which owns 72.4% of
SingLand. Should the offer be unconditional when UOL receives a 50%
acceptance for UIC shares, UOL will then make a mandatory conditional
cash offer of $3.57 per SingLand share, by virtue of the chain principle.
Stock Information
However, the offer price is at a steep 60%-discount to our FY09 RNAV.
Ticker code SLND.SI
Attractive value proposition
SL SP
We believe that the current share price has more than compensated for
Market cap (US$m) 880.4
further fair value losses on its investment properties. We also believe that
52-week high (S$) 7.40
UOL’s bid for UIC is in part motivated by the value they see in SingLand,
52-week low (S$) 2.99
which forms a substantial part of UIC’s NAV. We maintain our BUY
Shares issued (m) 412.5
recommendation, with a target price of $4.44 at a 50%-discount to RNAV.
6m avg d.vol (US$m) 0.5
Free float (%) 27.6
Year End Dec 31 2007 2008F 2009F 2010F 2011F
Major shareholders (%)
Sales (S$ m) 271.0 355.3 408.2 414.0 424.2
UIC Enterprise (51.6)
Pre-tax (S$ m) 1,689.9 -93.9 234.1 233.6 239.5
UIC Development (20.8)
Net profit (S$ m) 1,356.3 -117.4 165.3 163.6 166.4
Core net profit (S$ m) 137.5 158.5 165.3 163.6 166.4
Key Indicators
EPS (cents) 328.8 -28.5 40.1 39.7 40.4
ROE (%) 4.2 EPS growth (%) 1251.4 -108.7 -240.7 -1.0 1.7
Net gearing (%) 15.0 PER (x) 1.0 -11.3 8.0 8.1 8.0
NAV @ Dec 08 (S$) 9.44 EV/EBITDA (x) 12.6 10.1 8.6 8.1 7.7
Interest cover (x) 9.6
Yield (%) 6.2 6.2 6.2 6.2 6.2
SEE APPENDIX I FOR IMPORTANT DISCLOSURES AND
ANALYST CERTIFICATIONS
Co. Reg No: 198700034
MICA (P): 221/11/2008
2. Singapore Land 13 February 2009
Figure 1: FY08 results breakdown
FY08 FY07 yoy 4Q08 3Q08 4Q07 qoq yoy
($m) ($m) change ($m) ($m) ($m) Change Change
Revenue 355.3 271.0 31% 93.3 89.7 82.4 4% 13%
PBT -93.9 1,689.9 -106% -319.1 57.1 1,559.3 -659% -120%
Net profit -117.4 1,425.1 -108% -258.9 39.8 1,332.9 -750% -119%
Net fair value gains -275.9 1,219.8 -123% -299.9 0.0 0.0 N/A N/A
Net profit ex revaluations 158.5 137.5 15% 41.0 39.8 45.3 3% -10%
Source: Company data
Figure 2: Valuations of SingLand’s investment properties
Dec 08 Jun 08
NLA Implied Valuation
Valuation Valuation
Property ($m) ($m) Change (sq ft) in $psf
SingLand Tower 1,340 1,488 -9.9% 618,930 2,165
Clifford Centre 517 562 -8.0% 274,159 1,886
The Gateway 972 1,067 -8.9% 751,359 1,294
ABACUS Plaza 86.2 94 -8.3% 90,385 954
Tampines Plaza 85.4 92 -7.2% 90,385 945
SGX Centre 512 540 -5.2% 277,711 1,844
Marina Square Retail Mall 810 830 -2.4% 735,999 1,101
Marina Bayfront 63 84 -25.0% 77,059 818
Source: Company data
Figure 3: RNAV Breakdown
NLA (sq ft)/ Market value
Description Stake Rooms (S$m)
SingLand Tower 100% 618,930 1,116.1
Clifford Centre Office 100% 219,327 271.0
Clifford Centre Retail 100% 54,832 60.4
The Gateway 100% 751,359 836.9
Abacus Plaza 100% 90,385 71.3
Tampines Plaza 100% 90,385 71.3
SGX Centre 2 100% 277,711 365.7
Marina Square - retail 53.10% 735,999 691.5
Marina Square - office 53.10% 77,059 59.5
Pan Pacific Hotel 53.10% 775 rooms 451.2
Total investment properties 3,995.0
Book Value of investment properties 4,406.7
Surplus of investment properties -411.7
Associate Companies
Marina Mandarin & Oriental Hotels 26.50% 1,112 rooms 244.6
West Mall 50% 183,828 124.5
Novena Square office 20% 495,300 103.0
Novena Square retail 20% 160,000 31.3
Total associates 503.4
Book value of associates 351.7
Surplus of associates 151.7
PV of developmental profits 28.1
Total surplus ($m) -231.9
Book value of Equity ($m) 3895.8
RNAV ($m) 3,663.9
No. of shares (m) 412.5
RNAV per share $8.88
Premium/(Discount) (50%)
Target Price $4.44
Source: Company data, Kim Eng estimates
2
3. Singapore Land 13 February 2009
Profit and loss Cashflow
YE Dec (S$ m) 2007 2008 2009F 2010F 2011F YE Dec (S$ m) 2007 2008 2009F 2010F 2011F
Sales 271.0 355.3 408.2 414.0 424.2 Operating cash flow -247.8 159.5 155.3 161.9 117.5
Cost of goods sold 107.8 144.7 163.3 165.6 169.7 Net profit 1,356.3 -117.4 165.3 163.6 166.4
Depreciation & amortisation 8.3 11.4 8.1 8.0 7.9
Gross Profit 163.2 210.6 244.9 248.4 254.5
Change in working capital -367.5 -2.3 -11.2 -2.0 -52.0
Operating expenses 9.3 24.2 28.6 29.0 29.7
Others -1,244.9 267.8 -6.8 -7.7 -4.8
Operating Profit 153.9 186.4 216.4 219.4 224.8
Investment cash flow -100.1 1.4 -16.4 11.6 23.0
Net interest -12.2 -10.2 -16.6 -13.8 -13.3
Net capex -29.2 -32.3 -3.1 -3.0 -2.9
Interest income 0.0 0.0 6.0 6.1 5.0
Change in LT investment -83.0 0.9 -16.0 -16.0 -16.0
Interest expense 12.2 10.2 22.6 19.9 18.3
Change in other assets 12.0 32.7 2.7 30.6 41.9
Net investment income/(loss) 0.0 4.6 0.0 0.0 0.0
Cash flow after invt. -347.9 160.9 138.9 173.6 140.5
Net other non-op. JV+Assoc. 84.7 45.1 22.3 14.8 15.8
Financing cash flow 355.7 -139.7 -134.9 -169.4 -136.3
Net exceptionals 1,463.5 -319.7 0.0 0.0 0.0
Change in share capital 0.0 0.0 0.0 0.0 0.0
Pretax income 1,689.9 -93.9 234.1 233.6 239.5
Net change in debt 514.8 -48.8 -43.2 -78.6 -43.9
Income taxes 265.8 -18.9 35.1 35.0 35.9
Change in other LT liab. -159.1 -90.9 -91.7 -90.8 -92.4
Minority Interest 67.8 42.5 33.7 34.9 37.1
Net cash flow 7.8 21.2 4.0 4.2 4.2
Net profit 1,356.3 -117.4 165.3 163.6 166.4
EBITDA 162.2 194.6 224.5 227.4 232.7
Source: Company data, Kim Eng estimates
EPS basic (Scts) 328.8 -28.5 40.1 39.7 40.4
EPS fully diluted (Scts) 328.8 (28.5) 40.1 39.7 40.4
Key ratios
Source: Company data, Kim Eng estimates
YE Dec (S$ m) 2007 2008 2009F 2010F 2011F
Growth (% YoY)
Sales 33.5 31.1 14.9 1.4 2.5
OP 30.4 29.1 16.3 1.4 2.5
Balance Sheet EBITDA 40.0 20.0 15.3 1.3 2.3
NP 1251.4 -108.7 -240.7 -1.0 1.7
YE Dec (S$ m) 2007 2008 2009F 2010F 2011F
EPS 1251.4 -108.7 -240.7 -1.0 1.7
Total assets 5,967.9 5,734.9 5,740.2 5,743.4 5,817.6
Profitability (%)
Current assets 431.0 482.6 485.6 473.8 533.0
Gross margin 60.2 59.3 60.0 60.0 60.0
Cash and bank balances 25.7 46.8 50.8 55.0 59.2
Operating margin 56.8 52.5 53.0 53.0 53.0
Accounts receivable 14.1 11.0 24.2 27.2 28.2
EBITDA margin 59.8 54.8 55.0 54.9 54.9
Others 391.3 424.8 410.6 391.6 445.5
Net Profit margin 500.5 -33.1 40.5 39.5 39.2
Other assets 5,536.8 5,252.3 5,254.6 5,269.6 5,284.6
ROA 22.7 -2.0 2.9 2.8 2.9
LT investments 12.0 12.0 15.0 18.0 21.0
ROE 33.1 -3.0 4.2 4.0 4.0
Associates 336.6 351.7 367.7 383.7 399.7
Stability
Investment properties 4,703.0 4,406.7 4,406.7 4,406.7 4,406.7
Gross debt/equity (%) 18.0 17.7 16.2 14.0 12.6
Others 485.2 481.8 465.2 461.2 457.2
Net debt/equity (%) 17.4 16.5 15.0 12.6 11.2
Total liabilities 1,874.9 1,839.2 1,761.7 1,683.8 1,674.0
Int. coverage (X) 12.6 18.3 9.6 11.0 12.3
Current liabilities 349.9 350.7 319.9 267.4 236.7
Int. & ST debt coverage (X) 0.6 0.8 0.9 1.0 1.3
Creditors & accruals 64.5 80.0 62.0 43.0 44.0
Cash flow int. coverage (X) -20.3 15.7 6.9 8.1 6.4
ST borrowings 259.5 236.8 222.8 189.3 155.8
Cash flow int. & ST debt (X) -0.9 0.6 0.6 0.8 0.7
Others 26.0 33.9 35.1 35.0 36.9
Current ratio (X) 1.2 1.4 1.5 1.8 2.3
Long-term liabilities 1,524.9 1,488.4 1,441.7 1,416.4 1,437.2
Quick ratio (X) 1.2 1.3 1.4 1.7 2.1
Long-term debts 479.0 452.9 423.7 378.6 368.2
Net debt (S$m) 712.8 642.9 595.7 512.9 464.8
Others 1,045.9 1,035.5 1,018.0 1,037.8 1,069.0
Per share data (Scts)
Shareholder's equity 4,093.0 3,895.8 3,978.6 4,059.7 4,143.6
EPS basic 328.8 -28.5 40.1 39.7 40.4
Paid-in capital 840.3 840.3 840.3 840.3 840.3
EPS fully diluted 328.8 -28.5 40.1 39.7 40.4
Reserve 3,252.6 3,055.4 3,138.2 3,219.3 3,303.3
CFPS -60.1 38.7 37.7 39.3 28.5
Net tangible asset 4,093.0 3,895.8 3,978.6 4,059.7 4,143.6
BVPS 992 944 965 984 1,005
SPS 65.7 86.1 99.0 100.4 102.8
Source: Company data, Kim Eng estimates
EBITDA/share 39.3 47.2 54.4 55.1 56.4
DPS 20.0 20.0 20.0 20.0 20.0
Source: Company data, Kim Eng estimates
3
4. ANALYSTS’ COVERAGE / RESEARCH OFFICES
SINGAPORE MALAYSIA TAIWAN
Stephanie WONG Head of Research YEW Chee Yoon Head of Research Gary CHIA
Regional Head of Institutional Research Co-Head of Greater China
+603 2141 1555 cheeyoon@kimengkl.com
+65 6432 1451 swong@kimeng.com Strategy +886 2 3518 7900 gary.chia@yuanta.com
Strategy Banks Ti-sheng YOUNG
Co-Head of Greater China
Small & Mid Caps Telcos
Gregory YAP Property +852 2973 6988 ti-sheng.young@yuanta.com
+65 6432 1450 gyap@kimeng.com Conglomerates & others Kevin CHANG
Head of Regional Tech Strategy
Conglomerates LIEW Mee Kien
Technology & Manufacturing +603 2141 1555 meekien@kimengkl.com +886 2 3518 7901 kevin.chang@yuanta.com
Transport & Telcos Gaming John BREBECK
Head of Taiwan Strategy
Rohan SUPPIAH Media
+65 6432 1455 rohan@kimeng.com Power +886 2 3518 7906 john.brebeck@yuanta.com
Airlines Construction Vincent CHEN
Head of Downstream Tech
Marine & Offshore Research Team
Pauline LEE +603 2141 1555 +886 2 3518 7903
+65 6432 1453 paulinelee@kimeng.com Oil & Gas vincent.chen@yuanta.com
Bank & Finance Food & Beverage Jack CHANG
Head of Non-Tech & Cyclical
Consumer Manufacturing
Retail Plantations +886 2 3518 7905 jack.chang@yuanta.com
Wilson LIEW Tobacco Teyi KUNG, Ph.D
+65 6432 1454 wilsonliew@kimeng.com Technology +886 2 3518 7921 teyi.kung@yuanta.com
Hotel & Resort Healthcare
Property & Construction Celia WANG
INDONESIA
Anni KUM +886 2 3518 7925 celia.wang@yuanta.com
Katarina SETIAWAN Head of Research
+65 6432 1470 annikum@kimeng.com Financial
+6221 2557 1125 ksetiawan@kimeng.co.id
Industrials Jeff PU
Consumer
REITs +886 2 3518 7936 jeff.pu@yuanta.com
Infra
James KOH TFT-LCD
Shipping
+65 6432 1431 jameskoh@kimeng.com Strategy
Infrastructure THAILAND
Telcos
Resources Others David BELLER
David LOOMIS Ricardo SILAEN +662 658 6300 x 4740 david.b@kimeng.co.th
+65 6432 1417 dloomis@kimeng.com +6221 2557 1126 rsilaen@kimeng.co.id Banks
Special Situations Auto Shipping
Energy Naphat CHANTARASEREKUL
KELIVE Singapore Heavy Equipment +662 658 6300 x 4770 naphat.c@kimeng.co.th
ONG Seng Yeow Head of Research Property Energy
+65 6432 1832 ongsengyeow@kimeng.com Resources Piya ORANRIKSUPHAK
TAN Chin Poh Teguh SUNYOTO +662 658 6300 x 4710 piya.O@kimeng.co.th
+65 6432 1859 chinpoh@kimeng.com +6221 2557 1127 tsunyoto@kimeng.co.id Property
GOH Han Peng Cement Supattra KHONGRUNGPHAKORN
+65 6432 1857 gohhanpeng@kimeng.com Construction +662 6586300 ext 4800 supattra.k@kimeng.co.th
Ken TAI Pharmaceutical Electronics
+65 6432 1412 kentai@kimeng.com Retail Automotive
Adi N. WICAKSONO Tourism
+6221 2557 1130 anwicaksono@kimeng.co.id Kanchan KHANIJOU
HONG KONG / CHINA
Generalist + 662 658 6300 x 4750 kanchan@kimeng.co.th
Edward FUNG Head of Research
Arwani PRANADJAYA Construction
+852 2268 0632 edwardfung@kimeng.com.hk
+6221 2557 1129 apranadjaya@kimeng.co.id
Power
Technical analyst KELIVE Thailand (for retail clients)
Construction
George HUEBSCH Head of Research
Ivan CHEUNG
PHILIPPINES
+852 2268 0634 ivancheung@kimeng.com.hk +662 658 6300 ext 1400 george.h@kimeng.co.th
Ed BANCOD Head of Research
Property
Ivan LI +63 2 849 8848 ed_bancod@atr.com.ph VIETNAM
+852 2268 0641 ivanli@kimeng.com.hk Strategy LE Huy Hoang Head of Research
Bank & Finance Banking +84 838 38 66 36 x 160 hoang.le@kimeng.com.vn
Larry GRACE Laura DY-LIACCO Strategy
+852 2268 0630 larrygrace@kimeng.com.hk +63 2 849 8843 laura_dyliacco@atr.com.ph Nguyen Thi Ngan Tuyen
Oil & Gas Utilities +84 838 38 66 36 x 163 tuyen.nguyen@kimeng.com.vn
Energy Conglomerates Pharmaceutical
TAM Tsz Wang Lovell SARREAL Confectionary and Beverage
+852 2268 0636 tamtszwang@kimeng.com.hk +63 2 849 8871 lovell_sarreal@atr.com.ph Oil and Gas
Small Caps Consumer Ngo Bich Van
Emily LEE Cement +84 838 38 66 36 x 164 van.ngo@kimeng.com.vn
+852 2268 0631 emilylee@kimeng.com.hk Media Bank
Small Caps Robin SARMIENTO Insurance
Jacqueline KO +63 2 849 8831 robin_sarmiento@atr.com.ph Ngo Thuc Vu
+852 2268 0633 jacquelineko@kimeng.com.hk Ports +84 838 38 66 36 x 167 vu.ngo@kimeng.com.vn
Food & Beverage Mining Fisheries
Ricardo PUIG Power
+63 2 849 8846 ricardo_puig@atr.com.ph
INDIA Nguyen Doan Quang
Property
Jigar SHAH Head of Research +84 838 38 66 36 x 168 quang.nguyen@kimeng.com.vn
Telcos
+91 22 6623 2601 jshah@kimeng.com Port and Logistics
Oil & Gas Transportation
REGIONAL
Transportation
Luz LORENZO Economist
Anubhav GUPTA
+91 22 6623 2605 agupta@kimeng.com +63 2 849 8836 luz_lorenzo@atr.com.ph
Property Economics
Capital goods
Urmil SHAH
+91 22 6623 2606 urmil@kimeng.co.in
Software
Telecom Recommendation definitions
Media
Our recommendation is based on the
Ankit THAKKAR
+91 22 6623 2606 ankit@kimeng.co.in following expected price
Healthcare
performance within 12 months:
Consumer goods
+15% and above: BUY
-15% to +15%: HOLD
-15% or worse: SELL
4
5. Singapore Land 13 February 2009
APPENDIX I: TERMS FOR PROVISION OF REPORT, DISCLOSURES
AND
DISCLAIMERS
This report, and any electronic access to it, is restricted to and intended only for clients of Kim Eng Research Pte. Ltd.
(quot;KERquot;) or a related entity to KER (as the case may be) who are institutional investors (for the purposes of both the
Singapore Securities and Futures Act (“SFA”) and the Singapore Financial Advisers Act (“FAA”)) and who are allowed
access thereto (each an quot;Authorised Personquot;) and is subject to the terms and disclaimers below.
IF YOU ARE NOT AN AUTHORISED PERSON OR DO NOT AGREE TO BE BOUND BY THE TERMS AND
DISCLAIMERS SET OUT BELOW, YOU SHOULD DISREGARD THIS REPORT IN ITS ENTIRETY AND LET KER OR
ITS RELATED ENTITY (AS RELEVANT) KNOW THAT YOU NO LONGER WISH TO RECEIVE SUCH REPORTS.
This report provides information and opinions as reference resource only. This report is not intended to be and does not
constitute financial advice, investment advice, trading advice or any other advice. It is not to be construed as a
solicitation or an offer to buy or sell any securities or related financial products. The information and commentaries are
also not meant to be endorsements or offerings of any securities, options, stocks or other investment vehicles.
The report has been prepared without regard to the individual financial circumstances, needs or objectives of persons
who receive it. The securities discussed in this report may not be suitable for all investors. Readers should not rely on
any of the information herein as authoritative or substitute for the exercise of their own skill and judgment in making any
investment or other decision. Readers should independently evaluate particular investments and strategies, and are
encouraged to seek the advice of a financial adviser before making any investment or entering into any transaction in
relation to the securities mentioned in this report. The appropriateness of any particular investment or strategy whether
opined on or referred to in this report or otherwise will depend on an investor’s individual circumstances and objectives
and should be confirmed by such investor with his advisers independently before adoption or implementation (either as
is or varied). You agree that any and all use of this report which you make, is solely at your own risk and without any
recourse whatsoever to KER, its related and affiliate companies and/or their employees. You understand that you are
using this report AT YOUR OWN RISK.
This report is being disseminated to or allowed access by Authorised Persons in their respective jurisdictions by the Kim
Eng affiliated entity/entities operating and carrying on business as a securities dealer or financial adviser in that
jurisdiction (collectively or individually, as the context requires, quot;Kim Engquot;) which has, vis-à-vis a relevant Authorised
Person, approved of, and is solely responsible in that jurisdiction for, the contents of this publication in that
jurisdiction.
Kim Eng, its related and affiliate companies and/or their employees may have investments in securities or derivatives of
securities of companies mentioned in this report, and may trade them in ways different from those discussed in this
report. Derivatives may be issued by Kim Eng its related companies or associated/affiliated persons.
Kim Eng and its related and affiliated companies are involved in many businesses that may relate to companies
mentioned in this report. These businesses include market making and specialised trading, risk arbitrage and other
proprietary trading, fund management, investment services and corporate finance.
Except with respect the disclosures of interest made above, this report is based on public information. Kim Eng makes
reasonable effort to use reliable, comprehensive information, but we make no representation that it is accurate or
complete. The reader should also note that unless otherwise stated, none of Kim Eng or any third-party data providers
make ANY warranties or representations of any kind relating to the accuracy, completeness, or timeliness of the data
they provide and shall not have liability for any damages of any kind relating to such data.
Proprietary Rights to Content. The reader acknowledges and agrees that this report contains information,
photographs, graphics, text, images, logos, icons, typefaces, and/or other material (collectively “Content”) protected by
copyrights, trademarks, or other proprietary rights, and that these rights are valid and protected in all forms, media, and
technologies existing now or hereinafter developed. The Content is the property of Kim Eng or that of third party
providers of content or licensors. The compilation (meaning the collection, arrangement, and assembly) of all content on
this report is the exclusive property of Kim Eng and is protected by Singapore and international copyright laws. The
reader may not copy, modify, remove, delete, augment, add to, publish, transmit, participate in the transfer, license or
sale of, create derivative works from, or in any way exploit any of the Content, in whole or in part, except as specifically
permitted herein. If no specific restrictions are stated, the reader may make one copy of select portions of the Content,
provided that the copy is made only for personal, information, and non-commercial use and that the reader does not alter
or modify the Content in any way, and maintain any notices contained in the Content, such as all copyright notices,
trademark legends, or other proprietary rights notices. Except as provided in the preceding sentence or as permitted by
the fair dealing privilege under copyright laws, the reader may not reproduce, or distribute in any way any Content
without obtaining permission of the owner of the copyright, trademark or other proprietary right. Any authorised/permitted
distribution is restricted to such distribution not being in violation of the copyright of Kim Eng only and does not in any
way represent an endorsement of the contents permitted or authorised to be distributed to third parties.
5
7. Singapore London New York Taiwan
Kim Eng Securities Pte Ltd Kim Eng Securities (London) Ltd Kim Eng Securities USA Inc Yuanta Securities Investment
th
Kim Eng Research Pte Ltd 6/F, 20 St. Dunstan’s Hill 406, East 50 Street Consulting Co.
9 Temasek Boulevard London EC3R 8HY, UK New York, NY 10022, U.S.A. 10/F, No 225, Nanking East Rd
#39-00 Suntec Tower 2 Section 3
Singapore 038989 Tel: +44 20 7621 9298 Tel: +1 212 688 8886 Taipei 104, Taiwan
Dealers’ Tel: +44 20 7626 2828 Fax: +1 212 688 3500
Tel: +65 6336 9090 Fax: +44 20 7283 6674 Tel: +886 2 8770-6078
Fax: +65 6339 6003 Jeffrey S. SEO Fax: +886 2 2546-0376
Giles WALSH (sales) jseo@kesusa.com
LAU Wai Kwok (sales) gwalsh@kimeng.co.uk Arthur LO (sales)
lauwk@kimeng.com Lynda KOMMEL-BROWNE Arthur.lo@yuanta.com.tw
Geoff HO (sales) lkommel@kesusa.com
Stephanie WONG (research) gho@kimeng.co.uk Gary CHIA (research)
swong@kimeng.com Michelle MALLETTE Gary.chia@yuanta.com.tw
James JOHNSTONE (sales) mmallette@kesusa.com
jjohnstone@kimeng.co.uk
Jeffry NIEDERMEYER
jniedermeyer@kesusa.com
Hong Kong Thailand Indonesia Malaysia
Kim Eng Securities (HK) Ltd Kim Eng Securities (Thailand) PT Kim Eng Securities Kim Eng Research Sdn Bhd
Level 30, Public Company Limited Plaza Bapindo 16/F, Kompleks Antarabangsa
th
Three Pacific Place, 999/9 The Offices at Central World, Citibank Tower 17 Floor Jalan Sultan Ismail
th st
1 Queen’s Road East, 20 - 21 Floor, Jl Jend. Sudirman Kav. 54-55 50250 Kuala Lumpur, Malaysia
Hong Kong Rama 1 Road, Pathumwan, Jakarta 12190, Indonesia
Bangkok 10330, Thailand Tel: +603 2141 1555
Tel: +852 2268 0800 Tel: +62 21 2557 1188 Fax: +603 2141 1045
Fax: +852 2877 0104 Tel: +66 2 658 6817 (sales) Fax: +62 21 2557 1189
Tel: +66 2 658 6801 (research) YEW Chee Yoon (research)
Ray LUK (sales) Kurnia SALIM (sales) cheeyoon@kimengkl.com
rluk@kimeng.com.hk Vikas KAWATRA (sales) ksalim@kimeng.co.id
vkawatra@kimeng.co.th
Edward FUNG (research) Katarina SETIAWAN (research)
edwardfung@kimeng.com.hk David BELLER (research) ksetiawan@kimeng.co.id
david.b@kimeng.co.th
Philippines Vietnam India
ATR-Kim Eng Securities Inc. Kim Eng Vietnam Securities Joint Kim Eng Securities India Pvt Ltd
17/F, Tower One & Exchange Stock Company 2nd Floor, The International,
Plaza 1st Floor, 255 Tran Hung Dao St. Plot No.16, Maharishi Karve Road,
Ayala Triangle, Ayala Avenue District 1 Churchgate Station,
Makati City, Philippines 1200 Ho Chi Minh City, Vietnam Mumbai City - 400 020, India
Tel: +63 2 849 8888 Tel : +84 838 38 66 36 Tel: +91.22.6623.2600
Fax: +63 2 848 5738 Fax : +84 838 38 66 39 Fax: +91.22.6623.2604
Lorenzo ROXAS (sales) DAO Minh Duc (sales) Vikas KAWATRA (sales)
lorenzo_roxas@atr.com.ph Duc.dao@kimeng.com.vn vkawatra@kimeng.co.th
Ed BANCOD (research) LE Huy Hoang (research) Jigar SHAH (research)
ed_bancod@atr.com.ph hoang.le@kimeng.com.vn jshah@kimeng.com
South Asia Sales Trading North Asia Sales Trading North America Sales Trading
Connie TAN Eddie LAU Warren KIM
connie@kimeng.com eddielau@kimeng.com.hk wkim@kesusa.com
Tel: +65 6333 5775 Tel: +852 2268 0800 Tel: +1 212 688 8886
US Toll Free: +1 866 406 7447 US Toll Free: +1 866 598 2267
Ong Seng Yeow
Director, Retail Research
Singapore Equity Research Our reports are available at Bloomberg, Thomson & Reuters www.kimengresearch.com.sg