
Empfohlen
Weitere ähnliche Inhalte
Kürzlich hochgeladen
Kürzlich hochgeladen (20)
Empfohlen
Empfohlen (20)
Nora Dreamer: What is Degrading our Urban Piedmont Streams?
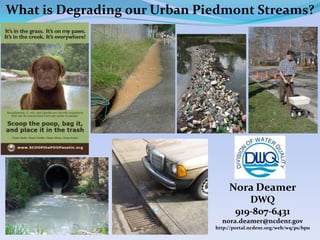
- 1. What is Degrading our Urban Piedmont Streams? Nora Deamer DWQ 919-807-6431 nora.deamer@ncdenr.gov http://portal.ncdenr.org/web/wq/ps/bpu
- 2. DWQ Water Quality Assessment 17 Major River Basins in NC
- 3. DWQ Water Quality Assessment Every two years – determine how well our water bodies supports their designated uses. Designated uses are bases on stream classifications Class C – Protection and propagation of aquatic life; Fish consumption; Secondary Recreation Class B – Recreation (Swimming) Class WS – Water Supply Others (Tr, ORW, HQW, SA)
- 4. DWQ Water Quality Assessment Use Support Ratings Supporting – No criteria exceeded Impaired – Criteria exceeded Not Rated – Inconclusive information/data No Data – No assessment made Produce an Integrated Report (303(d)/305(b)) (The NC 2012 303(d) impaired waters list is currently out for public comment. NC is required to submit the 2012 list to the US EPA by April 1st)
- 6. Impacts of Urbanization Increased Decreased Impervious surface Vegetative cover Runoff volume Riparian buffer zones Runoff velocity Soil infiltration Water Quality Stream bank erosion Aquatic Habitat Stream channelization Groundwater base flow rates Soil disturbance Drought stream flow rates Soil compaction
- 10. Water Quality Impacts of Urbanization Increased Decreased Stream bank erosion Aquatic habitat SedimentationTurbidity Aquatic biodiversity Water temperatures Aquatic health & Conductivity reproduction Pollutant Concentrations Dissolved Oxygen (nutrients, pesticides, oils, metals) pH Bacterial loading (animal and human waste) Algal/Periphytic growth Water supply treatment cost
- 12. What Can You Do To Reduce Stormwater Pollution? Divert roof drains to Pick-up pet waste vegetated areas Restore stream buffers Use rain barrels/cisterns Support land use & Convert lawns to natural stormwater planning area Minimize paved areas or Vegetate bare areas use pervious pavement Use environmentally friendly lawn care materials Keep storm drains clean Maintain vehicle Inspect/maintain septic Wash vehicle on grassy systems areas
- 14. Chapel Hill
- 15. Chapel Hill
- 16. 2010 Urban Stream Piedmont Impairments B en Number of Impaired Assessment Units th ic H M 0 20 40 60 80 100 120 ig Fi ac h s r W h C oin Lo ate om ver w r m t D Tem un is so pe ity lv r ed atu Fe O re ca xy lC ge ol Lo n ifo w rm Tu pH (r rbid ec it C rea y hl or tion o ) N phy W O 2+ ll a at N er O co Am 3-N lu m mo n ni M er a cu ry Zi nc Le ad C op pe r PC B
- 17. 2010 Urban Stream Piedmont Impairments B en Number of Impaired Assessment Units t hi c H M 0 5 10 15 20 25 30 35 40 45 100 120 ig Fi ac h s r W h C oin Lo ate om ver w r m t D Tem un is so pe ity lv r ed atu Fe O re ca xy lC ge ol Lo n ifo w rm Tu pH rb (r ec idi t C rea y hl or tion o ) N phy W O 2+ ll a at N er O co Am 3-N lu m mo n ni M er a cu ry Zi nc Le ad C op pe r PC B
- 18. Number of Impaired Assessment Units Number of Impaired Stream Miles 1000 800 600 400 2010 200 Urban 120 Piedmont 100 Stream 80 Impairments 60 ~ By Basin 40 20 0 ee ar ke ba se Fe D no eu aw e N oa e at Pe ap C R n- C ki d Ya
- 19. 0303002 2010 0303003 Fecal Coliform 0303006 Bacterial Assessment 0303004 0303007 0303005 Standard assessed - 400 CFU/100 mL
- 20. Little Creek Watershed 2010/2012 Assessment Booker Creek Upper 3.5 mile segment – Impaired Benthic Macroinvertebrate Low Dissolved Oxygen (30%) Lower 2.1 mile segment – Impaired Benthic Macroinvertebrate Bolin Creek Middle 3.1 mile segment – Impaired Benthic Macroinvertebrate Little Creek Upper 4.9 mile segment – Impaired Benthic Macroinvertebrate
- 21. Tools & Strategies DWQ Utilizes to Restore Urban Streams Work with stakeholders/watershed groups to develop watershed restoration plans Phase I and Phase II Stormwater regulations Development of Total Daily Maximum Loads (TMDL) for a specific stream reach and pollutant of interest. (A percent load reduction is determined) Development of specific management strategies and rules (Jordan Lake, Falls Lake, Randleman Lake)
- 22. Jordan Lake Nutrient Management Strategy & Rules Jordan Lake Strategy is divided into three management segment requiring different amount of reductions in order to meet standards.
- 23. Jordan Lake Nutrient Management Strategy & Rules 15A NCAC 02B .0262-.0273 & .0311 (q) Agricultural Stormwater Management for New Development Stormwater Management for Existing Development Protection of Existing Riparian Buffers Mitigation for Riparian Buffers Riparian Buffer Mitigation Fees for NC EEP Wastewater Discharge Requirements Stormwater Requirements for State and Federal Entities Fertilizer Management Options for Offsetting Nutrient Loads Cape Fear Basin – Jordan Lake Watershed WS-V reclassification For more information see DWQ website - http://portal.ncdenr.org/web/jordanlake
- 24. Questions Nora Deamer Division of Water Quality 919-807-6431 nora.deamer@ncdenr.gov Basinwide Planning Website http://portal.ncdenr.org/web/wq/ps/bpu
- 25. 2010 & Draft NC 2012 Assessment (Integrated Report) Impairment AU# Stream Name Location Classification Miles Use Support Rating/Information Status Booker Creek Watershed Booker Creek From source to dam at Fair Bug (BB198 - Piney Mtn Rd.); 16-41-1-15-2-(1) (East-wood WS-V,B;NSW 3.5 m Impaired Eastwood Lake Low DO @ B3050000 = 30.4% Lake) From dam at eastwood 16-41-1-15-2-(4) Booker Creek WS-V;NSW 1.2 m Impaired Fair Bug Lake to US Hwy 15 From US Hwy 15 to Little 16-41-1-15-2-(5) Booker Creek WS-IV;NSW 0.9 m Impaired Fair Bug Creek Bolin Creek Watershed 16-41-1-15-1- Bolin Creek From source to Pathway WS-V;NSW 5.3 m Supporting Good-Fair Bug (BB330 - SR1777) (0.5)a (Hogen Lake) Drive 16-41-1-15-1- Bolin Creek From Pathway Drive to US Fair Bug (BB506 - Estes Dr. WS-V;NSW 3.1 m Impaired (0.5)b (Hogen Lake) Hwy 501 Business Upstream 400M) From US Hwy 501 No Data or information to make 16-41-1-15-1-(4) Bolin Creek WS-IV;NSW 0.9 m No Data Business to Little Creek assessment Little Creek Wateshed From source to a point 16-41-1-15-(0.5) Little Creek 0.7 mile downstream of WS-IV;NSW 4.9 m Impaired Poor Bug (BB197 - Pinehurst Dr.) Durham County SR 1110 From a point 0.7 mile downstream of Durham WS-IV; No Data or information to make 16-41-1-15-(3) Little Creek 0.8 m No Data County SR 1110 to New NSW,CA assessment Hope Creek
- 28. Nonpoint Sources of Pollution Pollution reaching waterways from rainfall runoff, atmospheric deposition and groundwater flow. Impacts result from cumulative effects of many small activities.
- 29. Changing Hydrology Effects Forces more After water (energy) Development more quickly Before Development Physically damages stream channel
- 30. Buffer Zones on Streams Top of bank Zone 2: Zone 1: 30’ 20’ undisturbed Stream managed forest vegetation vegetation
- 31. Planning Considerations Avoid Areas Near Sensitive Waters Maintain Buffer Areas Around Streams Consider Land Constraints - slope/soil… Maintain Areas of Open Space Minimize Impervious Cover
- 32. Planning Options Low Impact Development (LID) Maintain Stream Buffers Consider Slope & Soil Maintain Open Space Minimize Impervious Cover
- 33. What can local governments do to reduce stormwater pollution? Limit impervious surfaces by concentrating development in high density clusters. Encourage mass transit to reduce need for roads/parking lots. Set zoning standards for development to reduce runoff and protect stream corridors. Discourage development in floodplains. Protect farmland and open spaces.
- 34. Benefits of Riparian Buffers Trap/Remove sediment from runoff Protect stream bank from erosion Trap/Remove nutrients, metals and other contaminants Effective flood control Provides food and habitat for wildlife
- 35. How Buffers Work Sediment Nitrogen Phosphorus Other Contaminants Flood Control Channel Stability Wildlife Habitat
- 36. Impacts of Increased Turbidity 4-32 NTU – Reduced food intake – Slight reduction in growth – Reduced survival percentages – Avoidance, escape 80-90 NTU – Marked reduction in growth & survival Sensitive Species 10-25 NTU = Mortality
- 38. Bolin Creek from Randy Dodd
- 39. Overview of 2010 303(d) list Categories: Freshwater streams Lakes Salt Waters
- 40. Lake Impairment Parameters 2010 Impaired Freshwater Acres 14000 12000 10000 Fresh Water Acres 8000 6000 4000 2000 0 Turbidity High pH Chlorophyll a
- 41. Stream Parameters Impairment Fresh Water Miles 200 225 250 275 300 0 10 20 30 40 50 60 70 80 90 Arsenic Copper Zinc Ammonia Chloride NO2+NO3-N Turbidity Low Dissolved Oxygen Low pH Chlorophyll a Rec. Fecal Coliform Bacteria 2010 Impaired Freshwater Miles Biology-Bug Biology-Fish
- 42. Spec. Fecal C. NO2/ DO pH Cond. Turb. (Geomean) TN NH3 NO3-N TP mg/L μmhos/cm NTU cfu/100 ml mg/L mg/L mg/L mg/L CFR Basin Average 7.6 6.9 13.1 75 2.01 0.10 1.24 0.19 Haw – 3030002 8.4 7.3 277 16.7 108 2.90 0.09 2.15 0.24 Deep – 3030003 8.5 7.2 217 15.6 107 2.68 0.07 2.02 0.25 Middle CFR – 3030004 8.5 6.6 119 10.8 91 1.27 0.22 0.49 0.10 Lower CFR – 3030005 7.1 6.9 11.9 28 1.22 0.07 0.51 0.12 Black R – 3030006 6.4 6.1 110 4.5 70 1.07 0.04 0.25 0.11 Northeast CFR - 3030007 6.6 6.6 7.1 98 2.17 0.07 1.23 0.30 Healthy Piedmont Strm* 12-90 0.80 0.05 0.30 0.05 EPA Nutrient Criteria - Piedmont** 0.70 0.038 EPA Nutrient Criteria - Coastal** 0.72 0.032 * Information from ESS document. ** USGS Circular 1350 – The Quality of Our Nation’s Water – Nutrients in the Nation’s Streams and Groundwater, 1992-2004 Neil Dubrovskt et al., 2010.
- 43. 0303002 0303003 0303006 0303004 0303007 Fecal Coliform Bacteria 0303005 Standard assessed - 400 CFU/100 mL
Hinweis der Redaktion
- The Commission shall develop and implement a basinwide water quality management plan for each of the 17 major river basins in the State. In developing and implementing each plan, the Commission shall consider the cumulative impacts of all activities across a river basin and all point sources and nonpoint sources of pollutants, including municipal wastewater facilities, industrial wastewater systems, septic tank systems, stormwater management systems, golf courses, farms that use fertilizers and pesticides for crops, public and commercial lawns and gardens, atmospheric deposition, and animal operations.
- Narrative standards relate to biological criteria and aestheticsNumerical standards are applied to specific parameters such as dissolved oxygen, fecal coliform, etc.
- If no criteria is exceeded in a use support category then that AU is Supporting. If criteria are exceeded in a category then that AU is impaired. If there are data that are inconclusive for demonstrating whether or not a stream segment is impaired, then that segment is not rated. Where there are no data, no assessment is conducted and that segment is noted as having no data.Turbidity is:Measure of Suspended Matter in WaterMeasure of Light Scattered/Absorbed Nephelometric Turbidity Units (NTU)
- Important to note that Stormwater is not treated at the wastewater treatment plant.
- http://www.connectedwater.gov.au/processes/controlling.htmlIn many streams the majority of the steam is derived from baseflow throughout many times of the year especially during dry periods.
- Charlotte, Winston-Salem, Greensboro, High Point, Burlington, Triangle area (Chapel Hill, Durham, Raleigh)Making up the Urban piedmont stream assessment areas
- Point out – New Hope Creek and Northeast CreekJordan lakeHaw River Deep River
- Heavy sediment loadSmothers HabitatKills bugsTrout starve Can’t lay eggsStream dies
- Ecological/biological Community – Integrity impairmentNumber of Assessment units (stream segments of varying lengths) Impaired for a specific parameter.These include biological parameters – bugs and fishPhysical parameters – DO, pH, Temperature, Chemical – turbidity, chlorophyll a, nutrients, metals, toxicants
- Impairments based on Urban Stream GIS pull (from 2010 dataset; Cam McNutt Feb 2012)AUs and stream length counted multiple times for a segment if there were multiple impairments for different parameters.Cape Fear – 107 AU’s & 605 milesCatawba – 54 Aus & 377 milesNeuse – 70 Aus & 548 milesRoanoke – 5 Aus & 63 milesYadkin Pee-Dee - 84 Aus & 922 miles
- Fecal Coliform Bacteria is an indicator species – indicating that there are likely other harmful pathogens associated with human or animal waste present in the stream. The highest instream concentrations tend to be around urban centers.Standard is no more that 20% of the 5-in-30 samples greater than 400 cuf/100 mL
- Developed several management strategies for specific water bodies around the state. These Strategies include reducing runoff from new and existing development. TMDLs -Federal water quality restoration initiativeAddresses “impaired” waters (303(d) list)Requires calculating max. pollution load waterbody can assimilate without exceeding standardStates given timetable to complete (10 years)Eventually requires restoration plans and cleanupPhase I Program:Municipalities >100,000 peopleEleven Industrial CategoriesPhase II Program:May Impact 60 to 100 Small Local Governments
- Developed several management strategies for specific water bodies around the state. These Strategies include reducing runoff from new and existing development.
- Developed several management strategies for specific water bodies around the state. These Strategies include reducing runoff from new and existing development.
- 2012 Integrated Report – 303(d)/305(b) report – Draft (Feb 2012)RAMS data – Random Ambient Monitoring System – started in 2007, it is a component of DWQ’s Ambient Monitoring network. Is a probabilistic monitoring initiative where sampling locations are randomly located pm freshwater streams throughout the state. Monitored once per month for 2 years (29 stations throughout the state) . 2007-2008; 2009-2010; 2011-2012.Collectphysical parameters (DO, pH, Temp, Conductivity)No NutrientsChemical parameters include: alkalinity, chloride, fluoride, sulfate, Dissolved organic carbon, turbidity, total metals, dissolved metals, mercury and volatile organics.Collected every other month are; Cyanide, sulfide, semi-volatile organics, pesticides, and PCBs.These stations tend to occur in small streams where the normal ambient monitoring program focuses more on large rivers and areas of known problems.http://portal.ncdenr.org/web/wq/ess/eco/rams
- 2000 population density