SlideShare ist ein Scribd-Unternehmen logo
1 von 66
Downloaden Sie, um offline zu lesen
PAPER – 5 : ADVANCED MANAGEMENT ACCOUNTING

                                            QUESTIONS

Marginal Costing Vs. Absorption Costing
1.   During the current period, ABC Ltd sold 60,000 units of product at Rs. 30 per unit. At the
     beginning for the period, there were 10,000 units in inventory and ABC Ltd manufactured
     50,000 units during the period. The manufacturing costs and selling and administrative
     expenses were as follows:
                                               Total cost   Number of units         Unit cost
                                                     Rs.                                 Rs.
     Beginning inventory:
          Direct materials                       67,000             10,000              6.70
          Direct labour                         1,55,000            10,000             15.50
          Variable factory overhead              18,000             10,000              1.80
          Fixed factory overhead                 20,000             10,000              2.00
          Total                                 2,60,000                               26.00
     Current period costs:
          Direct materials                      3,50,000            50,000              7.00
          Direct labour                         8,10,000            50,000             16.20
          Variable factory overhead              90,000             50,000              1.80
          Fixed factory overhead                1,00,000            50,000              2.00
          Total                                13,50,000                               27.00
     Selling and administrative expenses:
          Variable                               65,000
          Fixed                                  45,000
          Total                                 1,10,000
     Instructions:
     1.   Prepare an income statement based on the variable costing concept.
     2.   Prepare an income statement based on the absorption costing concept.
     3.   Give the reason for the difference in the amount of income from operations in 1 and
          2.
Profitability Analysis, Flexible Budget and Marginal Costing
2.   A budgeted profit statement of a company working at 75% capacity is provided to you
2


     below,
     Sales         9,000 units at Rs. 32                                          Rs. 2,88,000
     Less:         Direct materials                                  Rs. 54,000
                   Direct wages                                         72,000
                   Production overhead:
                    fixed                                               42,000
                    variable                                            18,000
                                                                                      1,86,000
                   Gross profit                                                       1,02,000
     Less:         Administration, selling and distribution costs:
                    fixed                                               36,000
                    varying with sales volume                           27,000
                                                                                        63,000
                   Net profit                                                           39,000
     You are required to:
     (a) Calculate the breakeven point in units and in value.
     (b) It has been estimated that:
             (i)   if the selling price per unit were reduced to Rs. 28, the increased demand
                   would utilise 90% of the company's capacity without any additional advertising
                   expenditure, and
             (ii) to attract sufficient demand to utilise full capacity would require a 15%
                  reduction in the current selling price and a Rs. 5,000 special advertising
                  campaign.
                   You are required to present a statement showing the effect of the two
                   alternatives compared with the original budget and to advise management
                   which of the three possible plans ought to be adopted, i.e., the original budget
                   plan or (i) above or (ii) above.
     (c) An independent market research study shows that by spending Rs. 15,000 on a
         special advertising campaign, the company could operate at full capacity and
         maintain the selling price at Rs. 32 per unit.
     You are required to:
     (i)     Advise management whether this proposal should be adopted.
CVP Analysis
3.   (a) ABC Ltd. expects to maintain the same inventories at the end of the year as at the
         beginning of the year. The estimated fixed costs for the year are Rs. 2,88,000, and
3


          the estimated variable costs per unit are Rs. 14. It is expected that 60,000 units will
          be sold at a price of Rs. 20 per unit. Maximum sales within the relevant range are
          70,000 units.
          Instructions:
          1.    What is (a) the contribution margin ratio and (b) the unit contribution margin?
          2.    Determine the break-even point in units.
          3.    What is the margin of safety?
Standard Costing
     (b) Garland Company uses a standard cost system. The standard for each finished unit
         of product allows for 3 kgs of plastic at Rs. 0.72 per kg. During December, Garland
         bought 4,500 kgs of plastic at Rs. 075 per kg, and used 4,100 kgs in the production
         of 1,300 finished units of product. What is the material purchase price variance for
         the month of December ?
Budget: Functional Budgets
4.   Selected information concerning sales and production for ABC Ltd. for July, 2006 are
     summarised as follows:
     a.   Estimated sales:
          Product K: 40,000 units at Rs. 30.00 per unit
          Product L: 20,000 units at Rs. 65.00 per unit
     b.   Estimated inventories, July 1, 2006:
                                                                                                  Rs.
          Material A: 4,000 kgs.     Product K: 3,000 units at Rs. 17 per unit                 51,000
          Material B: 3,500 kgs.     Product L: 2,700 units at Rs. 35 per unit                 94,500
                                     Total                                                   1,45,500
          There were no work in process inventories estimated for July 1, 2006.
     c.   Desired inventories at July 31, 2006:
                                                                                                  Rs.
          Material A: 3,000 kgs.     Product K: 2,500 units at Rs. 17 per unit                 42,500
          Material B: 2,500 kgs.     Product L: 2,000 units at Rs. 35 per unit                 70,000
                                     Total                                                   1,12,500
          There were no work in process inventories desired for July 31, 2006.
     d.   Direct materials used in production:
                                               Product K                            Product L
          Material A:                       0.7 kgs. per unit                    3.5 kgs. per unit
          Material B:                       1.2 kgs. per unit                    1.8 kgs. per unit
4


     e.   Unit costs for direct materials:
          Material A:                             Rs. 4.00 per kg.
          Material B:                             Rs. 2.00 per kg.
     f.   Direct labour requirements:
                                               Department 1                      Department 2
          Product K                           0.4 hour per unit                0.15 hour per unit
          Product L                           0.6 hour per unit                0.25 hour per unit
     g.                                        Department 1                      Department 2
          Direct labour rate                 Rs. 12.00 per hour               Rs. 16.00 per hour
     h.   Estimated factory overhead costs for July:
                                                                                                Rs.
          Indirect factory wages                                                           2,00,000
          Depreciation of plant and equipment                                               40,000
          Power and light                                                                   25,000
          Indirect materials                                                                34,000
          Total                                                                            2,99,000
          Instructions:
          1.      Prepare a sales budget for July.
          2.      Prepare a production budget for July.
          3.      Prepare a direct materials purchases budget for July.
          4.      Prepare a direct labour cost budget for July.
          5.      Prepare a cost of goods sold budget for July.
Standard Costing: Material, Labour and Factory Overhead Variance
5.   ABC Ltd. manufactures Product S for national distribution in India. The standard costs for
     the manufacture of Product S were as follows:
                                         Standard Costs                         Actual Costs
     Direct materials       1,500 kgs at Rs. 35                           1,600 kgs at Rs. 32
     Direct labour          4,800 hours at Rs. 11                         4,500 hours at Rs. 11.80
     Factory overhead       Rates per labour hour, based on 100% of
                            normal capacity of 5,500 labour hours:
                            Variable cost, Rs. 2.40                       Rs. 12,300 variable cost
                            Fixed cost, Rs. 3.50                          Rs. 19,250 fixed cost
5


     Instructions:
     1.   Determine the quantity variance, price variance, and total direct materials cost
          variance for Product S.
     2.   Determine the time variance, rate variance, and total direct labour cost variance for
          Product S.
     3.   Determine the controllable variance, volume variance, and total factory overhead
          cost variance for Product S.
Standard Costing and Reconciliation
6.   ABC Ltd. uses flexible budgets and standard costing for its single product PCM 30
     produced at its factory at Solan. The following details relate to a particular months
     ‘Actual’ & also provide brief details of ‘Standards’ established,
     Standard Quantity required for producing 1 unit of PCM 30         3 Kgs
     Standard cost of the raw material                                 Rs 4.40 per kg
     Cost of actual material purchased and used in the relevant        Rs 3,36,000
          month
     Actual price paid for the raw material in the relevant month      Rs 4.20 per kg
     Standard labour time required to produce 1 unit of PCM 30         30 minutes
     Standard wage rate                                                Rs 5 per hour
     Actual wage rate                                                  Rs 5.40 per hour
     Sufficient direct labour time, equivalent for producing 28,000 units of PCM 30 was
     utilised, although the actual production in the relevant month was only 25,000 units.
     The company has a normal operating capacity of 15,000 hours per month and flexible
     overhead budgets are:
      Hours of operation                             12,500          14,000             15,000
      Variable production overhead             Rs. 1,50,000    Rs. 1,68,000      Rs. 1,80,000
      Fixed production overhead                    2,70,000         2,70,000           2,70,000
      Total                                        4,20,000         4,38,000           4,50,000
     Actual fixed overheads incurred did not deviate from the budgeted amounts. However,
     the variable overheads incurred amounted to Rs 1,60,000 in the concerned month.
     You are required to calculate the appropriate variances for material, labour and
     overhead;
Target Costing
7.   You are the manager of a paper mill (XYZ Ltd) and have recently come across a
     particular type of paper, which is being sold at a substantially lower rate (by another
     company –ABC Ltd) than the price charged by your own mill. The value chain for one use
6


     of one tonne of such paper for ABC Ltd is as follows,
     ABC Ltd.                Merchant           Printer         Customer
     ABC Ltd sells this particular paper to the merchant at the rate of Rs 1,466 per tonne.
     ABC Ltd pays for the freight which amounts to Rs 30 per tonne. Average returns and
     allowances amount to 4% of sales and approximately equals Rs 60 per tonne.
     The value chain of your company, through which the paper reaches the ultimate
     customer is similar to the one of ABC Ltd. However, your mill does not sell directly to the
     merchant, the latter receiving the paper from a huge distribution center maintained by
     your company at Haryana. Shipment costs from the mill to the Distribution Center amount
     to Rs 11 per tonne while the operating costs in the Distribution Center have been
     estimated to be Rs 25 per tonne. The return on investments required by the Distribution
     Center for the investments made amount to an estimated Rs. 58 per tonne.
     You are required to compute the “Mill manufacturing Target Cost” for this particular paper
     for your company. You may assume that the return on the investment expected by your
     company equals Rs. 120 per tonne of such paper.
Differential Costing
8.   ABC Ltd recently began production of a new product, M, which required the investment of
     Rs. 16,00,000 in assets. The costs of producing and selling 80,000 units of Product M
     are estimated as follows:
                                                                               Rs.
     Variable costs:
          Direct materials                                                   10.00 per unit
          Direct labour                                                        6.00
          Factory overhead                                                     4.00
          Selling and administrative expenses                                  5.00
     Total                                                                   25.00 per unit
     Fixed costs:
          Factory overhead                                                 8,00,000
          Selling and administrative expenses                              4,00,000

     ABC Ltd is currently considering establishing a selling price for Product M. The
     President of ABC Ltd has decided to use the cost-plus approach to product pricing and
     has indicated that Product M must earn a 10% rate of return on invested assets.
     Instructions:
     1.      Determine the amount of desired profit from the production and sale of Product M.
     2.      Assuming that the total cost concept is used, determine (a) the cost amount per
7


          unit, (b) the markup percentage, and (c) the selling price of Product M.
     3.   Assuming that the product cost concept is used, determine (a) the cost amount per
          unit, (b) the mark up percentage, and (c) the selling price of Product M.
     4.   Assuming that the variable cost concept is used, determine (a) the cost amount per
          unit, (b) the markup percentage, and (c) the selling price of Product M.
     5.   Assume that for the current year, the selling price of Product M was Rs. 42 per unit.
          To date, 60,000 units have been produced and sold, and analysis of the domestic
          market indicates that 15,000 additional units are expected to be sold during the
          remainder of the year. Recently, ABC Ltd received an offer from XYZ Ltd for 4,000
          units of product M at Rs. 28 each. XYZ Ltd. will market the units in Korea under its
          own brand name, and no additional selling and administrative expenses associated
          with the sale will be incurred by ABC Ltd. The additional business is not expected
          to affect the domestic sales of Product M, and the additional units could be
          produced during the current year, using existing capacity. (a) Prepare a differential
          analysis report of the proposed sale to XYZ Ltd (b) Based upon the differential
          analysis report in (a), should the proposal be accepted?
CVP Analysis and Decision Making
9.   ABC Ltd. manufactures three prototype toy furniture products – chairs, benches and
     tables. The budgeted unit cost and resource requirements of each item is detailed
     below:
                                                       Chair           Bench            Table
                                                         Rs.              Rs.             Rs.
     Timber cost                                        5.00            15.00           10.00
     Direct labour cost                                 4.00            10.00            8.00
     Variable overhead cost                             3.00             7.50            6.00
     Fixed overhead cost                                4.50            11.25            9.00
                                                       16.50            43.75           33.00
     Budgeted volumes per annum                        4,000            2,000           1,500
     These volumes are believed to equal the market demand for these products.
     The fixed overhead costs are attributed to the three products on the basis of direct labour
     hours.
     The labour rate is Rs. 4.00 per hour.
     The cost of the timber is Rs. 2.00 per square metre.
     The products are made from a specialist timber. A memo from the purchasing manager
     advises you that because of a problem with the supplier, it is to be assumed that this
     specialist timber is limited in supply to 20,000 square metres per annum.
     The sales manager has already accepted an order for 500 chairs, 100 benches and 150
     tables which if not supplied would incur a financial penalty of Rs. 2,000. These quantities
8


     are included in the market demand estimates above.
     The selling prices of the three products are:
                                                                                                Rs.
     Chair                                                                                    20.00
     Bench                                                                                    50.00
     Table                                                                                    40.00


     Requirements:
     (a) Determine the optimum production plan and state the net profit that this should yield
         per annum.
     (b) Calculate and explain the maximum prices which should be paid per square metre
         in order to obtain extra supplies of the timber.
Pricing Decisions
10. ABC Ltd is in the business of publishing, printing and distributing a range of catalogues
    and other manuals. The management have now decided to discontinue printing and
    distribution and concentrate solely on publishing. Instead of ABC Ltd, XYZ Ltd shall now
    print and distribute the range of catalogues and other manuals. This shall be done on
    behalf of ABC Ltd . commencing either at 30 June 2007 or 30 November, 2007. XYZ Ltd
    will receive Rs. 65,000 per month for a contract which will commence either at 30 June,
    2007 or 30 November 2007.
     The results of ABC Ltd for a typical month are as follows:
                                                       Publishing       Printing       Distribution
                                                         Rs. ’000       Rs. ’000          Rs. ’000
     Salaries and wages                                         28             18                 4
     Materials and supplies                                    5.5             31               1.1
     Occupancy costs                                             7            8.5               1.2
     Depreciation                                              0.8            4.2               0.7
     Information related to the possible closure proposals is as follows:
     (i)     Two specialist staff from printing will be retained at their present salary of Rs. 1,500
             each per month in order to fulfill a link function with XYZ Ltd One further staff
             member will be transferred to publishing to fill a staff vacancy through staff turnover,
             anticipated in July. This staff member will be paid at his present salary of Rs. 1,400
             per month which is Rs. 100 more than that of the staff member who is expected to
             leave. On closure all other printing and distribution staff will be made redundant
             and paid an average of two months redundancy pay.
     (ii) The printing department has a supply of materials (already paid for) which cost Rs.
          18,000 and which will be sold to XYZ Ltd. for Rs. 10,000 if closure takes place on
          30 June, 2007. Otherwise the material will be used as part of the July 2007 printing
9


          requirements. The distribution department has a contract to purchase pallets at a
          cost of Rs. 5000 per month for July and August, 2007. A cancellation clause allows
          for non-delivery of the pallets for July and August for a one-off payment of Rs. 300.
          Non-delivery for August only will require a payment of Rs. 100. If the pallets are
          taken from the supplier, XYZ Ltd has agreed to purchase them at a price of Rs. 380
          for each month’s supply which is available. Pallet costs are included in the
          distribution material and supplies cost stated for a typical month.
     (iii) Company expenditure on apportioned occupancy costs to printing and distribution
           will be reduced by 15% per month if printing and distribution departments are
           closed. At present, 30% of printing and 25% of distribution occupancy costs are
           directly attributable costs which are avoidable on closure, whilst the remainder are
           apportioned costs.
     (iv) Closure of the printing and distribution departments will make it possible to sub–let
          part of the building for a monthly fee of Rs. 2,500 when space is available.
     (v) Printing plant and machinery has an estimated net book value of Rs. 48,000 at 30
         June, 2007. It is anticipated that it will be sold at a loss of Rs. 21,000 on 30 June,
         2007. If sold on 30 November, 2007 the prospective buyer will pay Rs. 25,000.
     (vi) The net book value of distribution vehicles at 30 June, 2006 is estimated as Rs.
          80,000. They could be sold to the original supplier at Rs. 48,000 on 30 June, 2006.
          The original supplier would purchase the vehicles on 30 November, 2006 for a price
          of Rs. 44,000.
     Required:
     Using the above information, prepare a summary to show whether ABC Ltd. should close
     the printing and distribution departments on financial grounds on 30 June, 2006 or on 30
     November, 2006. Explanatory notes and calculations should be shown. Ignore taxation.
11. (a) Describe the concept of Back flushing as used in a JIT system. What problems need
        to be addressed before implementing such a concept? Briefly discuss.
     (b) “Skimming pricing is a policy where the prices are kept high during the early period
         of a product’s existence”. Discuss briefly the reasons for following such a policy.
12. Discuss briefly your understanding of a Balanced Scorecard? What are its advantages ?
13. (a) "Costs may be classified in a variety of ways according to their nature and the
        information needs of the management." Explain.
     (b) Indicate the major areas of short-term decisions in which differential cost analysis is
         useful.
     (c) "Relevant cost analysis helps in drawing the attention of managers to those
         elements of cost which are relevant for the decision." Comment.
14. (a) Indicate the possible disadvantages of treating divisions as profit centres
     (b) Explain the role of bench marking in continuous improvement in an organisation.
10


Cost Sheet and Standard Costing
15. ABC Ltd manufactures a product ‘1+7 ASCS’ at its plant at Faridabad, the maximum
    capacity of which is 200 units per month. Details of raw material which go into the making
    of 1 unit of ‘1+7 ASCS’ are provided to you below;
         S. No.           Raw Material         Standard quantity per    Standard purchase
                           description           finished unit (No)    price per unit (Rs 00)
            1                   A                        1                       6
            2                   B                        2                       5
            3                   C                        3                       4
            4                   D                        4                       3
            5                   E                        5                       2
            6                   F                        6                       1
     Standard Fixed overheads are Rs 20,00,000 per month whereas the standard variable
     overhead rate has been estimated as equal to Rs 1,400 per unit of finished good. You
     are required to compute the
     (a) standard cost of the product
     (b) compute the production volume variance in case the company produces and sells
         only 100 units of finished goods in the concerned month.
     (c) compute the usage and material price variances considering the following actual
         data(actual production and sale: 100 units)
          Raw material description       Actual quantity consumed       Actual price(Rs 00)
                                                   (Nos)
                     A                             102                          7
                     B                             201                          6
                     C                             310                          5
                     D                             415                          4
                     E                             540                          3
                     F                             610                          2
16. (a) Explain the concept ‘Learning curve’. How can it be applied for Cost management?
Profitability Analysis and Learning Curve
     (b) An electronics firm which has developed a new type of fire-alarm system has been
         asked to quote for a prospective contract. The customer requires separate price
11


         quotations for each of the following possible orders:
         Order                                                     Number of fire-alarm systems
         First                                                     100
         Second                                                    60
         Third                                                     40
        The firm estimates the following cost per unit for the first order:
         Direct materials                                     Rs. 500
         Direct labour
          Deptt. A (Highly automatic) 20 hours at Rs. 10 per hour
          Deptt. B (Skilled labour) 40 hours at Rs. 15 per hour
         Variable overheads                                   20% of direct labour
         Fixed overheads absorbed:
         Deptt. A                                             Rs. 8 per hour
         Deptt. B                                             Rs. 5 per hour
         Determine a price per unit for each of the three orders, assuming the firm uses a
         mark up of 25% on total costs and allows for an 80% learning curve. Extract from
         80% Learning curve table:
         X        1.0      1.3     1.4       1.5     1.6     1.7         1.8     1.9     2.0
         Y%       100.0    91.7    89.5      87.6    86.1    84.4        83.0    81.5    80.0

         X represents the cumulative total volume produced to date expressed as a multiple
         of the initial order.
         Y is the learning curve factor, for a given X value, expressed as a percentage of the
         cost of the initial order.
Cost Sheet and Reporting
17. Jimmedar Works ltd has at the factory three Production Departments, Machine Shop,
    Fabrication and Assembly which are the responsibility of the shop Superintendent. The
    Shop Superintendent along with Materials Manger, Planning Superintendent and
    Maintenance Engineer Report to the Works Manager at the factory. The office
    administration, sales and publicity come under the Sales Manager who along with the
    Works Manger report to the Managing Director of the company. The following data
    relating to a month’s performance are called out from the books of the company.
                                                     Budget (Rs.)               Variance from Budget
    Sales commission                                         800                           Rs. 50 A
    Raw Material and Components – Machine shop               900                                 20 A
    Publicity Expenses                                      1100                                100 A
12


    Printing and Stationery                             3200                           200 F
    Travelling expenses                                 4000                           200 A
    Wages – Machine shop                                 800                            10 F
            – Fabrication                                600                            20 A
            – Assembly                                   720                            10 A
    Material – Assembly                                  760                            40 A
             – Fabrication                               460                            10 A
    Utilities – Assembly Shop                            320                            10 A
             – Assembly                                  470                            60 F
             – Fabrication                               560                            30 F
             – Maintenance                               400                            20 A
             – Stores                                    210                            40 F
             – Planning                                  180                            20 A
    Shop Superintendent’s Office
             – Salaries and Expenses                    1100                            22 F
    Depreciation – Factory                              3880                            40 A
    Works Manager’s Office Expenses                     3810                            40 A
    General Office Salaries and Administration          4270                            30 A
    Managing Director’s Salary and Administration       2800                            20 F
                                                                (A = Adverse, F = Favourable)
    (i)   Treating the Machine Shop, Fabrication and Assembly as Cost Centres, prepare
          Cost Sheets for each centre with the help of the this additional information:
          The Shop Superintendent devotes his time amongst Machine Shop, Fabrication and
          Assembly in the ratio 4:3: 4. Other Factory Overheads are absorbed on the basis of
          Direct Labour in each Cost Centre. Office, Administration, Selling and Distribution
          Overheads are, borne equally by the Cost Centres.
    (ii) Treating the Machine Shop, Fabrication and Assembly as Responsibility Centres,
         prepare a Responsibility Accounting report for the Shop Superintendent.
Standard Costing
18. A company using a standard costing system furnishes the following statement showing
    the details relating to a month.
                                                                   Budget           Actual
    Product and sales volume in units                              10000              9000
    Selling price per unit                                       Rs.60.00            61.50
13


     Costs for the month:
     Direct materials                                               Rs.2,50,000          2,57,400
     Direct wages                                                   Rs.2,25,000          2,20,500
     Variable overheads                                              Rs.10,000              9,250
     Fixed overheads                                                 Rs.25,000             23,240
     Direct labour hours                                                 50,000            42,000
     Per unit data:
     Direct materials kg/unit                                                 25                26
     Direct materials price/ kg                                         Rs.1.00               1.10
     Direct labour hours / unit                                                5               4.5
     Direct labour rate / hour                                          Rs.4.50               5.25
    You are required to compute all variances and reconcile the budgeted profit with actual profit.
Relevant Costing
19. ABC Ltd has been approached by a customer who would like a special job to be done for
    him, and who is willing to pay Rs. 22,000 for it. The job would require the following
    materials.
     Material    Total units      Units already    Book value of        Realisable    Replacement
                   required             in stock   units in stock   value Rs. /unit    cost Rs./unit
                                                         Rs./unit
        A               1,000                 0                                                   6
        B               1,000               600                2              2.50                5
        C               1,000               700                3              2.50                4
       D               200            200                 4             6.00                 9
     Material B is used regularly by ABC Ltd, and if units of B are required for this job, they
     would need to be replaced to meet other production demand.
     Material C and D are in stock as the result of previous over-buying, and they have a
     restricted use. No other use could be found for material C, but the units of material D
     could be used in another job as substitute for 300 units of material E, which currently
     costs Rs. 5 per unit (of which the company has no units in stock at the moment).
     Calculate the relevant costs of material for deciding whether or not to accept the order.
Application of Cost Concept
20. ABC Ltd plans to use activity-based costing to determine it product costs. It presently,
    uses a single plantwide factory overhead rate for allocating factory overhead to products,
14


    based on direct labour hours. The total factory overhead cost is as follows:
                      Department                              Factory overhead
                                                                       Rs.
    Production Support                                               12,25,000
    Production (factory overhead only)                                1,75,000
    Total cost                                                       14,00,000
    The Company determined that it performed four major activities in the Production
    Support Department. These activities, along with their budgeted costs, are as follows:
             Production Support Activities                      Budgeted Cost
                                                                       Rs.
    Set up                                                            4,28,750
    Production control                                                2,45,000
    Quality control                                                   1,83,750
    Materials management                                              3,67,500
                         Total                                       12,25,000
    ABC Ltd estimated the following activity-base usage quantities and units produced for
    each of its three products:
    Products      Number of      Direct Labour   Setups Production     Inspections       Material
                      Units              hours             Orders                     requisitions
    Product K         10,000           25,000         80       80                35           320
    Product L          2,000           10,000         40       40                40           400
    Product M         50,000         1,40,000          5        5                0             30
    Total cost        62,000         1,75,000         125     125                75           750
    Instructions:
    1.   Determine the factory overhead cost per unit for Products K, L and M under the
         single plantwide factory overhead rate method. Use direct labor hours as the
         activity base.
    2.   Determine the factory overhead cost per unit for Products K, L and M under activity-
         based costing.
    3.   Which method provides more accurate product costing? Why?
Linear Programming
21. A firm manufactures two types of products A and B and sells them at a profit of Rs.2 on
    type A and Rs. 3 on type B. Each product is processed on 2 machines G and H. Type A
    requires 1 minute of processing time on G and 2 minutes on H. Type B requires 1 minute
15


     on G and 1 minute on H. The machine G is available for not more than 6 hours 40
     minutes, while machine H is available for 10 hours during any working day. Formulate
     the problem as a L.P.P. and solve by using graphical method.
Linear Programming
22. Using simplex method to solve the following L.P.P.
     Max Z = x1 + 2x2 + 3x3 – x4
     Subject to
                   x1 + 2x2 + 3x3 = 15
                   2x1 + x2 +5x3 = 20
                   x1 + 2x2 + x3 + x4 = 10
                   x1 , x2 , x3 , x4 > 0.
Transportation Problem
23. Solve the following transportation problem.
                         1             2             3           4     5    Stock available
               1         73            40            9           79    20            8
               2         62            93            96          8     13            7
               3         96            65            80          50    65            9
               4         57            58            29          12    87            3
               5         56            23            87          18    12            5
       Demand            6             8             10          4     4
The Assignment Problem
24. A company is faced with the problem of assigning six different machine to 5 different
    jobs. The cost are estimated as follows (hundred of rupees).
                                            Jobs
     Machine                      1             2               3      4     5
                          1      2.5            5               1      6     1
                          2       2             5              1.5     7     3
                          3       3            6.5              2      8     3
                          4      3.5            7               2      9    4.5
                          5       4             7               3      9     6
                          6       6             9               5     10     6
     Solve the problem assuming that the objective is to minimize total cost.
16


Critical Path Analysis and PERT
25. The project has the following characteristics.
                Activity                   Preceding Activity           Expected Completion Time
                                                                               (in weeks)
                   A                             None                               5
                   B                                  A                             2
                   C                                  A                             6
                   D                                  B                            12
                   E                                  D                            10
                   F                                  D                             9
                  G                                   D                             5
                   H                                  B                             9
                   I                              C, E                              1
                   J                               G                                2
                   K                             F, I, J                            3
                   L                                  K                             9
                  M                               H, G                              7
                   N                               M                                8
     (a) Draw a PERT network for this project.
     (b) Find the critical path and the project completion time.
     (c) Prepare on activity schedule showing ES, EF, LS, LF, and slack for each activity.
     (d) Will the critical path change if activity G takes 10 weeks instead of 5 weeks? If so,
         what will be the new critical path?
Critical Path Analysis and PERT
26. A project consists of nine activities whose time estimates (in weeks) and other
    characteristics are given below.
     Activity              Preceding                         Time estimates (weeks)
                           activity(ies)   Most optimistic      Most likely      Most pessimistic
            A                       –             2                     4               6
            B                       –             6                     6               6
            C                       –             6                    12              24
            D                      A              2                     5               8
            E                      A             11                    14              23
            F                     B, D            8                    10              12
17


             G                 B, D                   3                         6                  9
             H                 C, F                   9                        15                 27
             I                  E                     4                        10                 16
     (i)   Show the PERT network for the project.
     (ii) Identify the critical activities.
     (iii) What is the expected project completion time and its variance?
Simulation
27. An investment company wants to study the investment projects based on market
    demand, profit and the investment required, which are independent of each other.
    Following probability distributions are estimated for each of these three factors:
     Annual demand                 25         30          35        40         45          50          55
     (Units in thousands)
     Probability                   0.05       0.10        0.20      0.30       0.20        0.10        0.05
     Profit per Unit               3.00       5.00        7.00      9.00       10.00
     Probability                   0.10       0.20        0.40      0.20       0.10
     Investment required (in 2750             3000        3500
     thousands of Rupees)
     Probability                   0.25       0.50        0.25
     Using simulation process, repeat the trial 10 times, compute the investment on each trial
     taking these factors into trial what is the most likely return?
     Use the following random numbers:
     (30, 12, 16);     (59, 09, 69);      (63, 94, 26);        (27, 08, 74);
     (64, 60, 61);     (28, 28, 72);      (31, 23, 57);        (54, 85, 20);
     (64, 68, 18);     (32, 31, 87).
     In the bracket above, the first random number is for annual demand, the second one is
     for profit and the last one is for the investment required.
Time Series Analysis and Forecasting
28. Below are given the figures of production (in thousand quintals) of a sugar factory.
                          Year                                                 Production
                                                                           (thousand quintals)
                          1993                                                        77
                          1995                                                        88
                          1996                                                        94
18


                         1997                                            85
                         1998                                            91
                         1999                                            98
                         2002                                            90
     (i)   Fit a straight line by the 'least squares' method and tabulate the trend values.
     (ii) Eliminate the trend. What components of the series are thus left over?
     (iii) What is monthly increase in the production of sugar?
Time Series Analysis and Forecasting
29. Calculate 5 yearly and 7 yearly moving averages for the following data of the numbers of
    commercial and industrial failure in a country during 1987 to 2002.
                         Year                                      No. of failures
                         1987                                            23
                         1988                                            26
                         1989                                            28
                         1990                                            32
                         1991                                            20
                         1992                                            12
                         1993                                            12
                         1994                                            10
                         1995                                             9
                         1996                                            13
                         1997                                            11
                         1998                                            14
                         1999                                            12
                         2000                                             9
                         2001                                             3
                         2002                                             1
     Also plot the actual and trend values on a graph.
Testing of Hypothesis (chi – square – test)
30. The contingency table below summarize the results obtained in a study conducted by a
    research organization with respect to the performance of four competing brands of tooth
    paste among the users
19


                         Brand A            Brand B          Brand C     Brand D            Total
     No. of Cavities         9                13                17          11               50
     One of five            63                70                85          82              300
     More than five         28                37                48          37              150
     Total                 100                120              150         130              500
     Test the hypothesis that incidence of cavities is independent of the brand of the tooth paste
     used. Use level of significance 1% and 5%.
Testing of Hypothesis (ANOVA)
31. Below are given the yield (in kg.) per acre for 5 trial plots of 4 varieties of treatment.
    Carry out an analysis of variance and state conclusion
                                                             Treatment
     Plot no.           1                     2                    3                 4
     1                  42                    48                   68                80
     2                  50                    66                   52                94
     3                  62                    68                   76                78
     4                  34                    78                   64                82
     5                  52                    70                   70                66
Testing of Hypothesis (t – test)
32. The sales data of an item in six shops before and after a special promotional compaign
    are as under
     Shops                  A           B               C           D     E                 F
     Before Compaign        53          28              31          48    50                42
     After Compaign         58          29              30          55    56                45
     Can the compaign be judged to be a success?
     Test at 5% level of significance using t-test.

                                SUGGESTED ANSWERS/HINTS

1.   Variable Costing Income Statement
                                                                               Rs.               Rs.
     Sales (60,000 Rs. 30)                                                                18,00,000
     Variable cost of goods sold:
          Beginning inventory (10,000       Rs. 24)                      2,40,000
20


           Variable cost of goods manufactured (50,000 Rs. 25)        12,50,000
           Variable cost of goods sold                                               14,90,000
     Manufacturing margin                                                             3,10,000
     Variable selling and administrative expenses                                       65,000
     Contribution margin                                                              2,45,000
     Fixed Costs:
           Fixed manufacturing costs                                   1,00,000
           Fixed selling and administrative expenses                     45,000       1,45,000
     Income from operations                                                           1,00,000
                             Absorption Costing Income Statement
                                                                             Rs.          Rs.
     Sales (60,000 Rs. 30)                                                           18,00,000
     Cost of goods sold:
           Beginning inventory (10,000    Rs. 26)                       2,60,000
           Cost of goods manufactured (50,000 Rs. 27)                  13,50,000
           Cost of goods sold                                                        16,10,000
     Gross profit                                                                     1,90,000
     Selling and administrative expenses (Rs. 65,000 + Rs. 45,000)                    1,10,000
     Income from operations                                                            80,000
2.   (a)                   Contribution and Profitability Analysis
                                                                             Total      Per unit
           Sales*                                                    Rs. 2,88,000        Rs. 32
           Less:           Variable costs
                           Direct material               54,000                               6
                           Direct wages                  72,000                               8
                           Production Overheads          18,000                               2
                           Admn, S & D OH                27,000                               3
                                                                         1,71,000            19
           Contribution                                                  1,17,000            13
           Less:           Fixed Overheads
                           Production                    42,000
                           Admn, S & D                   36,000
                                                                          78,000
                           Net Profit                                     39,000
           *Capacity utilisation: 75%
           P/V Ratio =     (S – V)/S     100 = 40.625%
21


           BE Sales =         Fixed costs    P/V Ratio
                              =     78,000    40.625%
                              =     Rs. 1,92,000
           or 1,92,000      Rs. 32       = 6,000 Units
     (b)   Production                                          90% Capacity          100% Capacity
                                                               (10,800 Units)         (12,000 Units)
           Selling price per unit                                     Rs. 28               Rs. 27.20
           Variable cost per unit                                           19                19.00
           Contribution per unit                                             9                    8.20
           P/V Ratio                                                32.143%                30.147%
           Total contribution                                         97,200                 98,400
           Less Fixed Overheads                                       78,000                 83,000
                                                                      19,200                 15,400

           The P/V Ratio has gone down to 32.143% in the case of alternative b(i) and to
           30.147% in alternative b(ii). Therefore the company should follow the original plan
           as at (a) above
     (c) (i)    Selling price per unit                                                      Rs. 32
                Less Variable costs                                                               19
                Contribution per unit                                                             13
                Total contribution (12,000 Rs 13)                                         1,56,000
                Less: fixed costs                                                           93,000
                Profit                                                                      63,000
                This proposal may be expected as there is a considerable increase in the
                profits.
                                                     Sales Variable costs
3.   (a) 1.     (a)      Contribution margin ratio
                                                           Sales
                                                     (60,000 units Rs. 20) (60,000 units Rs. 14)
                         Contribution margin ratio
                                                                 (60,000 units Rs. 20)

                                                     Rs. 1,2 0,000 Rs. 8,40,000   Rs. 3,60,000
                         Contribution margin ratio
                                                             Rs. 12,00,000        Rs. 12,00,000
                       Contribution margin ratio = 30%
                (b) Unit contribution margin = Unit selling price – Unit variable costs
                       Unit contribution margin = Rs. 20 – Rs. 14 = Rs. 6
22


                                                      Fixed costs
           2.      Break - even sales (units)
                                                Unit contribution margin

                                                Rs. 2,88 ,000
                   Break - even sales (units)                   48,000 units
                                                    Rs. 6

           3.   Margin of safety:
                                                                                                   Rs.
                Expected sales (60,000 units         Rs. 20)                                 12,00,000
                Break-even point (48,000 units Rs. 20)                                        9,60,000
                Margin of safety                                                              2,40,000
                                                    Or
                                      Sales Sales at break - even point
                   Margin of safety
                                                  Sales
                                       Rs. 2,40 ,000
                   Margin of safety                  20%
                                       Rs. 12,00,000
     (b)        (Standard price – actual price) × number of kgs purchased
                (Rs 0.72 – 0.75) × 4,500 kgs = Rs 135 unfavourable
4.   1.                                             ABC Ltd
                                            Sales Budget
                                  for the Month ending July 31, 2006
           Product                              Unit Sales      Unit Selling Price          Total Sales
                                                  Volume
                                                                               Rs.                 Rs.
           Product K                               40,000                    30.00           12,00,000
           Product L                               20,000                    65.00           13,00,000
           Total revenue from sales                                                          25,00,000

     2.                                            ABC Ltd.
                                             Production Budget for
                                         the Month ending July 31, 2006
                                                                                    Units
                                                                      Product K               Product L
           Sales                                                           40,000               20,000
           Plus desired inventories at July 31, 2006                        2,500                2,000
23


     Total                                                                 42,500                    22,000
     Less: Estimated inventories, July 1, 2006                              3,000                     2,700
     Total production                                                      39,500                    19,300

3.                                                  ABC Ltd
                             Direct Materials Purchases Budget
                             for the Month ending July 31, 2006
                                                                Direct Materials
                                                              Material A      Material B                Total
     Units required for production:
             Product K (39,500    lbs. per unit)           27,650 kgs*          47,400 *
             Product L (19,300    lbs. per unit)          67,550 kgs**         34,740 **
     Plus desired units of inventory
             July 31, 2006                                        3,000              2,500
     Total                                                 98,200 kgs.       84,640 kgs,
     Less estimated units of inventory
             July 1, 2006                                         4,000              3,500
     Total units to be purchased                           94,200 kgs.       81,140 kgs.
     Unit price                                            .... ......             .........
                                                            .....Rs.4.00           Rs.2.00      ___________
     Total direct materials purchases                     Rs. 3,76,800      Rs. 1,62,280         Rs. 5,39,080

     *27,650 = 39,500        0.7            47,400 = 39,500        1.2
     **67,550 = 19,300           3.5        34,740 = 19,300        1.8
4.                                            ABC Ltd
                                      Direct Labour Cost Budget
                             for the Month ending July 31, 2006
                                                         Department 1      Department 2               Total
     Hours required for production:
             Product K (39,500    hours per unit)              15,800*             5,925*
             Product L (19,300    hours per unit)             11,580**             4,825**
             Total                                             27,380              10,750
     Hourly rate                                              Rs.12.00         Rs.16.00
     Total                                                Rs.3,28,560       Rs.1,72,000        Rs. 5,00,560

     *15,800 = 39,500        0.4            5,925 = 39,500        0.15
     **11,580 = 19,300           0.6        4,825 = 19,300        0.25
24


     5.                                               ABC Ltd
                                             Cost of Goods sold Budget
                                         for the Month ending July 31, 2006
                                                                                      Rs.         Rs.
          Finished goods inventory, July 1, 2006                                             1,45,500
          Direct materials:
               Direct materials inventory, July 1, 2006 (Note A)               23,000
               Direct materials purchases                                    5,39,080
               Cost of direct materials available for use                    5,62,080
               Less: Direct materials inventory, July 31, 2006 (Note B)        17,000
               Cost of direct materials placed in production                 5,45,080
          Direct labour                                                      5,00,560
          Factory overhead                                                   2,99,000
          Cost of goods manufactured                                                        13,44,640
          Cost of finished goods available for sale                                         14,90,140
          Less: Finished goods inventory, July 31, 2006                                      1,12,500
          Cost of goods sold                                                                13,77,640

          Note A:                                                                                Rs.
          Material A                   4,000 kgs.               at Rs. 4.00 per kg.           16,000
          Material B                   3,500 kgs.               at Rs. 2.00 per kg.            7,000
          Direct materials inventory, July 1, 2006                                            23,000


          Note B:                                                                                Rs.
          Material A                   3,000 kgs.              at Rs. 4.00 per kg.            12,000
          Material B                   2,500 kgs.              at Rs. 2.00 per kg.             5,000
          Direct materials inventory, July 31, 2006                                           17,000

5.   1.                         Direct Materials Cost Variance
          Quantity Variance:
          Actual quantity                                             1,600 kgs
          Standard quantity                                            1500 kgs
          Variance – unfavourable                     100 kgs × Std price, Rs 35            Rs. 3,500
          Price Variance:
          Actual price                                         Rs. 32.00 per kg
25


          Standard price                                                     35
          Variance – favourable             Rs(300) per kg × Actual Qty, 1600              (4,800)
          Total direct materials cost variance - favourable                             Rs. (1,300)


     2.                              Direct Labour Cost Variance
          Time Variance:
          Actual time                                                 4,500 hours
          Standard time                                               4,800 hours
          Variance – favourable                      (300 hours) × Std rate, Rs 11      Rs. (3,300)
          Rate Variance:
          Actual rate                                                   Rs. 11.80
          Standard rate                                                     11.00
          Variance – unfavourable       Rs 0.80 per hr × Actual time, 4500 hours             3,600
          Total direct labour cost variance - unfavourable                                Rs. 300
     3.                              Factory Overhead Cost Variance
          Variable factory overhead – controllable variance:
             Actual variable factory overhead cost incurred                Rs. 12,300
             Budgeted variable factory overhead for 4,800                     11,520*
             hours
             Variance – unfavourable                                                       Rs. 780
          Fixed factory overhead – volume variance:
             Budgeted hours at 100% of normal capacity                    5,500 hours
             Standard hours for actual production                         4,800
             Productive capacity not used                                   700 hours
             Standard fixed factory overhead cost rate                 Rs. 3.50 hours
             Variance – unfavourable                                                         2,450
          Total factory overhead cost variance – unfavourable                            Rs. 3,230


          *4,800 hours     Rs. 2.40 = Rs. 11,520
6.   Standard Variable O.H. rate       = Rs. 1,80,000 15,000 = Rs. 12 per hr.
     Standard Fixed OH rate          = 2,70,000      15,000      = Rs.1 8 per hr.
26


                 Material Variances (Actual Production : 25,000 Units)
St Qty of    Std Price        Std Qty of         Actual Qty          Actual           Usage              Price
 RM /FG      of RM/kg             RM on           of RM on            Price     Variance(Rs)      Variance(Rs)
                                  Actual             Actual         paid for
                              Production         Production             RM
      (a)           (b)                  (c)               (d)           (e)      ( c – d)   b      (b – e)   d
    3 kg        Rs 4.40       75,000 kgs             80,000         Rs 4.20           ( 22,000)        16,000
                                          Labour Variances
St time /   Std rate      Std time on          Actual time       Actual rate      Efficiency              Rate
      FG         per            Actual          on Actual          per hour    Variance(Rs)       Variance(Rs)
               hour       Production           Production
      (a)         (b)              (c)                 (d)               (e)     ( c – d)    b      (b – e)   d
 30 min         Rs 5      12,500 hrs           14,000 hrs            Rs 5.4           (7,500)          (5,600)

                                 Variable Overhead Variances
Actual variable overhead                                                = Rs. 1,60,000 (a)
Budgeted variable overhead                                              = Rs. 1,68,000 (b)
(28,000 0.5 hr Rs. 12)
Standard Variable O.H. for actual production                            = Rs. 1,50,000 (c)
(25,000 units     0.5 hr Rs. 12)
Variable O.H. Expenditure variance                                      = (a) – (b)
                                                                        = Rs. 1,60,000 Rs. 1,68,000
                                                                        = Rs. 8,000 (F)
Variable O.H. Efficiency variance                                       = (b) – (c)
= Rs. 1,68,000 Rs. 1,50,000                                             = Rs. 18,000 (A)
Fixed Overhead Variances
Actual fixed overhead incurred                                          = Rs. 2,70,000
Budgeted Fixed Overhead                                                 = Rs. 2,70,000
Expenditure Variance                                                    = Nil
Budgeted production                                                     = 28,000 Units
Actual production                                                       = 25,000 Units
Unutilised capacity                                                     = 3,000 Units or 1,500 Hrs
Production volume variance                                              = 1,500 Hrs Rs 18 per hr
                                                    = (Rs 27,000)
Note : For calculating production volume variance, normal operating capacity of 15,000
hours can also be used. In that case, budgeted production will be 30,000 units.
27


7.   Computation of Target Cost
                                                                              Per tonne (in Rs)
     ABC Ltd selling price to the merchant                                               1,466
     Less freight paid by ABC Ltd                                                         ( 30)
     Less normal sales returns and allowances                                             ( 60)
     XYZ Ltds Capital charge                                                             (120)
     Target cost for XYZ Ltd                                                             1,256
     Ship to Distribution Centre                                                          (11)
     Distribution Centre operating cost                                                   (25)
     Subtotal                                                                            1,220
     Distribution centre capital charge                                                   (58)
     Mill target manufacturing cost                                                      1,162

8.   1.   Rs. 1,60,000 (Rs. 16,00,000          10%)
     2.   a.    Total costs:
                                                                                           Rs.
                Variable (Rs. 25      80,000 units)                                  20,00,000
                Fixed (Rs. 8,00,000 + Rs. 4,00,000)                                  12,00,000
                Total                                                                32,00,000
                Cost amount per unit: Rs. 32,00,000 ÷ 80,000 units = Rs. 40.00
                                          Desired profit
          b.    Markup percentage
                                           Total costs
                                          Rs. 1,60,000
                Markup percentage                       5%
                                          Rs. 32,00,000
          c.                                                             Rs.
                Cost amount per unit                                  40.00
                Markup (Rs. 40        5%)                              2.00
                Selling price                                         42.00
     3.   a.    Total manufacturing costs:
                                                                        Rs.
                Variable (Rs. 20      80,000 units)               16,00,000
                Fixed factory overhead                             8,00,000
                Total                                             24,00,000
28


          Cost amount per unit: Rs. 24,00,000 ÷ 80,000 units = Rs. 30.00

                                 Desired profit Total selling and administrative expenses
     b.   Markup percentage
                                                Total manufacturing costs

                                 Rs. 1,60,000 Rs. 4,00,000 (Rs. 5 80,000 units)
          Markup percentage
                                                  Rs. 24,00,000

                                 Rs. 1,60,000 Rs. 4,00,000 Rs. 4,00,000
          Markup percentage
                                              Rs. 24,00,000

                                 Rs. 9,60,000
          Markup percentage                    40%
                                 Rs. 24,00,000

     c.                                                                 Rs.

          Cost amount per unit                                       30.00
          Markup (Rs. 30    40%)                                     12.00
          Selling price                                              42.00
4.   a.   Variable cost amount per unit : Rs. 25
          Total variable costs: Rs. 25    80,000 units = Rs. 20,00,000

                                 Desired profit Total fixed costs
     b.   Markup percentage
                                       Total variable costs

                                 Rs. 1,60,000 Rs. 8,00,000 Rs. 4,00,000
          Markup percentage
                                              Rs. 20,00,000

                                 Rs. 13,60,000
          Markup percentage                    68%
                                 Rs. 20,00,000

     c.                                                    Rs.
          Cost amount per unit                          25.00
          Markup (Rs. 25    68%)                        17.00
          Selling price                                 42.00
29


     5.   a.                                   Proposal to Sell to XYZ Ltd.
                                                                                                        Rs.
                   Differential revenue from accepting offer:
                        Revenue from sale of 4,000 additional units at Rs. 28                      1,12,000
                   Differential cost from accepting offer:
                        Variable production costs of 4,000 additional units at Rs. 20                80,000
                   Differential income from accepting offer                                          32,000
          b.       The proposal should be accepted.
9.   (a) Production plan and net profit
          Timber required
                                 Square metres                Budgeted volume                 Requirement
                                                                                           (square metres)
                                      (a)                                     (b)                  (a b)
          Chair                Rs. (5 2) = 2.5                             4,000                   10,000
          Bench                Rs. (15 2) = 7.5                            2,000                   15,000
          Table                Rs. (10 2) = 5.0                            1,500                     7,500
                                                                                                   32,500
          Therefore, there is a shortfall of 12,500 square metres.
                                                                   Chair               Bench          Table
          Unit contribution                                     Rs. 8.00            Rs. 17.50     Rs. 16.00
          Timber requirement (square metres)                         2.5                  7.5           5.0
          Contribution per square metre                         Rs. 3.20             Rs. 2.33      Rs. 3.20
          Ranking                                                  1st =                3rd =          1st =

          Production plan
                                                                   Square metres                Contribution
                                                                                                         Rs
          4,000 chairs (inclusive of 500 firm orders)                10,000.0                     32,000.00
          1,500 tables (inclusive of 150 firm orders)                  7,500.0                    24,000.00
          333 benches (inclusive of 100 firm orders)                   2,500.0                     5,825.00
                                                                     20,000.0                     61,825.00
          Fixed overhead (Rs18,000 + Rs22,500 + Rs13,500)                                         54,000.00
          Profit                                                                                   7,825.00
30


    (b) Since the optimum production plan in part (a) indicates that demand for chairs and
        tables is satisfied by production, any additional timber would be utilized to
        manufacture benches.
         Each square metre used on a bench contributes Rs2.33 (see part (a) after charging
         the present cost of timber (Rs. 2 per square metre).
         Therefore the maximum price to be paid is Rs2.33 + Rs2 = Rs 4.33 per square
         metre.
         Unsatisfied demand = (2,000         333) 1,667 benches.
           Timber required is 1,667 7.5 square metres = 12,502.5 square metres, less the
         2.5 square metres still available from the original supplier = 12,500 square metres.
10. The costs/benefits of closing on 30 November, 2006 instead of closing on 30 June, 2006
    are:
                                                                            Rs.           Rs.
    Payments to XYZ Ltd avoided (5 months @ Rs. 65,000)                              3,25,000
    *Salaries and wages cost
    (5 months @ (Rs. 18,000 + Rs. 4,000 – Rs. 3,000 + Rs. 1,300)                   (1,01,500)
    **Printing materials
    (5 months @ Rs. 31,000) – Rs. 18,000 + Rs. 10,000)                             (1,47,000)
    ***Distribution materials                                                         (5,280)
    Occupancy costs
         ****Printing                                                17,212.50
         *****Distribution                                            2,175.00
                                                                                  (19,387.50)
    Loss of sub-letting income (5 months @ Rs. 2,500)                                (12,500)
    ******Additional loss on sale of plant                                            (2,000)
    Additional loss on sale of vehicles (Rs. 48,000 – Rs. 44,000)                     (4,000)
    Net benefit of closing on 30 November                                           33,332.50
    The plant should remain open until 30 November.
    *    The total salaries equal Rs. 22,000 (Rs. 18,000 + Rs. 4,000) but two staff will be
         retained so the net saving of closing on 30 June is reduced by their salaries (Rs.
         3,000 per month). If closure does not occur until November, the vacancy in the
         publishing department will need to be filled (at Rs. 1,300 per month) until closure in
         November when the transfer occurs. The redundancy pay will arise whenever
         closure occurs and is therefore irrelevant.
31


    **   The future cash outflow on printing materials is Rs. 31,000 per month for five
         months less the Rs. 18,000 held in stock. However, the opportunity to sell the stock
         is lost, therefore, there is an additional cost of Rs. 10,000.
    *** If the department is closed then the options are (from note (ii) in the question):
         (i)   Accept both deliveries, pay for them and sell the goods to XYZ Ltd:
               (2   Rs. 500) – (2   Rs. 380) = Rs. 240 net cost.
         (ii) Accept the July delivery, pay for it, sell it to XYZ Ltd and pay the cancellation
              cost for August:
               (Rs. 500 – Rs. 380) + Rs. 100 = Rs. 220 net cost.
         (iii) Cancel both deliveries at a net cost of Rs. 300.
               The lowest cost option would be selected if closure occurred, therefore this is
               a benefit of continuing to November.
               The distribution material costs to November are (5 months @ Rs. 1,100) – Rs.
               220 = Rs. 5,280.
    **** Attributable costs are [(Rs. 8,500    30%) + (Rs. 8,500     70%    15%)]     5 months
         = Rs. 17,212.50.
    ***** Attributable costs are [(Rs. 1,200   25%) + (Rs. 1,200     75%    15%)]     5 months
          = Rs. 2,175.
    ******                                                                                   Rs.
         Net book value                                                                48,000
         June sale (loss)                                                              21,000
         Therefore June proceeds                                                       27,000
         November proceeds                                                             25,000
         Additional loss                                                                2,000
11. (a) Back flushing in a JIT system
         Traditional accounting systems record the flow of inventory through elaborate
         accounting procedures. Such systems are required in those manufacturing
         environment where inventory/WIP values are large. However, since JIT systems
         operate in modern manufacturing environment characterized by low inventory and
         WIP values, usually also associated with low cost variances, the requirements of
         such elaborate accounting procedures does not exist.
         Back flushing requires no data entry of any kind until a finished product is
         completed. At that time the total amount finished is entered into the computer
         system which is multiplied by all components as per the Bill of materials (BOM) for
         each item produced. This yields a lengthy list of components that should have been
         used in the production process and this is subtracted from the opening stock to
32


          arrive at the closing stock to arrive at the closing stock/inventory.
          The problems with back flushing that must be corrected before it works properly are:
          (i)   The total production quantity entered into the system must be absolutely
                correct, if not, then wrong components and quantities will be subtracted from
                the stock.
          (ii) All abnormal scrap must be diligently tracked and recorded. Otherwise
               materials will fall outside the black flushing system and will not be charged to
               inventory.
          (iii) Lot tracing is impossible under the back flushing system. This is required when
                a manufacturer needs to keep records of which production lots were used to
                create a product in case all the items in a lot need be recalled.
          (iv) The inventory balance may be too high at all times because the back flushing
               transactions that relieves inventory usually does so only once a day, during
               which time other inventory is sent to the production process. This makes it
               difficult to maintain an accurate set of inventory records in the warehouse.
     (b) Reasons for following skimming pricing policy
          It is a policy where the prices are kept high during the early period of a product’s
          existence. This can be synchronised with high promotional expenditure and in the
          latter years the prices can be gradually reduced. The reasons for following such a
          policy are as follows:
          (i)   The demand is likely to be inelastic in the earlier stages till the product is
                established in the market.
          (ii) The gradual reduction in price in the latter years will tend to increase the sales.
          (iii) This method is preferred in the beginning because in the initial periods when
                the demand for the product is not known the price covers the initial cost of
                production.
          (iv) High initial capital outlays needed for manufacture, results in high cost of
               production. In addition to this, the producer has to incur huge promotional
               activities resulting in increased costs. High initial prices will be able to finance
               the cost of production particularly when uncertainties block the usual sources
               of capital.
12. The Balanced Scorecard can be defined as ‘an approach to the provision of information
    to management to assist strategic policy formulation and achievement’. It emphasizes the
    need to provide the user with a set of information, which addresses all relevant areas of
    performance in an objective and unbiased fashion. The information provided may include
    both financial and non financial elements, and cover areas such as profitability, customer
    satisfaction, internal efficiency and innovation’.
     It shall be clear from the above definition that the central idea of the Balanced Scorecard
     is that managers should develop the measures on which they manage the business from
33


four different perspectives:
1.    Customer satisfaction
2.   Internal business process e.g., operating cycle time.
3.   Kaizen approach (can we continue to improve and create value)
4.   Financial e.g., operating income by segments.
The following figure summarises the ideas of a Balanced Scorecard:


The ultimate result of using the Balanced Scorecard approach should be an improved
long-term financial performance. Since the scorecard gives equal importance to the
relevant non – financial measures, it should discourage the short termism that leads to
cuts in spending on new product development, human resource development etc which
are ultimately detrimental for the future prospects of the company.
The responsibility to devise and implement a Balanced Scorecard should be that of the
34


     managers working with the business. Since every company is different, it shall need to
     work out for itself the various financial and non – financial measures, which need to be
     focussed upon for its own development. Since the Balanced Scorecard is recommended
     as a management tool used both for internal and external reporting purposes, it is again
     the manager’s responsibility to decide as to what information needs to be disclosed and
     how any problems of confidentiality can best be overcome.
     The following are some reasons why Balanced Scorecards sometimes fail to provide for
     the desired results:
          Managers mistakenly think that since they already use non – financial measures,
          they already have a Balanced Scorecard.
          Senior executives misguidedly delegate the responsibility of the Scorecard
          implementation to middle level managers.
          Company’s try to copy measures and strategies used by the best companies rather
          than developing their own measures suited for the environment under which they
          function.
          There are times when Balanced Scorecards are thought to be meant for reporting
          purposes only. This notion does not allow a Business to use the Scorecard to
          manage Business in a new and more effective way.
          It may be noted that the above-mentioned difficulties refer to the internal use of the
          Scorecard, unless it is used internally successfully, it should not be used as a basis
          for external reporting.
13. (a) Cost classification is the process of grouping costs according to their
        characteristics. Costs are classified or grouped according to their common
        characteristics. Costs may be classified according to elements, according to
        functions or operations, according to their behaviour, according to controllability or
        according to normality.
          The break up of the aggregate costs into relevant types, is an essential pre-requisite
          of decision making as well as of controlling costs. Classification of costs on different
          bases is thus necessary for various purposes. For the purpose of decision-making
          and control, costs are distinguished on the basis of their relevance to different type
          of decisions and control functions. The importance of distinguishing costs as direct
          or indirect lies in the fact that direct costs of a product or an activity can be
          accurately allocated while indirect costs have to be apportioned on the basis of
          certain assumptions. This is so because direct costs are controllable at the
          operational level whereas indirect costs are not amenable to such control.
     (b) Cost information is required both for short-term and long-run managerial problems.
         Differential costs are of particular use in short-term problems which are non-
         repetitive, one time, ad-hoc problems. The following are the most common short-
         term problems and areas where differential cost analysis may be deployed.
          1.   Accept - or - reject special order decisions.
35


          2.   Make - or - buy decisions.
          3.   Sell- or - process decisions.
          4.   Reduce - or - maintain price decisions.
          5.   Add - or - drop product decisions.
          6.   Operate - or shut down decisions.
     (c) Relevant costs are pertinent or valid costs for a decision. These bear upon or
         ‘influence decision' and are directly related to the decisions to be made. These are
         critical to the decision, and have significance for it. These are the costs which
         generally respond to managerial decision making, and have significance in arriving
         at correct conclusions. These costs are capable of making a difference in user-
         decisions and enter into a choice between alternative courses of action. In specific
         terms, relevant costs for decisions are defined as "expected future costs that will
         differ under alternatives".
          Relevant costs are futuristic in nature. These are the costs that are expected to
          occur during the time period covered by the decision. These costs are different
          between alternatives being considered. Only costs that differ among decision
          alternatives are relevant to a decision.
14. (a) The possible disadvantages of treating divisions as profit centres are as follows:
          1.   Divisions may compete with each other and may take decisions to increase
               profits at the expense of other divisions thereby overemphasizing short term
               results.
          2.   It may adversely affect co-operation between the divisions and lead to lack of
               harmony in achieving organisational goals of the company. Thus it is hard to
               achieve the objective of goal congruence.
          3.   It may lead to reduction in the company's overall total profits.
          4.   The cost of activities which are common to all divisions may be greater for
               decentralised structure than for centralised structure. It may thus result in
               duplication of staff activities.
          5.   Top management 10 sesc' Control by delegating decision making to divisional
               managers. There are risks of mistakes committed by the divisional managers
               which the top management, may avoid.
          6.   Series of control reports prepared for several departments may not be effective
               from the point of view of top management.
          7.   It may under utilise corporate competence.
          8.   It leads to complications associated with transfer pricing problems.
          9.   It becomes difficult to identity and define precisely suitable profit centres.
          10. It confuses division's results with manager's performance.
36


     (b) Bench marking is a technique which is being adopted as a mechanism for achieving
         continuous improvement. It is a continuous process of measuring a company’s
         products, services or activities against the other best performing organizations
         either internal or external to the company. The objective is to ascertain how the
         processes and activities can be improved. The latest developments, best practices
         and model examples can be incorporated within various operations of the business
         of the company. It represents an ideal way of achieving high competitive standards.
15. (a)                            Standard Cost Sheet
                                 Max. capacity = 200 units.
          Description                                        Cost per unit of Finished Good
          Standard Raw Material Cost                                                    Rs. 5,600
          Variable Overheads                                                            Rs. 1,400
          Standard Fixed Overheads                                                      Rs. 10,000
          Standard Cost per Unit of Finished Good                                       Rs. 17,000
     (b) Production Volume Variance
          Unutilised capacity × Standard Fixed Cost per Finished Good
          100 × Rs 10,000 = Rs 10,00,000 Adverse.
                     Usage and Material Price Variance (Actual Production : 100 Units)
          Raw        Std         Std.    Actual       Act      Std Price      Usage           Price
          Material   Qty/FG    Qty on    Qty on     Price     per unit of   Variance       Variance
                               actual    actual   per unit           RM         (Rs.)          (Rs.)
                                 prod      prod    of RM           (Rs.)
                                                    (Rs.)
          A          1           100       102        700           600      (1,200)       (10,200)
          B          2           200       201        600           500        (500)       (20,100)
          C          3           300       310        500           400      (4,000)       (31,000)
          D          4           400       415        400           300      (4,500)       (41,500)
          E          5           500       540        300           200      (8,000)       (54,000)
          F          6           600       610        200           100      (1,000)       (61,000)
                                                                            (19,200)      (2,17,800)

16. (a) The first time when a new operation is performed, both the workers and the
        operating procedures are untried. As the operation is repeated and the workers
        become more familiar with work, labour efficiency increases and the labour cost per
        unit declines. This process continues for some time and a regular rate of decline in
        cost per unit can be established. This rate can be used to predict future labour
        costs. The learning process starts from the point when the first unit comes out of
        the production line. In other words ‘Learning curve’ is a function that measures how
37


    labour hours per unit decline as units of production increase because workers are
    learning and becoming better at their jobs.
    Cost Management Application:
    1.    Learning curve is useful in analysing cost volume profit relationship. The
          company can set low price of its product to generate high demand. As the
          production increases, cost per unit drops.
    2.    It helps in budgeting and profit planning.
    3.    It enables the company in price fixation. In particular, the company can fix a
          lower price for repeat orders.
    4.    It helps the design engineers to take suitable decisions based on expected
          rates of improvement.
    5.    It helps in price negotiations.
    6.    It is useful in setting standards and in performance evaluation.
(b) (i)   Price per unit for first order of 100 units
                                                                     Rs.              Rs.
          Direct material                                                          500.00
          Direct labour                          Dept A 20 Hrs @ 10 = 200          800.00
                                                 Dept B 40 Hrs @ 15 = 600
          Variable Overhead                                20% of Rs 800           160.00
          Fixed Overhead                          Dept A 20 Hrs @ 8 = 160          360.00
                                                  Dept B 40 Hrs @ 5 = 200
          Total cost                                                              1,820.00
          Profit 25%                                                               455.00
          Selling price per unit                                                  2,275.00
    (ii) Price per unit for second order of 60 units
          Learning will be applicable only in department B.
          Cumulative output becomes 100 units + 60 units = 160 units i.e 1.6 times for
          which learning is 86.1 % from the tables.
          Therefore Total Hrs for 160 units = 160 units      40    .861 = 5,510.4 Hrs
          Therefore Hrs for 60 units = Hrs for 160 units less Hrs for 100 units
          Or 5510.4 less 40        100 = 1510.4 Hrs
                                      1510.4
          Therefore Hrs per unit =           = 25.17.
                                        60
Advanced+management+accounting+ +nov+2008+rtp

Weitere ähnliche Inhalte

Was ist angesagt?

Management Accounting (Flexible budget)
Management Accounting (Flexible budget)Management Accounting (Flexible budget)
Management Accounting (Flexible budget)Abdul Basit
 
ACCT 505 Education Organization / snaptutorial.com
ACCT 505 Education Organization / snaptutorial.comACCT 505 Education Organization / snaptutorial.com
ACCT 505 Education Organization / snaptutorial.comMcdonaldRyan31
 
Costing master budget
Costing master budgetCosting master budget
Costing master budgetAdil Shaikh
 
ACCT 505 Enhance teaching - snaptutorial.com
ACCT 505 Enhance teaching - snaptutorial.comACCT 505 Enhance teaching - snaptutorial.com
ACCT 505 Enhance teaching - snaptutorial.comdonaldzs49
 
Acct 505 Effective Communication-snaptutorial.com
Acct 505 Effective Communication-snaptutorial.comAcct 505 Effective Communication-snaptutorial.com
Acct 505 Effective Communication-snaptutorial.comjhonklinz3
 
Managerial Accounting in class exercise chapter 4 solution
Managerial Accounting in class exercise chapter 4 solutionManagerial Accounting in class exercise chapter 4 solution
Managerial Accounting in class exercise chapter 4 solutionHelen Wong
 
Isbm mba case study answer sheets. emba bms dms 9902787224 - 9901366442
Isbm mba case study answer sheets. emba bms dms   9902787224 - 9901366442Isbm mba case study answer sheets. emba bms dms   9902787224 - 9901366442
Isbm mba case study answer sheets. emba bms dms 9902787224 - 9901366442NMIMS ASSIGNMENTS HELP
 
Activity based costing & activity based management
Activity  based costing & activity based managementActivity  based costing & activity based management
Activity based costing & activity based managementPiyush Gaur
 
ACCT 505 Effective Communication/tutorialrank.com
 ACCT 505 Effective Communication/tutorialrank.com ACCT 505 Effective Communication/tutorialrank.com
ACCT 505 Effective Communication/tutorialrank.comjonhson174
 
ACCT 505 HELP Education for Service--acct505help.com
ACCT 505 HELP Education for Service--acct505help.comACCT 505 HELP Education for Service--acct505help.com
ACCT 505 HELP Education for Service--acct505help.comabhila171
 
ACCT 505 HELP Become Exceptional--acct505help.com
ACCT 505 HELP Become Exceptional--acct505help.comACCT 505 HELP Become Exceptional--acct505help.com
ACCT 505 HELP Become Exceptional--acct505help.comKeatonJennings119
 
ACCT 505 OUTLET Achievement Education--acct505outlet.com
ACCT 505 OUTLET Achievement Education--acct505outlet.comACCT 505 OUTLET Achievement Education--acct505outlet.com
ACCT 505 OUTLET Achievement Education--acct505outlet.comagathachristie179
 
ACCT 505 OUTLET Introduction Education--acct505outlet.com
ACCT 505 OUTLET Introduction Education--acct505outlet.comACCT 505 OUTLET Introduction Education--acct505outlet.com
ACCT 505 OUTLET Introduction Education--acct505outlet.comagathachristie291
 

Was ist angesagt? (15)

Wcm (2)
Wcm (2)Wcm (2)
Wcm (2)
 
Management Accounting (Flexible budget)
Management Accounting (Flexible budget)Management Accounting (Flexible budget)
Management Accounting (Flexible budget)
 
ACCT 505 Education Organization / snaptutorial.com
ACCT 505 Education Organization / snaptutorial.comACCT 505 Education Organization / snaptutorial.com
ACCT 505 Education Organization / snaptutorial.com
 
Costing master budget
Costing master budgetCosting master budget
Costing master budget
 
ACCT 505 Enhance teaching - snaptutorial.com
ACCT 505 Enhance teaching - snaptutorial.comACCT 505 Enhance teaching - snaptutorial.com
ACCT 505 Enhance teaching - snaptutorial.com
 
Budgets
BudgetsBudgets
Budgets
 
Acct 505 Effective Communication-snaptutorial.com
Acct 505 Effective Communication-snaptutorial.comAcct 505 Effective Communication-snaptutorial.com
Acct 505 Effective Communication-snaptutorial.com
 
Managerial Accounting in class exercise chapter 4 solution
Managerial Accounting in class exercise chapter 4 solutionManagerial Accounting in class exercise chapter 4 solution
Managerial Accounting in class exercise chapter 4 solution
 
Isbm mba case study answer sheets. emba bms dms 9902787224 - 9901366442
Isbm mba case study answer sheets. emba bms dms   9902787224 - 9901366442Isbm mba case study answer sheets. emba bms dms   9902787224 - 9901366442
Isbm mba case study answer sheets. emba bms dms 9902787224 - 9901366442
 
Activity based costing & activity based management
Activity  based costing & activity based managementActivity  based costing & activity based management
Activity based costing & activity based management
 
ACCT 505 Effective Communication/tutorialrank.com
 ACCT 505 Effective Communication/tutorialrank.com ACCT 505 Effective Communication/tutorialrank.com
ACCT 505 Effective Communication/tutorialrank.com
 
ACCT 505 HELP Education for Service--acct505help.com
ACCT 505 HELP Education for Service--acct505help.comACCT 505 HELP Education for Service--acct505help.com
ACCT 505 HELP Education for Service--acct505help.com
 
ACCT 505 HELP Become Exceptional--acct505help.com
ACCT 505 HELP Become Exceptional--acct505help.comACCT 505 HELP Become Exceptional--acct505help.com
ACCT 505 HELP Become Exceptional--acct505help.com
 
ACCT 505 OUTLET Achievement Education--acct505outlet.com
ACCT 505 OUTLET Achievement Education--acct505outlet.comACCT 505 OUTLET Achievement Education--acct505outlet.com
ACCT 505 OUTLET Achievement Education--acct505outlet.com
 
ACCT 505 OUTLET Introduction Education--acct505outlet.com
ACCT 505 OUTLET Introduction Education--acct505outlet.comACCT 505 OUTLET Introduction Education--acct505outlet.com
ACCT 505 OUTLET Introduction Education--acct505outlet.com
 

Ähnlich wie Advanced+management+accounting+ +nov+2008+rtp

Activity based costing .pptx
Activity based costing .pptxActivity based costing .pptx
Activity based costing .pptxNavyaTandon3
 
Absorption costing vs. marginal costing
Absorption costing vs. marginal costingAbsorption costing vs. marginal costing
Absorption costing vs. marginal costingshivpratap121
 
working capital management problems
working capital management problemsworking capital management problems
working capital management problemsGorani & Associates
 
Mb0041 fall drive assignment-2012
Mb0041 fall drive assignment-2012Mb0041 fall drive assignment-2012
Mb0041 fall drive assignment-2012sandeepverma1987
 
Manufacturing cost accounting ppt @ mba finance
Manufacturing cost accounting ppt @ mba financeManufacturing cost accounting ppt @ mba finance
Manufacturing cost accounting ppt @ mba financeBabasab Patil
 
Management information may jun 2016 Knowledge Level Question ICAB
Management information may jun 2016 Knowledge Level Question ICAB Management information may jun 2016 Knowledge Level Question ICAB
Management information may jun 2016 Knowledge Level Question ICAB Sazzad Hossain, ITP, MBA, CSCA™
 
33918586 cost-accounting-level-3-series-2-2009
33918586 cost-accounting-level-3-series-2-200933918586 cost-accounting-level-3-series-2-2009
33918586 cost-accounting-level-3-series-2-2009priya5594
 
Cost Of Good Sold
Cost Of Good SoldCost Of Good Sold
Cost Of Good Soldjunaid khan
 
Variable costing & absorption costing
Variable costing & absorption costingVariable costing & absorption costing
Variable costing & absorption costingnaimhossain8
 
Business and accounting(may 2009)
Business and accounting(may 2009)Business and accounting(may 2009)
Business and accounting(may 2009)smiledigital
 
Running head group case 1
Running head group case 1                                       Running head group case 1
Running head group case 1 DIPESH30
 
Week 5 – Term 5 Homework60 PointsDue June 10, 20121.(6 poi.docx
Week 5 – Term 5 Homework60 PointsDue June 10, 20121.(6 poi.docxWeek 5 – Term 5 Homework60 PointsDue June 10, 20121.(6 poi.docx
Week 5 – Term 5 Homework60 PointsDue June 10, 20121.(6 poi.docxmelbruce90096
 
ACCOUNTING
ACCOUNTINGACCOUNTING
ACCOUNTINGasfawm
 
Business Plan - Setup A Jeans Factory
Business Plan - Setup A Jeans FactoryBusiness Plan - Setup A Jeans Factory
Business Plan - Setup A Jeans FactoryVinay Prajapati
 
Ayurvedic capsule manufacturing unit
Ayurvedic capsule manufacturing unitAyurvedic capsule manufacturing unit
Ayurvedic capsule manufacturing unitKaushik Chaudhury
 
Management of Modugno Corporation is considering whether to p.docx
Management of Modugno Corporation is considering whether to p.docxManagement of Modugno Corporation is considering whether to p.docx
Management of Modugno Corporation is considering whether to p.docxTatianaMajor22
 
Profit planning
Profit planningProfit planning
Profit planningcdioenpg
 

Ähnlich wie Advanced+management+accounting+ +nov+2008+rtp (20)

Budgets
BudgetsBudgets
Budgets
 
Activity based costing .pptx
Activity based costing .pptxActivity based costing .pptx
Activity based costing .pptx
 
Absorption costing vs. marginal costing
Absorption costing vs. marginal costingAbsorption costing vs. marginal costing
Absorption costing vs. marginal costing
 
working capital management problems
working capital management problemsworking capital management problems
working capital management problems
 
Mbaptmciijuly2009
Mbaptmciijuly2009Mbaptmciijuly2009
Mbaptmciijuly2009
 
Mb0041 fall drive assignment-2012
Mb0041 fall drive assignment-2012Mb0041 fall drive assignment-2012
Mb0041 fall drive assignment-2012
 
Manufacturing cost accounting ppt @ mba finance
Manufacturing cost accounting ppt @ mba financeManufacturing cost accounting ppt @ mba finance
Manufacturing cost accounting ppt @ mba finance
 
Management information may jun 2016 Knowledge Level Question ICAB
Management information may jun 2016 Knowledge Level Question ICAB Management information may jun 2016 Knowledge Level Question ICAB
Management information may jun 2016 Knowledge Level Question ICAB
 
33918586 cost-accounting-level-3-series-2-2009
33918586 cost-accounting-level-3-series-2-200933918586 cost-accounting-level-3-series-2-2009
33918586 cost-accounting-level-3-series-2-2009
 
Cost Of Good Sold
Cost Of Good SoldCost Of Good Sold
Cost Of Good Sold
 
Tc9 q june-2014
Tc9 q june-2014Tc9 q june-2014
Tc9 q june-2014
 
Variable costing & absorption costing
Variable costing & absorption costingVariable costing & absorption costing
Variable costing & absorption costing
 
Business and accounting(may 2009)
Business and accounting(may 2009)Business and accounting(may 2009)
Business and accounting(may 2009)
 
Running head group case 1
Running head group case 1                                       Running head group case 1
Running head group case 1
 
Week 5 – Term 5 Homework60 PointsDue June 10, 20121.(6 poi.docx
Week 5 – Term 5 Homework60 PointsDue June 10, 20121.(6 poi.docxWeek 5 – Term 5 Homework60 PointsDue June 10, 20121.(6 poi.docx
Week 5 – Term 5 Homework60 PointsDue June 10, 20121.(6 poi.docx
 
ACCOUNTING
ACCOUNTINGACCOUNTING
ACCOUNTING
 
Business Plan - Setup A Jeans Factory
Business Plan - Setup A Jeans FactoryBusiness Plan - Setup A Jeans Factory
Business Plan - Setup A Jeans Factory
 
Ayurvedic capsule manufacturing unit
Ayurvedic capsule manufacturing unitAyurvedic capsule manufacturing unit
Ayurvedic capsule manufacturing unit
 
Management of Modugno Corporation is considering whether to p.docx
Management of Modugno Corporation is considering whether to p.docxManagement of Modugno Corporation is considering whether to p.docx
Management of Modugno Corporation is considering whether to p.docx
 
Profit planning
Profit planningProfit planning
Profit planning
 

Kürzlich hochgeladen

Top 10 Modern Web Design Trends for 2025
Top 10 Modern Web Design Trends for 2025Top 10 Modern Web Design Trends for 2025
Top 10 Modern Web Design Trends for 2025Rndexperts
 
毕业文凭制作#回国入职#diploma#degree澳洲弗林德斯大学毕业证成绩单pdf电子版制作修改#毕业文凭制作#回国入职#diploma#degree
毕业文凭制作#回国入职#diploma#degree澳洲弗林德斯大学毕业证成绩单pdf电子版制作修改#毕业文凭制作#回国入职#diploma#degree 毕业文凭制作#回国入职#diploma#degree澳洲弗林德斯大学毕业证成绩单pdf电子版制作修改#毕业文凭制作#回国入职#diploma#degree
毕业文凭制作#回国入职#diploma#degree澳洲弗林德斯大学毕业证成绩单pdf电子版制作修改#毕业文凭制作#回国入职#diploma#degree ttt fff
 
Call Girls Meghani Nagar 7397865700 Independent Call Girls
Call Girls Meghani Nagar 7397865700  Independent Call GirlsCall Girls Meghani Nagar 7397865700  Independent Call Girls
Call Girls Meghani Nagar 7397865700 Independent Call Girlsssuser7cb4ff
 
Cosumer Willingness to Pay for Sustainable Bricks
Cosumer Willingness to Pay for Sustainable BricksCosumer Willingness to Pay for Sustainable Bricks
Cosumer Willingness to Pay for Sustainable Bricksabhishekparmar618
 
CREATING A POSITIVE SCHOOL CULTURE CHAPTER 10
CREATING A POSITIVE SCHOOL CULTURE CHAPTER 10CREATING A POSITIVE SCHOOL CULTURE CHAPTER 10
CREATING A POSITIVE SCHOOL CULTURE CHAPTER 10uasjlagroup
 
3D Printing And Designing Final Report.pdf
3D Printing And Designing Final Report.pdf3D Printing And Designing Final Report.pdf
3D Printing And Designing Final Report.pdfSwaraliBorhade
 
Design Portfolio - 2024 - William Vickery
Design Portfolio - 2024 - William VickeryDesign Portfolio - 2024 - William Vickery
Design Portfolio - 2024 - William VickeryWilliamVickery6
 
Dubai Calls Girl Tapes O525547819 Real Tapes Escort Services Dubai
Dubai Calls Girl Tapes O525547819 Real Tapes Escort Services DubaiDubai Calls Girl Tapes O525547819 Real Tapes Escort Services Dubai
Dubai Calls Girl Tapes O525547819 Real Tapes Escort Services Dubaikojalkojal131
 
办理(USYD毕业证书)澳洲悉尼大学毕业证成绩单原版一比一
办理(USYD毕业证书)澳洲悉尼大学毕业证成绩单原版一比一办理(USYD毕业证书)澳洲悉尼大学毕业证成绩单原版一比一
办理(USYD毕业证书)澳洲悉尼大学毕业证成绩单原版一比一diploma 1
 
Call In girls Bhikaji Cama Place 🔝 ⇛8377877756 FULL Enjoy Delhi NCR
Call In girls Bhikaji Cama Place 🔝 ⇛8377877756 FULL Enjoy Delhi NCRCall In girls Bhikaji Cama Place 🔝 ⇛8377877756 FULL Enjoy Delhi NCR
Call In girls Bhikaji Cama Place 🔝 ⇛8377877756 FULL Enjoy Delhi NCRdollysharma2066
 
Call Girls Satellite 7397865700 Ridhima Hire Me Full Night
Call Girls Satellite 7397865700 Ridhima Hire Me Full NightCall Girls Satellite 7397865700 Ridhima Hire Me Full Night
Call Girls Satellite 7397865700 Ridhima Hire Me Full Nightssuser7cb4ff
 
办理卡尔顿大学毕业证成绩单|购买加拿大文凭证书
办理卡尔顿大学毕业证成绩单|购买加拿大文凭证书办理卡尔顿大学毕业证成绩单|购买加拿大文凭证书
办理卡尔顿大学毕业证成绩单|购买加拿大文凭证书zdzoqco
 
Call Girls in Ashok Nagar Delhi ✡️9711147426✡️ Escorts Service
Call Girls in Ashok Nagar Delhi ✡️9711147426✡️ Escorts ServiceCall Girls in Ashok Nagar Delhi ✡️9711147426✡️ Escorts Service
Call Girls in Ashok Nagar Delhi ✡️9711147426✡️ Escorts Servicejennyeacort
 
在线办理ohio毕业证俄亥俄大学毕业证成绩单留信学历认证
在线办理ohio毕业证俄亥俄大学毕业证成绩单留信学历认证在线办理ohio毕业证俄亥俄大学毕业证成绩单留信学历认证
在线办理ohio毕业证俄亥俄大学毕业证成绩单留信学历认证nhjeo1gg
 
group_15_empirya_p1projectIndustrial.pdf
group_15_empirya_p1projectIndustrial.pdfgroup_15_empirya_p1projectIndustrial.pdf
group_15_empirya_p1projectIndustrial.pdfneelspinoy
 
How to Be Famous in your Field just visit our Site
How to Be Famous in your Field just visit our SiteHow to Be Famous in your Field just visit our Site
How to Be Famous in your Field just visit our Sitegalleryaagency
 
Architecture case study India Habitat Centre, Delhi.pdf
Architecture case study India Habitat Centre, Delhi.pdfArchitecture case study India Habitat Centre, Delhi.pdf
Architecture case study India Habitat Centre, Delhi.pdfSumit Lathwal
 
Top 10 Modern Web Design Trends for 2025
Top 10 Modern Web Design Trends for 2025Top 10 Modern Web Design Trends for 2025
Top 10 Modern Web Design Trends for 2025Rndexperts
 
原版1:1定制堪培拉大学毕业证(UC毕业证)#文凭成绩单#真实留信学历认证永久存档
原版1:1定制堪培拉大学毕业证(UC毕业证)#文凭成绩单#真实留信学历认证永久存档原版1:1定制堪培拉大学毕业证(UC毕业证)#文凭成绩单#真实留信学历认证永久存档
原版1:1定制堪培拉大学毕业证(UC毕业证)#文凭成绩单#真实留信学历认证永久存档208367051
 
NO1 Famous Amil Baba In Karachi Kala Jadu In Karachi Amil baba In Karachi Add...
NO1 Famous Amil Baba In Karachi Kala Jadu In Karachi Amil baba In Karachi Add...NO1 Famous Amil Baba In Karachi Kala Jadu In Karachi Amil baba In Karachi Add...
NO1 Famous Amil Baba In Karachi Kala Jadu In Karachi Amil baba In Karachi Add...Amil baba
 

Kürzlich hochgeladen (20)

Top 10 Modern Web Design Trends for 2025
Top 10 Modern Web Design Trends for 2025Top 10 Modern Web Design Trends for 2025
Top 10 Modern Web Design Trends for 2025
 
毕业文凭制作#回国入职#diploma#degree澳洲弗林德斯大学毕业证成绩单pdf电子版制作修改#毕业文凭制作#回国入职#diploma#degree
毕业文凭制作#回国入职#diploma#degree澳洲弗林德斯大学毕业证成绩单pdf电子版制作修改#毕业文凭制作#回国入职#diploma#degree 毕业文凭制作#回国入职#diploma#degree澳洲弗林德斯大学毕业证成绩单pdf电子版制作修改#毕业文凭制作#回国入职#diploma#degree
毕业文凭制作#回国入职#diploma#degree澳洲弗林德斯大学毕业证成绩单pdf电子版制作修改#毕业文凭制作#回国入职#diploma#degree
 
Call Girls Meghani Nagar 7397865700 Independent Call Girls
Call Girls Meghani Nagar 7397865700  Independent Call GirlsCall Girls Meghani Nagar 7397865700  Independent Call Girls
Call Girls Meghani Nagar 7397865700 Independent Call Girls
 
Cosumer Willingness to Pay for Sustainable Bricks
Cosumer Willingness to Pay for Sustainable BricksCosumer Willingness to Pay for Sustainable Bricks
Cosumer Willingness to Pay for Sustainable Bricks
 
CREATING A POSITIVE SCHOOL CULTURE CHAPTER 10
CREATING A POSITIVE SCHOOL CULTURE CHAPTER 10CREATING A POSITIVE SCHOOL CULTURE CHAPTER 10
CREATING A POSITIVE SCHOOL CULTURE CHAPTER 10
 
3D Printing And Designing Final Report.pdf
3D Printing And Designing Final Report.pdf3D Printing And Designing Final Report.pdf
3D Printing And Designing Final Report.pdf
 
Design Portfolio - 2024 - William Vickery
Design Portfolio - 2024 - William VickeryDesign Portfolio - 2024 - William Vickery
Design Portfolio - 2024 - William Vickery
 
Dubai Calls Girl Tapes O525547819 Real Tapes Escort Services Dubai
Dubai Calls Girl Tapes O525547819 Real Tapes Escort Services DubaiDubai Calls Girl Tapes O525547819 Real Tapes Escort Services Dubai
Dubai Calls Girl Tapes O525547819 Real Tapes Escort Services Dubai
 
办理(USYD毕业证书)澳洲悉尼大学毕业证成绩单原版一比一
办理(USYD毕业证书)澳洲悉尼大学毕业证成绩单原版一比一办理(USYD毕业证书)澳洲悉尼大学毕业证成绩单原版一比一
办理(USYD毕业证书)澳洲悉尼大学毕业证成绩单原版一比一
 
Call In girls Bhikaji Cama Place 🔝 ⇛8377877756 FULL Enjoy Delhi NCR
Call In girls Bhikaji Cama Place 🔝 ⇛8377877756 FULL Enjoy Delhi NCRCall In girls Bhikaji Cama Place 🔝 ⇛8377877756 FULL Enjoy Delhi NCR
Call In girls Bhikaji Cama Place 🔝 ⇛8377877756 FULL Enjoy Delhi NCR
 
Call Girls Satellite 7397865700 Ridhima Hire Me Full Night
Call Girls Satellite 7397865700 Ridhima Hire Me Full NightCall Girls Satellite 7397865700 Ridhima Hire Me Full Night
Call Girls Satellite 7397865700 Ridhima Hire Me Full Night
 
办理卡尔顿大学毕业证成绩单|购买加拿大文凭证书
办理卡尔顿大学毕业证成绩单|购买加拿大文凭证书办理卡尔顿大学毕业证成绩单|购买加拿大文凭证书
办理卡尔顿大学毕业证成绩单|购买加拿大文凭证书
 
Call Girls in Ashok Nagar Delhi ✡️9711147426✡️ Escorts Service
Call Girls in Ashok Nagar Delhi ✡️9711147426✡️ Escorts ServiceCall Girls in Ashok Nagar Delhi ✡️9711147426✡️ Escorts Service
Call Girls in Ashok Nagar Delhi ✡️9711147426✡️ Escorts Service
 
在线办理ohio毕业证俄亥俄大学毕业证成绩单留信学历认证
在线办理ohio毕业证俄亥俄大学毕业证成绩单留信学历认证在线办理ohio毕业证俄亥俄大学毕业证成绩单留信学历认证
在线办理ohio毕业证俄亥俄大学毕业证成绩单留信学历认证
 
group_15_empirya_p1projectIndustrial.pdf
group_15_empirya_p1projectIndustrial.pdfgroup_15_empirya_p1projectIndustrial.pdf
group_15_empirya_p1projectIndustrial.pdf
 
How to Be Famous in your Field just visit our Site
How to Be Famous in your Field just visit our SiteHow to Be Famous in your Field just visit our Site
How to Be Famous in your Field just visit our Site
 
Architecture case study India Habitat Centre, Delhi.pdf
Architecture case study India Habitat Centre, Delhi.pdfArchitecture case study India Habitat Centre, Delhi.pdf
Architecture case study India Habitat Centre, Delhi.pdf
 
Top 10 Modern Web Design Trends for 2025
Top 10 Modern Web Design Trends for 2025Top 10 Modern Web Design Trends for 2025
Top 10 Modern Web Design Trends for 2025
 
原版1:1定制堪培拉大学毕业证(UC毕业证)#文凭成绩单#真实留信学历认证永久存档
原版1:1定制堪培拉大学毕业证(UC毕业证)#文凭成绩单#真实留信学历认证永久存档原版1:1定制堪培拉大学毕业证(UC毕业证)#文凭成绩单#真实留信学历认证永久存档
原版1:1定制堪培拉大学毕业证(UC毕业证)#文凭成绩单#真实留信学历认证永久存档
 
NO1 Famous Amil Baba In Karachi Kala Jadu In Karachi Amil baba In Karachi Add...
NO1 Famous Amil Baba In Karachi Kala Jadu In Karachi Amil baba In Karachi Add...NO1 Famous Amil Baba In Karachi Kala Jadu In Karachi Amil baba In Karachi Add...
NO1 Famous Amil Baba In Karachi Kala Jadu In Karachi Amil baba In Karachi Add...
 

Advanced+management+accounting+ +nov+2008+rtp

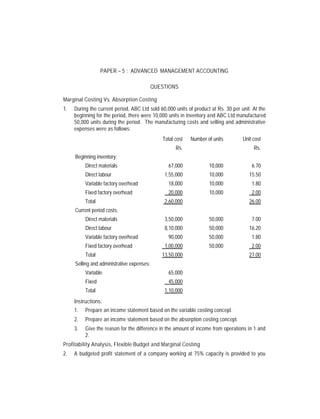
  • 1. PAPER – 5 : ADVANCED MANAGEMENT ACCOUNTING QUESTIONS Marginal Costing Vs. Absorption Costing 1. During the current period, ABC Ltd sold 60,000 units of product at Rs. 30 per unit. At the beginning for the period, there were 10,000 units in inventory and ABC Ltd manufactured 50,000 units during the period. The manufacturing costs and selling and administrative expenses were as follows: Total cost Number of units Unit cost Rs. Rs. Beginning inventory: Direct materials 67,000 10,000 6.70 Direct labour 1,55,000 10,000 15.50 Variable factory overhead 18,000 10,000 1.80 Fixed factory overhead 20,000 10,000 2.00 Total 2,60,000 26.00 Current period costs: Direct materials 3,50,000 50,000 7.00 Direct labour 8,10,000 50,000 16.20 Variable factory overhead 90,000 50,000 1.80 Fixed factory overhead 1,00,000 50,000 2.00 Total 13,50,000 27.00 Selling and administrative expenses: Variable 65,000 Fixed 45,000 Total 1,10,000 Instructions: 1. Prepare an income statement based on the variable costing concept. 2. Prepare an income statement based on the absorption costing concept. 3. Give the reason for the difference in the amount of income from operations in 1 and 2. Profitability Analysis, Flexible Budget and Marginal Costing 2. A budgeted profit statement of a company working at 75% capacity is provided to you
  • 2. 2 below, Sales 9,000 units at Rs. 32 Rs. 2,88,000 Less: Direct materials Rs. 54,000 Direct wages 72,000 Production overhead: fixed 42,000 variable 18,000 1,86,000 Gross profit 1,02,000 Less: Administration, selling and distribution costs: fixed 36,000 varying with sales volume 27,000 63,000 Net profit 39,000 You are required to: (a) Calculate the breakeven point in units and in value. (b) It has been estimated that: (i) if the selling price per unit were reduced to Rs. 28, the increased demand would utilise 90% of the company's capacity without any additional advertising expenditure, and (ii) to attract sufficient demand to utilise full capacity would require a 15% reduction in the current selling price and a Rs. 5,000 special advertising campaign. You are required to present a statement showing the effect of the two alternatives compared with the original budget and to advise management which of the three possible plans ought to be adopted, i.e., the original budget plan or (i) above or (ii) above. (c) An independent market research study shows that by spending Rs. 15,000 on a special advertising campaign, the company could operate at full capacity and maintain the selling price at Rs. 32 per unit. You are required to: (i) Advise management whether this proposal should be adopted. CVP Analysis 3. (a) ABC Ltd. expects to maintain the same inventories at the end of the year as at the beginning of the year. The estimated fixed costs for the year are Rs. 2,88,000, and
  • 3. 3 the estimated variable costs per unit are Rs. 14. It is expected that 60,000 units will be sold at a price of Rs. 20 per unit. Maximum sales within the relevant range are 70,000 units. Instructions: 1. What is (a) the contribution margin ratio and (b) the unit contribution margin? 2. Determine the break-even point in units. 3. What is the margin of safety? Standard Costing (b) Garland Company uses a standard cost system. The standard for each finished unit of product allows for 3 kgs of plastic at Rs. 0.72 per kg. During December, Garland bought 4,500 kgs of plastic at Rs. 075 per kg, and used 4,100 kgs in the production of 1,300 finished units of product. What is the material purchase price variance for the month of December ? Budget: Functional Budgets 4. Selected information concerning sales and production for ABC Ltd. for July, 2006 are summarised as follows: a. Estimated sales: Product K: 40,000 units at Rs. 30.00 per unit Product L: 20,000 units at Rs. 65.00 per unit b. Estimated inventories, July 1, 2006: Rs. Material A: 4,000 kgs. Product K: 3,000 units at Rs. 17 per unit 51,000 Material B: 3,500 kgs. Product L: 2,700 units at Rs. 35 per unit 94,500 Total 1,45,500 There were no work in process inventories estimated for July 1, 2006. c. Desired inventories at July 31, 2006: Rs. Material A: 3,000 kgs. Product K: 2,500 units at Rs. 17 per unit 42,500 Material B: 2,500 kgs. Product L: 2,000 units at Rs. 35 per unit 70,000 Total 1,12,500 There were no work in process inventories desired for July 31, 2006. d. Direct materials used in production: Product K Product L Material A: 0.7 kgs. per unit 3.5 kgs. per unit Material B: 1.2 kgs. per unit 1.8 kgs. per unit
  • 4. 4 e. Unit costs for direct materials: Material A: Rs. 4.00 per kg. Material B: Rs. 2.00 per kg. f. Direct labour requirements: Department 1 Department 2 Product K 0.4 hour per unit 0.15 hour per unit Product L 0.6 hour per unit 0.25 hour per unit g. Department 1 Department 2 Direct labour rate Rs. 12.00 per hour Rs. 16.00 per hour h. Estimated factory overhead costs for July: Rs. Indirect factory wages 2,00,000 Depreciation of plant and equipment 40,000 Power and light 25,000 Indirect materials 34,000 Total 2,99,000 Instructions: 1. Prepare a sales budget for July. 2. Prepare a production budget for July. 3. Prepare a direct materials purchases budget for July. 4. Prepare a direct labour cost budget for July. 5. Prepare a cost of goods sold budget for July. Standard Costing: Material, Labour and Factory Overhead Variance 5. ABC Ltd. manufactures Product S for national distribution in India. The standard costs for the manufacture of Product S were as follows: Standard Costs Actual Costs Direct materials 1,500 kgs at Rs. 35 1,600 kgs at Rs. 32 Direct labour 4,800 hours at Rs. 11 4,500 hours at Rs. 11.80 Factory overhead Rates per labour hour, based on 100% of normal capacity of 5,500 labour hours: Variable cost, Rs. 2.40 Rs. 12,300 variable cost Fixed cost, Rs. 3.50 Rs. 19,250 fixed cost
  • 5. 5 Instructions: 1. Determine the quantity variance, price variance, and total direct materials cost variance for Product S. 2. Determine the time variance, rate variance, and total direct labour cost variance for Product S. 3. Determine the controllable variance, volume variance, and total factory overhead cost variance for Product S. Standard Costing and Reconciliation 6. ABC Ltd. uses flexible budgets and standard costing for its single product PCM 30 produced at its factory at Solan. The following details relate to a particular months ‘Actual’ & also provide brief details of ‘Standards’ established, Standard Quantity required for producing 1 unit of PCM 30 3 Kgs Standard cost of the raw material Rs 4.40 per kg Cost of actual material purchased and used in the relevant Rs 3,36,000 month Actual price paid for the raw material in the relevant month Rs 4.20 per kg Standard labour time required to produce 1 unit of PCM 30 30 minutes Standard wage rate Rs 5 per hour Actual wage rate Rs 5.40 per hour Sufficient direct labour time, equivalent for producing 28,000 units of PCM 30 was utilised, although the actual production in the relevant month was only 25,000 units. The company has a normal operating capacity of 15,000 hours per month and flexible overhead budgets are: Hours of operation 12,500 14,000 15,000 Variable production overhead Rs. 1,50,000 Rs. 1,68,000 Rs. 1,80,000 Fixed production overhead 2,70,000 2,70,000 2,70,000 Total 4,20,000 4,38,000 4,50,000 Actual fixed overheads incurred did not deviate from the budgeted amounts. However, the variable overheads incurred amounted to Rs 1,60,000 in the concerned month. You are required to calculate the appropriate variances for material, labour and overhead; Target Costing 7. You are the manager of a paper mill (XYZ Ltd) and have recently come across a particular type of paper, which is being sold at a substantially lower rate (by another company –ABC Ltd) than the price charged by your own mill. The value chain for one use
  • 6. 6 of one tonne of such paper for ABC Ltd is as follows, ABC Ltd. Merchant Printer Customer ABC Ltd sells this particular paper to the merchant at the rate of Rs 1,466 per tonne. ABC Ltd pays for the freight which amounts to Rs 30 per tonne. Average returns and allowances amount to 4% of sales and approximately equals Rs 60 per tonne. The value chain of your company, through which the paper reaches the ultimate customer is similar to the one of ABC Ltd. However, your mill does not sell directly to the merchant, the latter receiving the paper from a huge distribution center maintained by your company at Haryana. Shipment costs from the mill to the Distribution Center amount to Rs 11 per tonne while the operating costs in the Distribution Center have been estimated to be Rs 25 per tonne. The return on investments required by the Distribution Center for the investments made amount to an estimated Rs. 58 per tonne. You are required to compute the “Mill manufacturing Target Cost” for this particular paper for your company. You may assume that the return on the investment expected by your company equals Rs. 120 per tonne of such paper. Differential Costing 8. ABC Ltd recently began production of a new product, M, which required the investment of Rs. 16,00,000 in assets. The costs of producing and selling 80,000 units of Product M are estimated as follows: Rs. Variable costs: Direct materials 10.00 per unit Direct labour 6.00 Factory overhead 4.00 Selling and administrative expenses 5.00 Total 25.00 per unit Fixed costs: Factory overhead 8,00,000 Selling and administrative expenses 4,00,000 ABC Ltd is currently considering establishing a selling price for Product M. The President of ABC Ltd has decided to use the cost-plus approach to product pricing and has indicated that Product M must earn a 10% rate of return on invested assets. Instructions: 1. Determine the amount of desired profit from the production and sale of Product M. 2. Assuming that the total cost concept is used, determine (a) the cost amount per
  • 7. 7 unit, (b) the markup percentage, and (c) the selling price of Product M. 3. Assuming that the product cost concept is used, determine (a) the cost amount per unit, (b) the mark up percentage, and (c) the selling price of Product M. 4. Assuming that the variable cost concept is used, determine (a) the cost amount per unit, (b) the markup percentage, and (c) the selling price of Product M. 5. Assume that for the current year, the selling price of Product M was Rs. 42 per unit. To date, 60,000 units have been produced and sold, and analysis of the domestic market indicates that 15,000 additional units are expected to be sold during the remainder of the year. Recently, ABC Ltd received an offer from XYZ Ltd for 4,000 units of product M at Rs. 28 each. XYZ Ltd. will market the units in Korea under its own brand name, and no additional selling and administrative expenses associated with the sale will be incurred by ABC Ltd. The additional business is not expected to affect the domestic sales of Product M, and the additional units could be produced during the current year, using existing capacity. (a) Prepare a differential analysis report of the proposed sale to XYZ Ltd (b) Based upon the differential analysis report in (a), should the proposal be accepted? CVP Analysis and Decision Making 9. ABC Ltd. manufactures three prototype toy furniture products – chairs, benches and tables. The budgeted unit cost and resource requirements of each item is detailed below: Chair Bench Table Rs. Rs. Rs. Timber cost 5.00 15.00 10.00 Direct labour cost 4.00 10.00 8.00 Variable overhead cost 3.00 7.50 6.00 Fixed overhead cost 4.50 11.25 9.00 16.50 43.75 33.00 Budgeted volumes per annum 4,000 2,000 1,500 These volumes are believed to equal the market demand for these products. The fixed overhead costs are attributed to the three products on the basis of direct labour hours. The labour rate is Rs. 4.00 per hour. The cost of the timber is Rs. 2.00 per square metre. The products are made from a specialist timber. A memo from the purchasing manager advises you that because of a problem with the supplier, it is to be assumed that this specialist timber is limited in supply to 20,000 square metres per annum. The sales manager has already accepted an order for 500 chairs, 100 benches and 150 tables which if not supplied would incur a financial penalty of Rs. 2,000. These quantities
  • 8. 8 are included in the market demand estimates above. The selling prices of the three products are: Rs. Chair 20.00 Bench 50.00 Table 40.00 Requirements: (a) Determine the optimum production plan and state the net profit that this should yield per annum. (b) Calculate and explain the maximum prices which should be paid per square metre in order to obtain extra supplies of the timber. Pricing Decisions 10. ABC Ltd is in the business of publishing, printing and distributing a range of catalogues and other manuals. The management have now decided to discontinue printing and distribution and concentrate solely on publishing. Instead of ABC Ltd, XYZ Ltd shall now print and distribute the range of catalogues and other manuals. This shall be done on behalf of ABC Ltd . commencing either at 30 June 2007 or 30 November, 2007. XYZ Ltd will receive Rs. 65,000 per month for a contract which will commence either at 30 June, 2007 or 30 November 2007. The results of ABC Ltd for a typical month are as follows: Publishing Printing Distribution Rs. ’000 Rs. ’000 Rs. ’000 Salaries and wages 28 18 4 Materials and supplies 5.5 31 1.1 Occupancy costs 7 8.5 1.2 Depreciation 0.8 4.2 0.7 Information related to the possible closure proposals is as follows: (i) Two specialist staff from printing will be retained at their present salary of Rs. 1,500 each per month in order to fulfill a link function with XYZ Ltd One further staff member will be transferred to publishing to fill a staff vacancy through staff turnover, anticipated in July. This staff member will be paid at his present salary of Rs. 1,400 per month which is Rs. 100 more than that of the staff member who is expected to leave. On closure all other printing and distribution staff will be made redundant and paid an average of two months redundancy pay. (ii) The printing department has a supply of materials (already paid for) which cost Rs. 18,000 and which will be sold to XYZ Ltd. for Rs. 10,000 if closure takes place on 30 June, 2007. Otherwise the material will be used as part of the July 2007 printing
  • 9. 9 requirements. The distribution department has a contract to purchase pallets at a cost of Rs. 5000 per month for July and August, 2007. A cancellation clause allows for non-delivery of the pallets for July and August for a one-off payment of Rs. 300. Non-delivery for August only will require a payment of Rs. 100. If the pallets are taken from the supplier, XYZ Ltd has agreed to purchase them at a price of Rs. 380 for each month’s supply which is available. Pallet costs are included in the distribution material and supplies cost stated for a typical month. (iii) Company expenditure on apportioned occupancy costs to printing and distribution will be reduced by 15% per month if printing and distribution departments are closed. At present, 30% of printing and 25% of distribution occupancy costs are directly attributable costs which are avoidable on closure, whilst the remainder are apportioned costs. (iv) Closure of the printing and distribution departments will make it possible to sub–let part of the building for a monthly fee of Rs. 2,500 when space is available. (v) Printing plant and machinery has an estimated net book value of Rs. 48,000 at 30 June, 2007. It is anticipated that it will be sold at a loss of Rs. 21,000 on 30 June, 2007. If sold on 30 November, 2007 the prospective buyer will pay Rs. 25,000. (vi) The net book value of distribution vehicles at 30 June, 2006 is estimated as Rs. 80,000. They could be sold to the original supplier at Rs. 48,000 on 30 June, 2006. The original supplier would purchase the vehicles on 30 November, 2006 for a price of Rs. 44,000. Required: Using the above information, prepare a summary to show whether ABC Ltd. should close the printing and distribution departments on financial grounds on 30 June, 2006 or on 30 November, 2006. Explanatory notes and calculations should be shown. Ignore taxation. 11. (a) Describe the concept of Back flushing as used in a JIT system. What problems need to be addressed before implementing such a concept? Briefly discuss. (b) “Skimming pricing is a policy where the prices are kept high during the early period of a product’s existence”. Discuss briefly the reasons for following such a policy. 12. Discuss briefly your understanding of a Balanced Scorecard? What are its advantages ? 13. (a) "Costs may be classified in a variety of ways according to their nature and the information needs of the management." Explain. (b) Indicate the major areas of short-term decisions in which differential cost analysis is useful. (c) "Relevant cost analysis helps in drawing the attention of managers to those elements of cost which are relevant for the decision." Comment. 14. (a) Indicate the possible disadvantages of treating divisions as profit centres (b) Explain the role of bench marking in continuous improvement in an organisation.
  • 10. 10 Cost Sheet and Standard Costing 15. ABC Ltd manufactures a product ‘1+7 ASCS’ at its plant at Faridabad, the maximum capacity of which is 200 units per month. Details of raw material which go into the making of 1 unit of ‘1+7 ASCS’ are provided to you below; S. No. Raw Material Standard quantity per Standard purchase description finished unit (No) price per unit (Rs 00) 1 A 1 6 2 B 2 5 3 C 3 4 4 D 4 3 5 E 5 2 6 F 6 1 Standard Fixed overheads are Rs 20,00,000 per month whereas the standard variable overhead rate has been estimated as equal to Rs 1,400 per unit of finished good. You are required to compute the (a) standard cost of the product (b) compute the production volume variance in case the company produces and sells only 100 units of finished goods in the concerned month. (c) compute the usage and material price variances considering the following actual data(actual production and sale: 100 units) Raw material description Actual quantity consumed Actual price(Rs 00) (Nos) A 102 7 B 201 6 C 310 5 D 415 4 E 540 3 F 610 2 16. (a) Explain the concept ‘Learning curve’. How can it be applied for Cost management? Profitability Analysis and Learning Curve (b) An electronics firm which has developed a new type of fire-alarm system has been asked to quote for a prospective contract. The customer requires separate price
  • 11. 11 quotations for each of the following possible orders: Order Number of fire-alarm systems First 100 Second 60 Third 40 The firm estimates the following cost per unit for the first order: Direct materials Rs. 500 Direct labour Deptt. A (Highly automatic) 20 hours at Rs. 10 per hour Deptt. B (Skilled labour) 40 hours at Rs. 15 per hour Variable overheads 20% of direct labour Fixed overheads absorbed: Deptt. A Rs. 8 per hour Deptt. B Rs. 5 per hour Determine a price per unit for each of the three orders, assuming the firm uses a mark up of 25% on total costs and allows for an 80% learning curve. Extract from 80% Learning curve table: X 1.0 1.3 1.4 1.5 1.6 1.7 1.8 1.9 2.0 Y% 100.0 91.7 89.5 87.6 86.1 84.4 83.0 81.5 80.0 X represents the cumulative total volume produced to date expressed as a multiple of the initial order. Y is the learning curve factor, for a given X value, expressed as a percentage of the cost of the initial order. Cost Sheet and Reporting 17. Jimmedar Works ltd has at the factory three Production Departments, Machine Shop, Fabrication and Assembly which are the responsibility of the shop Superintendent. The Shop Superintendent along with Materials Manger, Planning Superintendent and Maintenance Engineer Report to the Works Manager at the factory. The office administration, sales and publicity come under the Sales Manager who along with the Works Manger report to the Managing Director of the company. The following data relating to a month’s performance are called out from the books of the company. Budget (Rs.) Variance from Budget Sales commission 800 Rs. 50 A Raw Material and Components – Machine shop 900 20 A Publicity Expenses 1100 100 A
  • 12. 12 Printing and Stationery 3200 200 F Travelling expenses 4000 200 A Wages – Machine shop 800 10 F – Fabrication 600 20 A – Assembly 720 10 A Material – Assembly 760 40 A – Fabrication 460 10 A Utilities – Assembly Shop 320 10 A – Assembly 470 60 F – Fabrication 560 30 F – Maintenance 400 20 A – Stores 210 40 F – Planning 180 20 A Shop Superintendent’s Office – Salaries and Expenses 1100 22 F Depreciation – Factory 3880 40 A Works Manager’s Office Expenses 3810 40 A General Office Salaries and Administration 4270 30 A Managing Director’s Salary and Administration 2800 20 F (A = Adverse, F = Favourable) (i) Treating the Machine Shop, Fabrication and Assembly as Cost Centres, prepare Cost Sheets for each centre with the help of the this additional information: The Shop Superintendent devotes his time amongst Machine Shop, Fabrication and Assembly in the ratio 4:3: 4. Other Factory Overheads are absorbed on the basis of Direct Labour in each Cost Centre. Office, Administration, Selling and Distribution Overheads are, borne equally by the Cost Centres. (ii) Treating the Machine Shop, Fabrication and Assembly as Responsibility Centres, prepare a Responsibility Accounting report for the Shop Superintendent. Standard Costing 18. A company using a standard costing system furnishes the following statement showing the details relating to a month. Budget Actual Product and sales volume in units 10000 9000 Selling price per unit Rs.60.00 61.50
  • 13. 13 Costs for the month: Direct materials Rs.2,50,000 2,57,400 Direct wages Rs.2,25,000 2,20,500 Variable overheads Rs.10,000 9,250 Fixed overheads Rs.25,000 23,240 Direct labour hours 50,000 42,000 Per unit data: Direct materials kg/unit 25 26 Direct materials price/ kg Rs.1.00 1.10 Direct labour hours / unit 5 4.5 Direct labour rate / hour Rs.4.50 5.25 You are required to compute all variances and reconcile the budgeted profit with actual profit. Relevant Costing 19. ABC Ltd has been approached by a customer who would like a special job to be done for him, and who is willing to pay Rs. 22,000 for it. The job would require the following materials. Material Total units Units already Book value of Realisable Replacement required in stock units in stock value Rs. /unit cost Rs./unit Rs./unit A 1,000 0 6 B 1,000 600 2 2.50 5 C 1,000 700 3 2.50 4 D 200 200 4 6.00 9 Material B is used regularly by ABC Ltd, and if units of B are required for this job, they would need to be replaced to meet other production demand. Material C and D are in stock as the result of previous over-buying, and they have a restricted use. No other use could be found for material C, but the units of material D could be used in another job as substitute for 300 units of material E, which currently costs Rs. 5 per unit (of which the company has no units in stock at the moment). Calculate the relevant costs of material for deciding whether or not to accept the order. Application of Cost Concept 20. ABC Ltd plans to use activity-based costing to determine it product costs. It presently, uses a single plantwide factory overhead rate for allocating factory overhead to products,
  • 14. 14 based on direct labour hours. The total factory overhead cost is as follows: Department Factory overhead Rs. Production Support 12,25,000 Production (factory overhead only) 1,75,000 Total cost 14,00,000 The Company determined that it performed four major activities in the Production Support Department. These activities, along with their budgeted costs, are as follows: Production Support Activities Budgeted Cost Rs. Set up 4,28,750 Production control 2,45,000 Quality control 1,83,750 Materials management 3,67,500 Total 12,25,000 ABC Ltd estimated the following activity-base usage quantities and units produced for each of its three products: Products Number of Direct Labour Setups Production Inspections Material Units hours Orders requisitions Product K 10,000 25,000 80 80 35 320 Product L 2,000 10,000 40 40 40 400 Product M 50,000 1,40,000 5 5 0 30 Total cost 62,000 1,75,000 125 125 75 750 Instructions: 1. Determine the factory overhead cost per unit for Products K, L and M under the single plantwide factory overhead rate method. Use direct labor hours as the activity base. 2. Determine the factory overhead cost per unit for Products K, L and M under activity- based costing. 3. Which method provides more accurate product costing? Why? Linear Programming 21. A firm manufactures two types of products A and B and sells them at a profit of Rs.2 on type A and Rs. 3 on type B. Each product is processed on 2 machines G and H. Type A requires 1 minute of processing time on G and 2 minutes on H. Type B requires 1 minute
  • 15. 15 on G and 1 minute on H. The machine G is available for not more than 6 hours 40 minutes, while machine H is available for 10 hours during any working day. Formulate the problem as a L.P.P. and solve by using graphical method. Linear Programming 22. Using simplex method to solve the following L.P.P. Max Z = x1 + 2x2 + 3x3 – x4 Subject to x1 + 2x2 + 3x3 = 15 2x1 + x2 +5x3 = 20 x1 + 2x2 + x3 + x4 = 10 x1 , x2 , x3 , x4 > 0. Transportation Problem 23. Solve the following transportation problem. 1 2 3 4 5 Stock available 1 73 40 9 79 20 8 2 62 93 96 8 13 7 3 96 65 80 50 65 9 4 57 58 29 12 87 3 5 56 23 87 18 12 5 Demand 6 8 10 4 4 The Assignment Problem 24. A company is faced with the problem of assigning six different machine to 5 different jobs. The cost are estimated as follows (hundred of rupees). Jobs Machine 1 2 3 4 5 1 2.5 5 1 6 1 2 2 5 1.5 7 3 3 3 6.5 2 8 3 4 3.5 7 2 9 4.5 5 4 7 3 9 6 6 6 9 5 10 6 Solve the problem assuming that the objective is to minimize total cost.
  • 16. 16 Critical Path Analysis and PERT 25. The project has the following characteristics. Activity Preceding Activity Expected Completion Time (in weeks) A None 5 B A 2 C A 6 D B 12 E D 10 F D 9 G D 5 H B 9 I C, E 1 J G 2 K F, I, J 3 L K 9 M H, G 7 N M 8 (a) Draw a PERT network for this project. (b) Find the critical path and the project completion time. (c) Prepare on activity schedule showing ES, EF, LS, LF, and slack for each activity. (d) Will the critical path change if activity G takes 10 weeks instead of 5 weeks? If so, what will be the new critical path? Critical Path Analysis and PERT 26. A project consists of nine activities whose time estimates (in weeks) and other characteristics are given below. Activity Preceding Time estimates (weeks) activity(ies) Most optimistic Most likely Most pessimistic A – 2 4 6 B – 6 6 6 C – 6 12 24 D A 2 5 8 E A 11 14 23 F B, D 8 10 12
  • 17. 17 G B, D 3 6 9 H C, F 9 15 27 I E 4 10 16 (i) Show the PERT network for the project. (ii) Identify the critical activities. (iii) What is the expected project completion time and its variance? Simulation 27. An investment company wants to study the investment projects based on market demand, profit and the investment required, which are independent of each other. Following probability distributions are estimated for each of these three factors: Annual demand 25 30 35 40 45 50 55 (Units in thousands) Probability 0.05 0.10 0.20 0.30 0.20 0.10 0.05 Profit per Unit 3.00 5.00 7.00 9.00 10.00 Probability 0.10 0.20 0.40 0.20 0.10 Investment required (in 2750 3000 3500 thousands of Rupees) Probability 0.25 0.50 0.25 Using simulation process, repeat the trial 10 times, compute the investment on each trial taking these factors into trial what is the most likely return? Use the following random numbers: (30, 12, 16); (59, 09, 69); (63, 94, 26); (27, 08, 74); (64, 60, 61); (28, 28, 72); (31, 23, 57); (54, 85, 20); (64, 68, 18); (32, 31, 87). In the bracket above, the first random number is for annual demand, the second one is for profit and the last one is for the investment required. Time Series Analysis and Forecasting 28. Below are given the figures of production (in thousand quintals) of a sugar factory. Year Production (thousand quintals) 1993 77 1995 88 1996 94
  • 18. 18 1997 85 1998 91 1999 98 2002 90 (i) Fit a straight line by the 'least squares' method and tabulate the trend values. (ii) Eliminate the trend. What components of the series are thus left over? (iii) What is monthly increase in the production of sugar? Time Series Analysis and Forecasting 29. Calculate 5 yearly and 7 yearly moving averages for the following data of the numbers of commercial and industrial failure in a country during 1987 to 2002. Year No. of failures 1987 23 1988 26 1989 28 1990 32 1991 20 1992 12 1993 12 1994 10 1995 9 1996 13 1997 11 1998 14 1999 12 2000 9 2001 3 2002 1 Also plot the actual and trend values on a graph. Testing of Hypothesis (chi – square – test) 30. The contingency table below summarize the results obtained in a study conducted by a research organization with respect to the performance of four competing brands of tooth paste among the users
  • 19. 19 Brand A Brand B Brand C Brand D Total No. of Cavities 9 13 17 11 50 One of five 63 70 85 82 300 More than five 28 37 48 37 150 Total 100 120 150 130 500 Test the hypothesis that incidence of cavities is independent of the brand of the tooth paste used. Use level of significance 1% and 5%. Testing of Hypothesis (ANOVA) 31. Below are given the yield (in kg.) per acre for 5 trial plots of 4 varieties of treatment. Carry out an analysis of variance and state conclusion Treatment Plot no. 1 2 3 4 1 42 48 68 80 2 50 66 52 94 3 62 68 76 78 4 34 78 64 82 5 52 70 70 66 Testing of Hypothesis (t – test) 32. The sales data of an item in six shops before and after a special promotional compaign are as under Shops A B C D E F Before Compaign 53 28 31 48 50 42 After Compaign 58 29 30 55 56 45 Can the compaign be judged to be a success? Test at 5% level of significance using t-test. SUGGESTED ANSWERS/HINTS 1. Variable Costing Income Statement Rs. Rs. Sales (60,000 Rs. 30) 18,00,000 Variable cost of goods sold: Beginning inventory (10,000 Rs. 24) 2,40,000
  • 20. 20 Variable cost of goods manufactured (50,000 Rs. 25) 12,50,000 Variable cost of goods sold 14,90,000 Manufacturing margin 3,10,000 Variable selling and administrative expenses 65,000 Contribution margin 2,45,000 Fixed Costs: Fixed manufacturing costs 1,00,000 Fixed selling and administrative expenses 45,000 1,45,000 Income from operations 1,00,000 Absorption Costing Income Statement Rs. Rs. Sales (60,000 Rs. 30) 18,00,000 Cost of goods sold: Beginning inventory (10,000 Rs. 26) 2,60,000 Cost of goods manufactured (50,000 Rs. 27) 13,50,000 Cost of goods sold 16,10,000 Gross profit 1,90,000 Selling and administrative expenses (Rs. 65,000 + Rs. 45,000) 1,10,000 Income from operations 80,000 2. (a) Contribution and Profitability Analysis Total Per unit Sales* Rs. 2,88,000 Rs. 32 Less: Variable costs Direct material 54,000 6 Direct wages 72,000 8 Production Overheads 18,000 2 Admn, S & D OH 27,000 3 1,71,000 19 Contribution 1,17,000 13 Less: Fixed Overheads Production 42,000 Admn, S & D 36,000 78,000 Net Profit 39,000 *Capacity utilisation: 75% P/V Ratio = (S – V)/S 100 = 40.625%
  • 21. 21 BE Sales = Fixed costs P/V Ratio = 78,000 40.625% = Rs. 1,92,000 or 1,92,000 Rs. 32 = 6,000 Units (b) Production 90% Capacity 100% Capacity (10,800 Units) (12,000 Units) Selling price per unit Rs. 28 Rs. 27.20 Variable cost per unit 19 19.00 Contribution per unit 9 8.20 P/V Ratio 32.143% 30.147% Total contribution 97,200 98,400 Less Fixed Overheads 78,000 83,000 19,200 15,400 The P/V Ratio has gone down to 32.143% in the case of alternative b(i) and to 30.147% in alternative b(ii). Therefore the company should follow the original plan as at (a) above (c) (i) Selling price per unit Rs. 32 Less Variable costs 19 Contribution per unit 13 Total contribution (12,000 Rs 13) 1,56,000 Less: fixed costs 93,000 Profit 63,000 This proposal may be expected as there is a considerable increase in the profits. Sales Variable costs 3. (a) 1. (a) Contribution margin ratio Sales (60,000 units Rs. 20) (60,000 units Rs. 14) Contribution margin ratio (60,000 units Rs. 20) Rs. 1,2 0,000 Rs. 8,40,000 Rs. 3,60,000 Contribution margin ratio Rs. 12,00,000 Rs. 12,00,000 Contribution margin ratio = 30% (b) Unit contribution margin = Unit selling price – Unit variable costs Unit contribution margin = Rs. 20 – Rs. 14 = Rs. 6
  • 22. 22 Fixed costs 2. Break - even sales (units) Unit contribution margin Rs. 2,88 ,000 Break - even sales (units) 48,000 units Rs. 6 3. Margin of safety: Rs. Expected sales (60,000 units Rs. 20) 12,00,000 Break-even point (48,000 units Rs. 20) 9,60,000 Margin of safety 2,40,000 Or Sales Sales at break - even point Margin of safety Sales Rs. 2,40 ,000 Margin of safety 20% Rs. 12,00,000 (b) (Standard price – actual price) × number of kgs purchased (Rs 0.72 – 0.75) × 4,500 kgs = Rs 135 unfavourable 4. 1. ABC Ltd Sales Budget for the Month ending July 31, 2006 Product Unit Sales Unit Selling Price Total Sales Volume Rs. Rs. Product K 40,000 30.00 12,00,000 Product L 20,000 65.00 13,00,000 Total revenue from sales 25,00,000 2. ABC Ltd. Production Budget for the Month ending July 31, 2006 Units Product K Product L Sales 40,000 20,000 Plus desired inventories at July 31, 2006 2,500 2,000
  • 23. 23 Total 42,500 22,000 Less: Estimated inventories, July 1, 2006 3,000 2,700 Total production 39,500 19,300 3. ABC Ltd Direct Materials Purchases Budget for the Month ending July 31, 2006 Direct Materials Material A Material B Total Units required for production: Product K (39,500 lbs. per unit) 27,650 kgs* 47,400 * Product L (19,300 lbs. per unit) 67,550 kgs** 34,740 ** Plus desired units of inventory July 31, 2006 3,000 2,500 Total 98,200 kgs. 84,640 kgs, Less estimated units of inventory July 1, 2006 4,000 3,500 Total units to be purchased 94,200 kgs. 81,140 kgs. Unit price .... ...... ......... .....Rs.4.00 Rs.2.00 ___________ Total direct materials purchases Rs. 3,76,800 Rs. 1,62,280 Rs. 5,39,080 *27,650 = 39,500 0.7 47,400 = 39,500 1.2 **67,550 = 19,300 3.5 34,740 = 19,300 1.8 4. ABC Ltd Direct Labour Cost Budget for the Month ending July 31, 2006 Department 1 Department 2 Total Hours required for production: Product K (39,500 hours per unit) 15,800* 5,925* Product L (19,300 hours per unit) 11,580** 4,825** Total 27,380 10,750 Hourly rate Rs.12.00 Rs.16.00 Total Rs.3,28,560 Rs.1,72,000 Rs. 5,00,560 *15,800 = 39,500 0.4 5,925 = 39,500 0.15 **11,580 = 19,300 0.6 4,825 = 19,300 0.25
  • 24. 24 5. ABC Ltd Cost of Goods sold Budget for the Month ending July 31, 2006 Rs. Rs. Finished goods inventory, July 1, 2006 1,45,500 Direct materials: Direct materials inventory, July 1, 2006 (Note A) 23,000 Direct materials purchases 5,39,080 Cost of direct materials available for use 5,62,080 Less: Direct materials inventory, July 31, 2006 (Note B) 17,000 Cost of direct materials placed in production 5,45,080 Direct labour 5,00,560 Factory overhead 2,99,000 Cost of goods manufactured 13,44,640 Cost of finished goods available for sale 14,90,140 Less: Finished goods inventory, July 31, 2006 1,12,500 Cost of goods sold 13,77,640 Note A: Rs. Material A 4,000 kgs. at Rs. 4.00 per kg. 16,000 Material B 3,500 kgs. at Rs. 2.00 per kg. 7,000 Direct materials inventory, July 1, 2006 23,000 Note B: Rs. Material A 3,000 kgs. at Rs. 4.00 per kg. 12,000 Material B 2,500 kgs. at Rs. 2.00 per kg. 5,000 Direct materials inventory, July 31, 2006 17,000 5. 1. Direct Materials Cost Variance Quantity Variance: Actual quantity 1,600 kgs Standard quantity 1500 kgs Variance – unfavourable 100 kgs × Std price, Rs 35 Rs. 3,500 Price Variance: Actual price Rs. 32.00 per kg
  • 25. 25 Standard price 35 Variance – favourable Rs(300) per kg × Actual Qty, 1600 (4,800) Total direct materials cost variance - favourable Rs. (1,300) 2. Direct Labour Cost Variance Time Variance: Actual time 4,500 hours Standard time 4,800 hours Variance – favourable (300 hours) × Std rate, Rs 11 Rs. (3,300) Rate Variance: Actual rate Rs. 11.80 Standard rate 11.00 Variance – unfavourable Rs 0.80 per hr × Actual time, 4500 hours 3,600 Total direct labour cost variance - unfavourable Rs. 300 3. Factory Overhead Cost Variance Variable factory overhead – controllable variance: Actual variable factory overhead cost incurred Rs. 12,300 Budgeted variable factory overhead for 4,800 11,520* hours Variance – unfavourable Rs. 780 Fixed factory overhead – volume variance: Budgeted hours at 100% of normal capacity 5,500 hours Standard hours for actual production 4,800 Productive capacity not used 700 hours Standard fixed factory overhead cost rate Rs. 3.50 hours Variance – unfavourable 2,450 Total factory overhead cost variance – unfavourable Rs. 3,230 *4,800 hours Rs. 2.40 = Rs. 11,520 6. Standard Variable O.H. rate = Rs. 1,80,000 15,000 = Rs. 12 per hr. Standard Fixed OH rate = 2,70,000 15,000 = Rs.1 8 per hr.
  • 26. 26 Material Variances (Actual Production : 25,000 Units) St Qty of Std Price Std Qty of Actual Qty Actual Usage Price RM /FG of RM/kg RM on of RM on Price Variance(Rs) Variance(Rs) Actual Actual paid for Production Production RM (a) (b) (c) (d) (e) ( c – d) b (b – e) d 3 kg Rs 4.40 75,000 kgs 80,000 Rs 4.20 ( 22,000) 16,000 Labour Variances St time / Std rate Std time on Actual time Actual rate Efficiency Rate FG per Actual on Actual per hour Variance(Rs) Variance(Rs) hour Production Production (a) (b) (c) (d) (e) ( c – d) b (b – e) d 30 min Rs 5 12,500 hrs 14,000 hrs Rs 5.4 (7,500) (5,600) Variable Overhead Variances Actual variable overhead = Rs. 1,60,000 (a) Budgeted variable overhead = Rs. 1,68,000 (b) (28,000 0.5 hr Rs. 12) Standard Variable O.H. for actual production = Rs. 1,50,000 (c) (25,000 units 0.5 hr Rs. 12) Variable O.H. Expenditure variance = (a) – (b) = Rs. 1,60,000 Rs. 1,68,000 = Rs. 8,000 (F) Variable O.H. Efficiency variance = (b) – (c) = Rs. 1,68,000 Rs. 1,50,000 = Rs. 18,000 (A) Fixed Overhead Variances Actual fixed overhead incurred = Rs. 2,70,000 Budgeted Fixed Overhead = Rs. 2,70,000 Expenditure Variance = Nil Budgeted production = 28,000 Units Actual production = 25,000 Units Unutilised capacity = 3,000 Units or 1,500 Hrs Production volume variance = 1,500 Hrs Rs 18 per hr = (Rs 27,000) Note : For calculating production volume variance, normal operating capacity of 15,000 hours can also be used. In that case, budgeted production will be 30,000 units.
  • 27. 27 7. Computation of Target Cost Per tonne (in Rs) ABC Ltd selling price to the merchant 1,466 Less freight paid by ABC Ltd ( 30) Less normal sales returns and allowances ( 60) XYZ Ltds Capital charge (120) Target cost for XYZ Ltd 1,256 Ship to Distribution Centre (11) Distribution Centre operating cost (25) Subtotal 1,220 Distribution centre capital charge (58) Mill target manufacturing cost 1,162 8. 1. Rs. 1,60,000 (Rs. 16,00,000 10%) 2. a. Total costs: Rs. Variable (Rs. 25 80,000 units) 20,00,000 Fixed (Rs. 8,00,000 + Rs. 4,00,000) 12,00,000 Total 32,00,000 Cost amount per unit: Rs. 32,00,000 ÷ 80,000 units = Rs. 40.00 Desired profit b. Markup percentage Total costs Rs. 1,60,000 Markup percentage 5% Rs. 32,00,000 c. Rs. Cost amount per unit 40.00 Markup (Rs. 40 5%) 2.00 Selling price 42.00 3. a. Total manufacturing costs: Rs. Variable (Rs. 20 80,000 units) 16,00,000 Fixed factory overhead 8,00,000 Total 24,00,000
  • 28. 28 Cost amount per unit: Rs. 24,00,000 ÷ 80,000 units = Rs. 30.00 Desired profit Total selling and administrative expenses b. Markup percentage Total manufacturing costs Rs. 1,60,000 Rs. 4,00,000 (Rs. 5 80,000 units) Markup percentage Rs. 24,00,000 Rs. 1,60,000 Rs. 4,00,000 Rs. 4,00,000 Markup percentage Rs. 24,00,000 Rs. 9,60,000 Markup percentage 40% Rs. 24,00,000 c. Rs. Cost amount per unit 30.00 Markup (Rs. 30 40%) 12.00 Selling price 42.00 4. a. Variable cost amount per unit : Rs. 25 Total variable costs: Rs. 25 80,000 units = Rs. 20,00,000 Desired profit Total fixed costs b. Markup percentage Total variable costs Rs. 1,60,000 Rs. 8,00,000 Rs. 4,00,000 Markup percentage Rs. 20,00,000 Rs. 13,60,000 Markup percentage 68% Rs. 20,00,000 c. Rs. Cost amount per unit 25.00 Markup (Rs. 25 68%) 17.00 Selling price 42.00
  • 29. 29 5. a. Proposal to Sell to XYZ Ltd. Rs. Differential revenue from accepting offer: Revenue from sale of 4,000 additional units at Rs. 28 1,12,000 Differential cost from accepting offer: Variable production costs of 4,000 additional units at Rs. 20 80,000 Differential income from accepting offer 32,000 b. The proposal should be accepted. 9. (a) Production plan and net profit Timber required Square metres Budgeted volume Requirement (square metres) (a) (b) (a b) Chair Rs. (5 2) = 2.5 4,000 10,000 Bench Rs. (15 2) = 7.5 2,000 15,000 Table Rs. (10 2) = 5.0 1,500 7,500 32,500 Therefore, there is a shortfall of 12,500 square metres. Chair Bench Table Unit contribution Rs. 8.00 Rs. 17.50 Rs. 16.00 Timber requirement (square metres) 2.5 7.5 5.0 Contribution per square metre Rs. 3.20 Rs. 2.33 Rs. 3.20 Ranking 1st = 3rd = 1st = Production plan Square metres Contribution Rs 4,000 chairs (inclusive of 500 firm orders) 10,000.0 32,000.00 1,500 tables (inclusive of 150 firm orders) 7,500.0 24,000.00 333 benches (inclusive of 100 firm orders) 2,500.0 5,825.00 20,000.0 61,825.00 Fixed overhead (Rs18,000 + Rs22,500 + Rs13,500) 54,000.00 Profit 7,825.00
  • 30. 30 (b) Since the optimum production plan in part (a) indicates that demand for chairs and tables is satisfied by production, any additional timber would be utilized to manufacture benches. Each square metre used on a bench contributes Rs2.33 (see part (a) after charging the present cost of timber (Rs. 2 per square metre). Therefore the maximum price to be paid is Rs2.33 + Rs2 = Rs 4.33 per square metre. Unsatisfied demand = (2,000 333) 1,667 benches. Timber required is 1,667 7.5 square metres = 12,502.5 square metres, less the 2.5 square metres still available from the original supplier = 12,500 square metres. 10. The costs/benefits of closing on 30 November, 2006 instead of closing on 30 June, 2006 are: Rs. Rs. Payments to XYZ Ltd avoided (5 months @ Rs. 65,000) 3,25,000 *Salaries and wages cost (5 months @ (Rs. 18,000 + Rs. 4,000 – Rs. 3,000 + Rs. 1,300) (1,01,500) **Printing materials (5 months @ Rs. 31,000) – Rs. 18,000 + Rs. 10,000) (1,47,000) ***Distribution materials (5,280) Occupancy costs ****Printing 17,212.50 *****Distribution 2,175.00 (19,387.50) Loss of sub-letting income (5 months @ Rs. 2,500) (12,500) ******Additional loss on sale of plant (2,000) Additional loss on sale of vehicles (Rs. 48,000 – Rs. 44,000) (4,000) Net benefit of closing on 30 November 33,332.50 The plant should remain open until 30 November. * The total salaries equal Rs. 22,000 (Rs. 18,000 + Rs. 4,000) but two staff will be retained so the net saving of closing on 30 June is reduced by their salaries (Rs. 3,000 per month). If closure does not occur until November, the vacancy in the publishing department will need to be filled (at Rs. 1,300 per month) until closure in November when the transfer occurs. The redundancy pay will arise whenever closure occurs and is therefore irrelevant.
  • 31. 31 ** The future cash outflow on printing materials is Rs. 31,000 per month for five months less the Rs. 18,000 held in stock. However, the opportunity to sell the stock is lost, therefore, there is an additional cost of Rs. 10,000. *** If the department is closed then the options are (from note (ii) in the question): (i) Accept both deliveries, pay for them and sell the goods to XYZ Ltd: (2 Rs. 500) – (2 Rs. 380) = Rs. 240 net cost. (ii) Accept the July delivery, pay for it, sell it to XYZ Ltd and pay the cancellation cost for August: (Rs. 500 – Rs. 380) + Rs. 100 = Rs. 220 net cost. (iii) Cancel both deliveries at a net cost of Rs. 300. The lowest cost option would be selected if closure occurred, therefore this is a benefit of continuing to November. The distribution material costs to November are (5 months @ Rs. 1,100) – Rs. 220 = Rs. 5,280. **** Attributable costs are [(Rs. 8,500 30%) + (Rs. 8,500 70% 15%)] 5 months = Rs. 17,212.50. ***** Attributable costs are [(Rs. 1,200 25%) + (Rs. 1,200 75% 15%)] 5 months = Rs. 2,175. ****** Rs. Net book value 48,000 June sale (loss) 21,000 Therefore June proceeds 27,000 November proceeds 25,000 Additional loss 2,000 11. (a) Back flushing in a JIT system Traditional accounting systems record the flow of inventory through elaborate accounting procedures. Such systems are required in those manufacturing environment where inventory/WIP values are large. However, since JIT systems operate in modern manufacturing environment characterized by low inventory and WIP values, usually also associated with low cost variances, the requirements of such elaborate accounting procedures does not exist. Back flushing requires no data entry of any kind until a finished product is completed. At that time the total amount finished is entered into the computer system which is multiplied by all components as per the Bill of materials (BOM) for each item produced. This yields a lengthy list of components that should have been used in the production process and this is subtracted from the opening stock to
  • 32. 32 arrive at the closing stock to arrive at the closing stock/inventory. The problems with back flushing that must be corrected before it works properly are: (i) The total production quantity entered into the system must be absolutely correct, if not, then wrong components and quantities will be subtracted from the stock. (ii) All abnormal scrap must be diligently tracked and recorded. Otherwise materials will fall outside the black flushing system and will not be charged to inventory. (iii) Lot tracing is impossible under the back flushing system. This is required when a manufacturer needs to keep records of which production lots were used to create a product in case all the items in a lot need be recalled. (iv) The inventory balance may be too high at all times because the back flushing transactions that relieves inventory usually does so only once a day, during which time other inventory is sent to the production process. This makes it difficult to maintain an accurate set of inventory records in the warehouse. (b) Reasons for following skimming pricing policy It is a policy where the prices are kept high during the early period of a product’s existence. This can be synchronised with high promotional expenditure and in the latter years the prices can be gradually reduced. The reasons for following such a policy are as follows: (i) The demand is likely to be inelastic in the earlier stages till the product is established in the market. (ii) The gradual reduction in price in the latter years will tend to increase the sales. (iii) This method is preferred in the beginning because in the initial periods when the demand for the product is not known the price covers the initial cost of production. (iv) High initial capital outlays needed for manufacture, results in high cost of production. In addition to this, the producer has to incur huge promotional activities resulting in increased costs. High initial prices will be able to finance the cost of production particularly when uncertainties block the usual sources of capital. 12. The Balanced Scorecard can be defined as ‘an approach to the provision of information to management to assist strategic policy formulation and achievement’. It emphasizes the need to provide the user with a set of information, which addresses all relevant areas of performance in an objective and unbiased fashion. The information provided may include both financial and non financial elements, and cover areas such as profitability, customer satisfaction, internal efficiency and innovation’. It shall be clear from the above definition that the central idea of the Balanced Scorecard is that managers should develop the measures on which they manage the business from
  • 33. 33 four different perspectives: 1. Customer satisfaction 2. Internal business process e.g., operating cycle time. 3. Kaizen approach (can we continue to improve and create value) 4. Financial e.g., operating income by segments. The following figure summarises the ideas of a Balanced Scorecard: The ultimate result of using the Balanced Scorecard approach should be an improved long-term financial performance. Since the scorecard gives equal importance to the relevant non – financial measures, it should discourage the short termism that leads to cuts in spending on new product development, human resource development etc which are ultimately detrimental for the future prospects of the company. The responsibility to devise and implement a Balanced Scorecard should be that of the
  • 34. 34 managers working with the business. Since every company is different, it shall need to work out for itself the various financial and non – financial measures, which need to be focussed upon for its own development. Since the Balanced Scorecard is recommended as a management tool used both for internal and external reporting purposes, it is again the manager’s responsibility to decide as to what information needs to be disclosed and how any problems of confidentiality can best be overcome. The following are some reasons why Balanced Scorecards sometimes fail to provide for the desired results: Managers mistakenly think that since they already use non – financial measures, they already have a Balanced Scorecard. Senior executives misguidedly delegate the responsibility of the Scorecard implementation to middle level managers. Company’s try to copy measures and strategies used by the best companies rather than developing their own measures suited for the environment under which they function. There are times when Balanced Scorecards are thought to be meant for reporting purposes only. This notion does not allow a Business to use the Scorecard to manage Business in a new and more effective way. It may be noted that the above-mentioned difficulties refer to the internal use of the Scorecard, unless it is used internally successfully, it should not be used as a basis for external reporting. 13. (a) Cost classification is the process of grouping costs according to their characteristics. Costs are classified or grouped according to their common characteristics. Costs may be classified according to elements, according to functions or operations, according to their behaviour, according to controllability or according to normality. The break up of the aggregate costs into relevant types, is an essential pre-requisite of decision making as well as of controlling costs. Classification of costs on different bases is thus necessary for various purposes. For the purpose of decision-making and control, costs are distinguished on the basis of their relevance to different type of decisions and control functions. The importance of distinguishing costs as direct or indirect lies in the fact that direct costs of a product or an activity can be accurately allocated while indirect costs have to be apportioned on the basis of certain assumptions. This is so because direct costs are controllable at the operational level whereas indirect costs are not amenable to such control. (b) Cost information is required both for short-term and long-run managerial problems. Differential costs are of particular use in short-term problems which are non- repetitive, one time, ad-hoc problems. The following are the most common short- term problems and areas where differential cost analysis may be deployed. 1. Accept - or - reject special order decisions.
  • 35. 35 2. Make - or - buy decisions. 3. Sell- or - process decisions. 4. Reduce - or - maintain price decisions. 5. Add - or - drop product decisions. 6. Operate - or shut down decisions. (c) Relevant costs are pertinent or valid costs for a decision. These bear upon or ‘influence decision' and are directly related to the decisions to be made. These are critical to the decision, and have significance for it. These are the costs which generally respond to managerial decision making, and have significance in arriving at correct conclusions. These costs are capable of making a difference in user- decisions and enter into a choice between alternative courses of action. In specific terms, relevant costs for decisions are defined as "expected future costs that will differ under alternatives". Relevant costs are futuristic in nature. These are the costs that are expected to occur during the time period covered by the decision. These costs are different between alternatives being considered. Only costs that differ among decision alternatives are relevant to a decision. 14. (a) The possible disadvantages of treating divisions as profit centres are as follows: 1. Divisions may compete with each other and may take decisions to increase profits at the expense of other divisions thereby overemphasizing short term results. 2. It may adversely affect co-operation between the divisions and lead to lack of harmony in achieving organisational goals of the company. Thus it is hard to achieve the objective of goal congruence. 3. It may lead to reduction in the company's overall total profits. 4. The cost of activities which are common to all divisions may be greater for decentralised structure than for centralised structure. It may thus result in duplication of staff activities. 5. Top management 10 sesc' Control by delegating decision making to divisional managers. There are risks of mistakes committed by the divisional managers which the top management, may avoid. 6. Series of control reports prepared for several departments may not be effective from the point of view of top management. 7. It may under utilise corporate competence. 8. It leads to complications associated with transfer pricing problems. 9. It becomes difficult to identity and define precisely suitable profit centres. 10. It confuses division's results with manager's performance.
  • 36. 36 (b) Bench marking is a technique which is being adopted as a mechanism for achieving continuous improvement. It is a continuous process of measuring a company’s products, services or activities against the other best performing organizations either internal or external to the company. The objective is to ascertain how the processes and activities can be improved. The latest developments, best practices and model examples can be incorporated within various operations of the business of the company. It represents an ideal way of achieving high competitive standards. 15. (a) Standard Cost Sheet Max. capacity = 200 units. Description Cost per unit of Finished Good Standard Raw Material Cost Rs. 5,600 Variable Overheads Rs. 1,400 Standard Fixed Overheads Rs. 10,000 Standard Cost per Unit of Finished Good Rs. 17,000 (b) Production Volume Variance Unutilised capacity × Standard Fixed Cost per Finished Good 100 × Rs 10,000 = Rs 10,00,000 Adverse. Usage and Material Price Variance (Actual Production : 100 Units) Raw Std Std. Actual Act Std Price Usage Price Material Qty/FG Qty on Qty on Price per unit of Variance Variance actual actual per unit RM (Rs.) (Rs.) prod prod of RM (Rs.) (Rs.) A 1 100 102 700 600 (1,200) (10,200) B 2 200 201 600 500 (500) (20,100) C 3 300 310 500 400 (4,000) (31,000) D 4 400 415 400 300 (4,500) (41,500) E 5 500 540 300 200 (8,000) (54,000) F 6 600 610 200 100 (1,000) (61,000) (19,200) (2,17,800) 16. (a) The first time when a new operation is performed, both the workers and the operating procedures are untried. As the operation is repeated and the workers become more familiar with work, labour efficiency increases and the labour cost per unit declines. This process continues for some time and a regular rate of decline in cost per unit can be established. This rate can be used to predict future labour costs. The learning process starts from the point when the first unit comes out of the production line. In other words ‘Learning curve’ is a function that measures how
  • 37. 37 labour hours per unit decline as units of production increase because workers are learning and becoming better at their jobs. Cost Management Application: 1. Learning curve is useful in analysing cost volume profit relationship. The company can set low price of its product to generate high demand. As the production increases, cost per unit drops. 2. It helps in budgeting and profit planning. 3. It enables the company in price fixation. In particular, the company can fix a lower price for repeat orders. 4. It helps the design engineers to take suitable decisions based on expected rates of improvement. 5. It helps in price negotiations. 6. It is useful in setting standards and in performance evaluation. (b) (i) Price per unit for first order of 100 units Rs. Rs. Direct material 500.00 Direct labour Dept A 20 Hrs @ 10 = 200 800.00 Dept B 40 Hrs @ 15 = 600 Variable Overhead 20% of Rs 800 160.00 Fixed Overhead Dept A 20 Hrs @ 8 = 160 360.00 Dept B 40 Hrs @ 5 = 200 Total cost 1,820.00 Profit 25% 455.00 Selling price per unit 2,275.00 (ii) Price per unit for second order of 60 units Learning will be applicable only in department B. Cumulative output becomes 100 units + 60 units = 160 units i.e 1.6 times for which learning is 86.1 % from the tables. Therefore Total Hrs for 160 units = 160 units 40 .861 = 5,510.4 Hrs Therefore Hrs for 60 units = Hrs for 160 units less Hrs for 100 units Or 5510.4 less 40 100 = 1510.4 Hrs 1510.4 Therefore Hrs per unit = = 25.17. 60