The Triple Threat | Article on Global Resession | Harsh Kumar
coca cola Reconciliation of Q2 2003 Non-GAAP Financial Measures
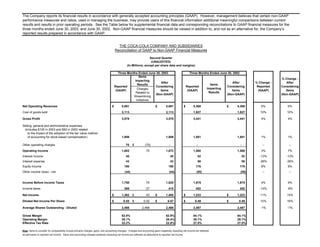
1. The Company reports its financial results in accordance with generally accepted accounting principles (GAAP). However, management believes that certain non-GAAP
performance measures and ratios, used in managing the business, may provide users of this financial information additional meaningful comparisons between current
results and results in prior operating periods. See the Table below for supplemental financial data and corresponding reconciliations to GAAP financial measures for the
three months ended June 30, 2003, and June 30, 2002. Non-GAAP financial measures should be viewed in addition to, and not as an alternative for, the Company’s
reported results prepared in accordance with GAAP.
THE COCA-COLA COMPANY AND SUBSIDIARIES
Reconciliation of GAAP to Non-GAAP Financial Measures
Second Quarter
(UNAUDITED)
(In Millions, except per share data and margins)
Three Months Ended June 30, 2003 Three Months Ended June 30, 2002
Items
% Change -
Impacting
After After % Change - After
Results Items
Reported Considering Reported Considering Reported Considering
Impacting
Charges
(GAAP) Items (GAAP) Items (GAAP) Items
Results
Related to
(Non-GAAP) (Non-GAAP) (Non-GAAP)
Streamlining
Initiatives
Net Operating Revenues $ 5,691 $ 5,691 $ 5,368 $ 5,368 6% 6%
Cost of goods sold 2,113 2,113 1,927 1,927 10% 10%
Gross Profit 3,578 3,578 3,441 3,441 4% 4%
Selling, general and administrative expenses
(includes $105 in 2003 and $92 in 2002 related
to the impact of the adoption of the fair value method
of accounting for stock-based compensation) 1,906 1,906 1,881 1,881 1% 1%
Other operating charges 70 $ (70) - - - -- --
Operating Income 1,602 70 1,672 1,560 1,560 3% 7%
Interest income 45 45 52 52 -13% -13%
Interest expense 43 43 58 58 -26% -26%
Equity income 190 190 176 176 8% 8%
Other income (loss) - net (44) (44) (55) (55) -- --
Income Before Income Taxes 1,750 70 1,820 1,675 1,675 4% 9%
Income taxes 388 27 415 452 452 -14% -8%
Net Income $ 1,362 $ 43 $ 1,405 $ 1,223 $ 1,223 11% 15%
Diluted Net Income Per Share $ 0.55 $ 0.02 $ 0.57 $ 0.49 $ 0.49 12% 16%
Average Shares Outstanding - Diluted 2,466 2,466 2,466 2,487 2,487 -1% -1%
Gross Margin 62.9% 62.9% 64.1% 64.1%
Operating Margin 28.1% 29.4% 29.1% 29.1%
Effective Tax Rate 22.2% 22.8% 27.0% 27.0%
Note: Items to consider for comparability include primarily charges, gains, and accounting changes. Charges and accounting gains negatively impacting net income are reflected
as add-backs to reported net income. Gains and accounting changes positively impacting net income are reflected as deductions to reported net income.