1. For Immediate Release
Media Contacts: Investor Contacts:
Susan Busch, Director of Corporate PR Jennifer Driscoll, Vice President of Investor Relations
(612) 291-6114 or susan.busch@bestbuy.com (612) 291-6110 or jennifer.driscoll@bestbuy.com
Kelly Groehler, Senior Manager of Corporate PR Charles Marentette, Senior Director of Investor Relations
(612) 291-6115 or kelly.groehler@bestbuy.com (612) 291-6184 or charles.marentette@bestbuy.com
Carla Haugen, Director of Investor Relations
(612) 291-6146 or carla.haugen@bestbuy.com
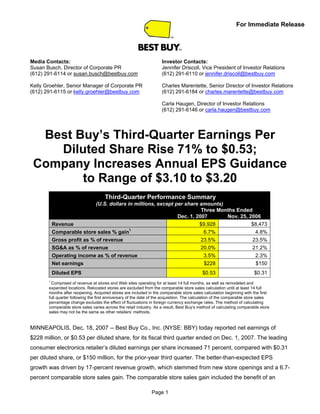
Best Buy’s Third-Quarter Earnings Per
Diluted Share Rise 71% to $0.53;
Company Increases Annual EPS Guidance
to Range of $3.10 to $3.20
Third-Quarter Performance Summary
(U.S. dollars in millions, except per share amounts)
Three Months Ended
Dec. 1, 2007 Nov. 25, 2006
$9,928 $8,473
Revenue
Comparable store sales % gain1 6.7% 4.8%
23.5% 23.5%
Gross profit as % of revenue
20.0% 21.2%
SG&A as % of revenue
3.5% 2.3%
Operating income as % of revenue
$228 $150
Net earnings
$0.53 $0.31
Diluted EPS
1
Comprised of revenue at stores and Web sites operating for at least 14 full months, as well as remodeled and
expanded locations. Relocated stores are excluded from the comparable store sales calculation until at least 14 full
months after reopening. Acquired stores are included in the comparable store sales calculation beginning with the first
full quarter following the first anniversary of the date of the acquisition. The calculation of the comparable store sales
percentage change excludes the effect of fluctuations in foreign currency exchange rates. The method of calculating
comparable store sales varies across the retail industry. As a result, Best Buy’s method of calculating comparable store
sales may not be the same as other retailers’ methods.
MINNEAPOLIS, Dec. 18, 2007 -- Best Buy Co., Inc. (NYSE: BBY) today reported net earnings of
$228 million, or $0.53 per diluted share, for its fiscal third quarter ended on Dec. 1, 2007. The leading
consumer electronics retailer’s diluted earnings per share increased 71 percent, compared with $0.31
per diluted share, or $150 million, for the prior-year third quarter. The better-than-expected EPS
growth was driven by 17-percent revenue growth, which stemmed from new store openings and a 6.7-
percent comparable store sales gain. The comparable store sales gain included the benefit of an
Page 1
2. Best Buy 3Q08 Earnings/ 2 2 2
additional post-Thanksgiving holiday shopping week. The strong revenue growth, which helped drive
selling, general and administrative (SG&A) expense leverage, coupled with a flat gross profit rate,
drove a 120-basis-point improvement in the operating income rate for the quarter.
For the nine months ended Dec. 1, 2007, the company’s net earnings grew 9 percent to $670
million, or $1.47 per diluted share, versus $614 million, or $1.24 per diluted share, for the same period
of the prior fiscal year. The primary drivers of the year-to-date earnings growth were new store
openings, comparable store sales gains and revenue-driven expense leverage in both the
international and domestic segments.
Third-Quarter Highlights
• Total quarterly revenue increased 17 percent to $9.9 billion, driven by new store openings and
a comparable store sales gain of 6.7 percent. The comparable store sales gain was due to an
increase in the average selling price and a favorable calendar shift, which added one extra
week of post-Thanksgiving revenue (which seasonally brings higher traffic) to the domestic
segment’s fiscal third quarter. Total online revenue grew approximately 65 percent in the
quarter. The benefit of the calendar shift to the enterprise comparable store sales gain was
approximately 2.5 percentage points.
• Domestic revenue grew 15 percent, reflecting the addition of new stores in the past 12 months
as well as a comparable store sales gain of 6.1 percent.
• International revenue grew 32 percent, fueled by a favorable foreign-currency exchange rate,
a 9.3-percent comparable store sales gain (which came on top of a 13.7 percent gain in last
year’s period) and the addition of new stores.
• The company’s gross profit rate was unchanged on a year-over-year basis. The enterprise
gross profit rate benefited from lower promotional costs in a more rational U.S. retail
environment compared to last year, particularly in home theater. Offsetting these benefits was
a continued shift in the revenue mix, including higher revenue from lower-margin video gaming
hardware.
• The company reduced its SG&A expense rate by 120 basis points through expense leverage
on increased revenue and labor productivity gains.
“We are very encouraged by the strengthening we’re seeing in our customer relationships as
well as our solid financial performance,” said Brad Anderson, vice chairman and CEO of Best Buy.
“The loyalty that our employees are building with customers will enable us to expand those
relationships into new areas of growth in the future. Our employees should be proud of their
performance in the quarter. It gives us momentum for the next leg of our growth journey. This is truly a
very exciting time in our industry -- for our customers and for our company.”
3. Best Buy 3Q08 Earnings/ 3 3 3
Third-Quarter Results Show Strong Enterprise-Wide Performance
For the fiscal 2008 third quarter, Best Buy’s revenue increased 17 percent to $9.9 billion,
compared with revenue of $8.5 billion for the third quarter of fiscal 2007. The revenue increase reflected
the net addition of 127 new stores in the past 12 months and a comparable store sales gain of 6.7
percent for the third quarter. The comparable store sales gain was driven by an increase in the average
selling price, as the company’s revenue mix continued to reflect a shift toward higher-ticket items, such
as video gaming consoles, notebook computers, flat-panel TVs and GPS devices. The calendar shift
also added to the comparable store sales gain.
The gross profit rate for the third quarter was 23.5 percent of revenue, which was unchanged
from the prior-year’s period. Adding to the rate in the quarter was a more rational year-over-year
promotional environment in the U.S.—particularly in home theater and computing—plus less costly
promotional offers. These gains were offset by the continued increase in the revenue mix of lower-
margin products (such as video gaming systems and notebook computers).
Best Buy’s SG&A expense rate improved to 20.0 percent of revenue for the third quarter,
compared with 21.2 percent of revenue for the prior year’s period. The year-over-year improvement in
the SG&A expense rate was primarily due to leverage on revenue growth and productivity gains,
including store operating model changes in the United States.
The company reported investment and other income of $32 million, compared with $31 million
in the prior year’s third quarter. The change reflected an $8 million gain on the sale of an equity
investment, which was partially offset by the impact of lower average cash and investment balances,
due to the company’s ongoing, accelerated share repurchase (ASR) program. Additionally, interest
expense of $23 million for the quarter was $16 million higher than in the prior year’s period due to
current borrowing related to the ASR program. The company’s effective income tax rate for the
quarter was 35.6 percent, versus 31.6 percent for the prior year’s period. The increase in the effective
income tax rate was due to three factors: the absence of the favorable resolution of certain tax
matters that occurred in the prior fiscal year, changes in the global composition of the company’s
earnings, and lower tax-exempt interest income.
The company’s merchandise inventory increased 22 percent year over year. The increase
reflected new store growth; increased availability of products such as video gaming, flat-panel TVs
and notebook computers; and the impact of the calendar shift, as the quarter ended one week further
into the holiday shopping season. “We’re comfortable with our inventory position heading into the
highest volume period of the year,” said Brian Dunn, president and chief operating officer of Best Buy.
4. Best Buy 3Q08 Earnings/ 4 4 4
Company Increases Annual EPS Outlook to $3.10 to $3.20 for Fiscal 2008
Jim Muehlbauer, Best Buy’s senior vice president of finance and interim CFO, said, “We are
pleased with the third quarter’s results and now forecast greater earnings growth for the year. The
ability of our employees to deliver exceptional operating results in a challenging macro environment
reflects their focus on the customer and the relative strength of our categories in the current
marketplace. We expect revenue growth in the fiscal fourth quarter to moderate versus the fiscal third
quarter for two reasons. First, the calendar shift that helped the third quarter is expected to constrain
comparable store sales gains for both December and the fourth quarter. Second, this year’s fiscal
fourth-quarter earnings will reflect only 13 weeks, versus 14 weeks in the prior year’s period. Given
these two factors, we also expect the improvement in the fourth-quarter SG&A rate to be significantly
less than the third-quarter improvement.”
The company now estimates annual earnings per diluted share of $3.10 to $3.20. The updated
guidance assumes that the operating income rate will be up modestly for the fiscal year on
approximately $40 billion in revenue, assuming a comparable store sales gain for the year of
approximately 4 percent. Consistent with prior guidance, the company continues to expect its average
diluted share count to be approximately 454 million shares for the fiscal year. The company’s prior
earnings guidance was for diluted earnings per share in the top half of the range of $3.00 to $3.15.
In addition, the company updated its capital expenditures guidance for the year to
approximately $900 million. The new estimate includes an acceleration of investments in new store
openings and information technology, including updated point-of-sale systems. The company now
expects to open approximately 150 new stores globally during fiscal 2008, up from 130 to 135 stores
previously.
5. Best Buy 3Q08 Earnings/ 5 5 5
Domestic Segment Enjoys Revenue Lift; Investments and Execution Drive Results
Domestic Performance Summary
(U.S. dollars in millions)
Three Months Ended Nine Months Ended
Nov. 25, 2006
Nov. 25, 2006
(As Adjusted1) (As Adjusted1)
Dec. 1, 2007 Dec. 1, 2007
$8,206 $7,164 $22,144 $19,947
Revenue
Comparable store sales % gain2 6.1% 3.6% 3.3% 3.7%
24.2% 24.0% 24.6% 25.0%
Gross profit as % of revenue
20.2% 21.4% 20.3% 20.7%
SG&A as % of revenue
$329 $189 $957 $853
Operating income
4.0% 2.6% 4.3% 4.3%
Operating income as % of revenue
1
Prior year amounts have been adjusted to conform to the current year presentation, which allocates to the international segment certain
SG&A support costs previously reported as part of the domestic segment in fiscal 2007.
2
Comprised of revenue at stores and Web sites operating for at least 14 full months, as well as remodeled and expanded locations.
Relocated stores are excluded from the comparable store sales calculation until at least 14 full months after reopening. Acquired stores are
included in the comparable store sales calculation beginning with the first full quarter following the first anniversary of the date of the
acquisition. The method of calculating comparable store sales varies across the retail industry. As a result, Best Buy’s method of calculating
comparable store sales may not be the same as other retailers’ methods.
Best Buy’s domestic segment—comprised of U.S. Best Buy, U.S. Geek Squad, Magnolia
Audio Video and Pacific Sales operations—reported third-quarter operating income of $329 million, an
increase of $140 million, compared with the prior year’s period. The 140-basis-point operating income
rate improvement reflected leverage on higher revenue combined with a less promotional
environment. The domestic segment’s fiscal third-quarter revenue totaled $8.2 billion, an increase of
15 percent over the prior year fiscal third quarter. The revenue increase was driven by the opening of
96 net new stores and a comparable store sales gain of 6.1 percent. Pacific Sales, a retailer of high-
end home improvement products, contributed revenue of $75 million during the quarter, a decrease of
3 percent over the prior year fiscal third quarter, amid a challenging housing environment.
Best Buy finished the fiscal third quarter with an enhanced mobile phone experience, branded
Best Buy Mobile, in 181 U.S. Best Buy locations and at seven stand-alone locations. The company
intends to remodel all of its U.S. Best Buy stores within the next two years to include the Best Buy
Mobile experience. The decision to expand was based on early positive top-line results and its outlook
for growth within the mobile business in the United States. As planned, the company enhanced its
computer shopping experience with Apple computing products at 76 additional U.S. Best Buy
locations this quarter, resulting in 286 total locations today. Earlier this month, the company also
announced it expects to offer Dell notebook and desktop computers in all U.S. Best Buy stores,
beginning on Dec. 30, 2007.
Dunn said, “We had outstanding execution across our enterprise, with all of our employees
focused on delivering a great experience for our customers. We believe we are profitably growing our
market share, and we expect the insights we’re gaining every day will simply open more doors for
6. Best Buy 3Q08 Earnings/ 6 6 6
growth in the future. When we get it right for the customer and the employee, it’s electric. It’s very
rewarding when it all comes together, like it did this quarter.”
International Segment Delivers Strong Revenue and Operating Income Growth
International Performance Summary
(U.S. dollars in millions)
Three Months Ended Nine Months Ended
Nov. 25, 2006
Nov. 25, 2006
(As Adjusted1) (As Adjusted1)
Dec. 1, 2007 Dec. 1, 2007
$1,722 $1,309 $4,461 $3,088
Revenue
Comparable store sales % gain2 9.3% 13.7% 12.3% 10.4%
20.6% 21.0% 20.6% 22.0%
Gross profit as % of revenue
19.3% 20.4% 19.2% 21.6%
SG&A as % of revenue
$22 $7 $61 $10
Operating income
1.3% 0.5% 1.4% 0.3%
Operating income as % of revenu
1
Prior year amounts have been adjusted to conform to the current year presentation, which allocates to the international segment certain
SG&A support costs previously reported as part of the domestic segment in fiscal 2007.
2
Comprised of revenue at stores and Web sites operating for at least 14 full months, as well as remodeled and expanded locations.
Relocated stores are excluded from the comparable store sales calculation until at least 14 full months after reopening. Acquired stores are
included in the comparable store sales calculation beginning with the first full quarter following the first anniversary of the date of the
acquisition. The calculation of the comparable store sales percentage change excludes the effect of fluctuations in foreign currency
exchange rates. The method of calculating comparable store sales varies across the retail industry. As a result, Best Buy’s method of
calculating comparable store sales may not be the same as other retailers’ methods.
The company’s international segment—comprised of Best Buy and Geek Squad operations in
Canada and China, Five Star operations in China, and Future Shop operations in Canada—generated
third-quarter operating income of $22 million, compared with operating income of $7 million in the
prior year’s period. The significant increase in operating income was driven primarily by the
comparable store sales gain, new store openings and SG&A leverage. The international segment
experienced a mix-driven decline in its gross profit rate that was more than offset by 110 basis points
of SG&A leverage. The company attributed its expense improvement to leverage on higher revenue
and expense control. Including investments in infrastructure, new store openings and preparations to
launch stores in Mexico and Turkey, the international segment improved its operating income rate by
80 basis points for the quarter as compared with the same period last year.
International segment fiscal third quarter revenue rose 32 percent to $1.7 billion. The third-
quarter revenue increase was driven primarily by a favorable foreign currency exchange rate, a
comparable store sales gain of 9.3 percent and the opening of 31 net new stores. In Canada, the
nearly 9-percent comparable store sales gain reflected strong consumer interest in video gaming
hardware, flat-panel TVs, notebook computers and GPS devices at both Future Shop and Best Buy
stores. The Canadian operations posted a 120-basis-point improvement in its operating income rate
7. Best Buy 3Q08 Earnings/ 7 7 7
through leverage on its revenue growth, a more efficient promotional strategy and solid retail
execution.
Revenue from retail operations in China grew 42 percent to approximately $300 million for the
third quarter, including the impact of new store openings and a comparable store sales gain of nearly
13 percent. (The company reports results from its operations in China on a two-month lag basis.)
Bob Willett, CEO of Best Buy International and CIO, commented, “We’re very pleased with the
continued commitment and performance that our international employees are demonstrating. Our
stores in China and Canada led the company’s comparable store sales gains. Our international
growth strategy remains on track, including the launch of stores in Mexico and Turkey planned for
next year. As our international segment grows, it not only diversifies our enterprise revenue streams
but also gives us greater exposure to innovative ideas throughout the world.”
Sales of Video Gaming, Flat-Panel TVs, Notebooks and GPS Lead Growth
Revenue Mix Summary Comparable Store Sales
Three Months Ended Three Months Ended
Revenue Category
Nov. 25, 2006 Nov. 25, 2006
Dec. 1, 2007 Dec. 1, 2007
Consumer Electronics 41% 43% 2.4% 9.0%
Home Office 28% 27% 6.5% (0.3%)
Entertainment Software 19% 17% 23.1% 3.5%
Appliances 6% 7% (1.8%) (4.1%)
Services1 6% 6% 5.6% 9.0%
Other2 0% 0% n/a n/a
Total 100% 100% 6.7% 4.8%
1
Services consists primarily of commissions from the sale of extended service contracts; revenue from computer-related services;
product repair revenue; and delivery and installation revenue derived from home theater, mobile audio and appliances.
2
Other includes revenue, such as fees received from cardholder account activations, that is recognized over time, resulting in
revenue recognition that is not indicative of sales activity in the current period. Other also includes gift card breakage. These
revenue types are excluded from our comparable store sales calculation. Finally, Other includes revenue from the sale of products
that are not related to our core offerings. For these reasons, a comparable store sales metric for this revenue category is not
provided.
During the third quarter of fiscal 2008, Best Buy’s comparable store sales gain was driven by
higher revenue from video gaming, flat-panel TVs, notebook computers and GPS products. These
gains more than offset comparable store sales declines in projection and tube TVs, DVDs and CDs.
Best Buy’s revenue mix for the third quarter of fiscal 2008 was led by growth in the
entertainment software revenue category. The entertainment software category, which comprised 19
percent of third-quarter revenue, increased 23.1 percent on a comparable store sales basis. A very
strong double-digit gain in comparable store sales of video gaming was fueled by strong sales of
8. Best Buy 3Q08 Earnings/ 8 8 8
hardware, which offered better in-stock levels and attractive pricing, as well as new software. These
gains were partially offset by an expected comparable store sales decline for DVDs and CDs.
The home office revenue category accounted for 28 percent of fiscal third-quarter revenue and
had a 6.5-percent comparable store sales gain. A solid double-digit comparable store sales increase
for notebook computers fueled the growth as customers continued to opt for mobility. The gain from
notebook computers was partially offset by a comparable store sales decline for printers, phones and
monitors.
The services revenue category accounted for 6 percent of third-quarter revenue. On a
comparable store sales basis, the services category increased 5.6 percent. A solid double-digit gain in
repair revenue plus a low double-digit gain in computer and home theater services drove the
comparable store sales increase. These results were offset partially by a single-digit decline in
commissions from the sale of extended service contracts.
Consumer electronics, which represented 41 percent of third-quarter revenue, posted a 2.4-
percent comparable store sales gain. Within consumer electronics, GPS products led the way in the
comparable store sales gain, as navigation devices become increasingly affordable and easier to use
with increased features. Flat-panel TVs experienced a double-digit comparable store sales gain due to
attractive pricing and improved assortments of TVs in larger screen sizes. Total television comparable
store sales were unchanged year-over year as flat-panel TV growth was offset by declines in
comparable store sales of projection and tube TVs. Digital imaging also drove a mid-single digit
comparable store sales gain as customers opted for the premium experience that digital SLR offers.
The appliances revenue category, which totaled 6 percent of fiscal 2008 third-quarter revenue,
had a comparable store sales decline of 1.8 percent for the quarter. This decline was driven by a mid-
single-digit decline in the domestic segment due to a challenging industry-wide environment. Partially
offsetting this decline was a low-double-digit gain in the international segment, where appliances
represent a larger percentage of the business (particularly in China).
The other category consists of fees from credit card and related programs, which are provided
by an outside financial institution, and revenue principally from the sales of products unrelated to the
core business, such as food and beverages.
During the third quarter, the company opened 45 U.S. Best Buy stores, including 11 of its
45,000-square-foot stores, 30 of its 30,000-square-foot stores, and four of its 20,000-square-foot
stores. At the end of the third quarter, the domestic segment included 917 Best Buy stores, seven
Geek Squad stores, 13 Magnolia Audio Video stores and 17 Pacific Sales showrooms. The
international segment included 149 Five Star stores and one Best Buy store in China, and 131 Future
Shop stores and 51 Best Buy stores in Canada. For the trailing 12 months, the company opened 144
new stores and closed 17 stores. More details regarding historical store counts and square footage
are available on the company’s Web site under “For Our Investors.”
9. Best Buy 3Q08 Earnings/ 9 9 9
Shareholder Returns
On Oct. 30, 2007, the company paid a dividend of 13 cents per share, or $55 million in the
aggregate, which was a 30-percent increase compared with the dividend per share paid in the prior
year’s third quarter.
The company’s assumptions regarding the timing and benefit of its accelerated share
repurchase program remain unchanged. The company still expects its weighted average diluted share
count for the fiscal year to be approximately 454 million. The company’s estimated weighted average
diluted shares include assumptions concerning the timing of the ASR’s conclusion, stock option
exercises and movement in the company’s share price. Fiscal year to date, the company has
repurchased 65.5 million shares.
Best Buy is scheduled to conduct an earnings conference call at 10 a.m. Eastern Time on
Dec. 18, 2007. The call is expected to be available on its Web site both live and after the call at
www.BestBuy.com. The public may access the call by clicking on “For Our Investors.”
Forward-Looking and Cautionary Statements:
This news release contains forward-looking statements within the meaning of the Private Securities
Litigation Reform Act of 1995 as contained in Section 27A of the Securities Act of 1933 and Section 21E of the
Securities Exchange Act of 1934 that reflect management’s current views and estimates regarding future market
conditions, company performance and financial results, business prospects, new strategies, the competitive
environment and other events. You can identify these statements by the fact that they use words such as
“anticipate,” “believe,” “estimate,” “expect,” “intend,” “project,” “plan,” “outlook,” and other words and terms of similar
meaning. These statements involve a number of risks and uncertainties that could cause actual results to differ
materially from the potential results discussed in the forward-looking statements. Among the factors that could
cause actual results and outcomes to differ materially from those contained in such forward-looking statements are
the following: general economic conditions, acquisitions and development of new businesses, divestitures, product
availability, sales volumes, pricing actions and promotional activities of competitors, profit margins, weather,
changes in law or regulations, foreign currency fluctuation, availability of suitable real estate locations, the
company’s ability to react to a disaster recovery situation, and the impact of labor markets and new product
introductions on overall profitability. A further list and description of these risks, uncertainties and other matters can
be found in the company’s annual report and other reports filed from time to time with the Securities and Exchange
Commission, including, but not limited to, Best Buy’s Annual Report on Form 10-K filed with the SEC on May 2,
2007. Best Buy cautions that the foregoing list of important factors is not complete and assumes no obligation to
update any forward-looking statement that it may make.
About Best Buy Co., Inc.
Best Buy Co., Inc. (NYSE:BBY) operates a global portfolio of brands with a commitment to growth and
innovation. Our employees strive to provide customers around the world with superior experiences by
responding to their unique needs and aspirations. We sell consumer electronics, home-office products,
entertainment software, appliances and related services through nearly 1,300 retail stores across the United
States, throughout Canada and in China. Our multi-channel operations include: Best Buy (BestBuy.com,
BestBuy.ca and BestBuy.com.cn), Future Shop (FutureShop.ca), Geek Squad (GeekSquad.com and
GeekSquad.ca), Pacific Sales Kitchen and Bath Centers (PacificSales.com), Magnolia Audio Video
(Magnoliaav.com), Jiangsu Five Star Appliance Co. (Five-Star.cn) and Speakeasy (Speakeasy.net). Best Buy
supports the communities in which its employees work and live through volunteerism and grants that benefit
children and education.
###
10. Best Buy 3Q08 Earnings/ 10 10 10
BEST BUY CO., INC.
CONDENSED CONSOLIDATED STATEMENTS OF EARNINGS
($ in millions, except per share amounts)
(Unaudited)
Three Months Ended Nine Months Ended
Dec. 1, Nov. 25, Dec. 1, Nov. 25,
2007 2006 2007 2006
Revenue $ 9,928 $ 8,473 $ 26,605 $ 23,035
Cost of goods sold 7,591 6,478 20,237 17,373
Gross profit 2,337 1,995 6,368 5,662
Gross profit % 23.5% 23.5% 23.9% 24.6%
Selling, general and administrative expenses 1,986 1,799 5,350 4,799
SG&A % 20.0% 21.2% 20.1% 20.8%
Operating income 351 196 1,018 863
Other income (expense)
Investment income and other 32 31 98 91
Interest expense (23) (7) (53) (23)
Earnings before income tax expense and
minority interest 360 220 1,063 931
Income tax expense 129 70 386 317
Effective tax rate 35.6% 31.6% 36.3% 34.1%
Minority interest (1) --- (4) ---
Equity in loss of affiliates (2) --- (3) ---
Net earnings $ 228 $ 150 $ 670 $ 614
Earnings per share
Basic $ 0.55 $ 0.31 $ 1.50 $ 1.27
Diluted(1) $ 0.53 $ 0.31 $ 1.47 $ 1.24
Dividends declared per common share $ 0.13 $ 0.10 $ 0.33 $ 0.26
Weighted average common shares
outstanding (in millions)
Basic 418.7 481.0 447.2 482.5
Diluted(1) 430.8 495.8 459.5 497.4
(1) The calculation of diluted earnings per share assumes the conversion of our convertible debentures due in
2022 into 8.8 million shares of common stock and adds back the related after-tax interest expense of $1.5
and $1.7 for the three months ended Dec. 1, 2007, and Nov. 25, 2006, respectively, and $4.4 and $5.1 for
the nine months ended Dec. 1, 2007, and Nov. 25, 2006, respectively.
–Balance Sheets Follow –
11. Best Buy 3Q08 Earnings/ 11 11 11
BEST BUY CO., INC.
CONDENSED CONSOLIDATED BALANCE SHEETS
($ in millions)
(Unaudited)
Dec. 1, Nov. 25,
2007 2006
ASSETS
Current assets
Cash and cash equivalents $ 1,319 $ 1,208
Short-term investments 295 1,802
Receivables 739 1,115
Merchandise inventories 7,451 6,084
Other current assets 673 759
Total current assets 10,477 10,968
Net property & equipment 3,260 2,971
Goodwill 1,086 991
Tradenames 96 83
Equity and other investments 230 335
Other assets 325 336
TOTAL ASSETS $ 15,474 $ 15,684
LIABILITIES & SHAREHOLDERS' EQUITY
Current liabilities
Accounts payable $ 7,597 $ 6,332
Accrued liabilities 2,293 2,661
Short-term debt 326 40
Current portion of long-term debt 20 419
Total current liabilities 10,236 9,452
Long-term liabilities 811 405
Long-term debt 642 191
Minority interests 39 34
Shareholders' equity 3,746 5,602
TOTAL LIABILITIES &
SHAREHOLDERS' EQUITY $ 15,474 $ 15,684
Certain amounts have been reclassified to conform to the current presentation. These reclassifications had
no effect on previously reported total assets, liabilities or shareholders’ equity.
###