1. TRIBUNE COMPANY
SECOND QUARTER RESULTS OF OPERATIONS (Unaudited)
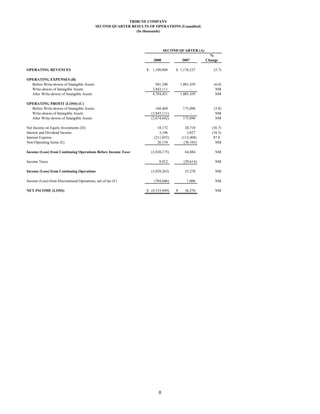
(In thousands)
SECOND QUARTER (A)
%
2008 2007 Change
OPERATING REVENUES $ 1,109,809 $ 1,176,537 (5.7)
OPERATING EXPENSES (B)
Before Write-downs of Intangible Assets 941,340 1,001,439 (6.0)
Write-downs of Intangible Assets 3,843,111 - NM
After Write-downs of Intangible Assets 4,784,451 1,001,439 NM
OPERATING PROFIT (LOSS) (C)
Before Write-downs of Intangible Assets 168,469 175,098 (3.8)
Write-downs of Intangible Assets (3,843,111) - NM
After Write-downs of Intangible Assets (3,674,642) 175,098 NM
Net Income on Equity Investments (D) 18,172 28,710 (36.7)
Interest and Dividend Income 3,196 3,827 (16.5)
Interest Expense (211,055) (112,408) 87.8
Non-Operating Items (E) 26,154 (30,343) NM
Income (Loss) from Continuing Operations Before Income Taxes (3,838,175) 64,884 NM
Income Taxes 8,912 (29,614) NM
Income (Loss) from Continuing Operations (3,829,263) 35,270 NM
Income (Loss) from Discontinued Operations, net of tax (F) (704,686) 1,006 NM
NET INCOME (LOSS) $ (4,533,949) $ 36,276 NM
8
2. (A) 2008 second quarter: Mar. 31, 2008 to June 29, 2008. (13 weeks)
2007 second quarter: Apr. 2, 2007 to July 1, 2007. (13 weeks)
(B) Operating expenses for the second quarter of 2008 included charges of $3.8 billion for the write-downs of the Company's newspaper reporting unit goodwill
and newspaper masthead intangible assets, a charge of $15 million at publishing for severance and special termination benefits, a charge of $5 million
related to the Company's management equity incentive plan, and a gain of $23 million related to the sale of real estate.
Operating expenses for the second quarter of 2007 included a charge of $27 million for severance ($25 million at publishing and $2 million at corporate), a charge
of $8 million for stock-based compensation expense, and a charge of $24 million for the write-off of Los Angeles Times plant equipment related to the previously
closed San Fernando Valley facility.
(C) Operating profit excludes interest and dividend income, interest expense, equity income and losses, non-operating items and income taxes.
(D) Net income on equity investments for the second quarter 2008 included a $13 million impairment write-down at one of the Company's interactive investments.
(E) The second quarter of 2008 included the following non-operating items:
Pretax After-tax
Gain (Loss) Gain (Loss)
Gain on PHONES and related investment (1) $ 36,440 $ 36,010
Write-down of equity investment (2) (10,312) (10,190)
Other, net 26 25
Total non-operating items $ 26,154 $ 25,845
The second quarter of 2007 included the following non-operating items:
Pretax After-tax
Gain (Loss) Gain (Loss)
Loss on PHONES and related investment (1) $ (27,395) $ (16,711)
Strategic transaction expenses (3) (20,926) (15,659)
Other, net (4) 17,978 10,966
Total non-operating items $ (30,343) $ (21,404)
(1) The gain on PHONES and related investment in the second quarter of 2008 represented primarily the change in fair values of the Company's PHONES and
the related Time Warner shares. Effective Dec. 31, 2007, the Company has elected to account for its PHONES utilizing the fair value option under Financial
Accounting Standards Board Statement No. 159, quot;The Fair Value Option for Financial Assets and Financial Liabilities.quot; As a result of this election, the
Company no longer measures the changes in fair value of just the derivative component of the PHONES, but instead measures the changes in fair value
of the entire PHONES debt. The loss on PHONES and related investment in the second quarter of 2007 represented primarily the change in fair values of the
derivative component of the Company's PHONES and the related Time Warner shares.
(2) On June 30, 2008, the Company received net proceeds of $22 million from the sale of its investment in ShopLocal, LLC. The Company recorded a write-down
of $10 million in the second quarter of 2008 to reduce the carrying value of the investment to the amount of net proceeds received.
(3) Includes expenses related to the Company's strategic review and going-private transaction approved by the Company's board of directors on April 1, 2007
and completed in December 2007. These expenses included a $13.5 million pretax loss from refinancing certain credit agreements.
(4) Other, net in the second quarter of 2007 included an $18 million pretax gain from the settlement of the Company's Hurricane Katrina insurance claim.
(F) In May 2008, the Company announced an agreement with a subsidiary of Cablevision Systems Corporation to form a new limited liability company (quot;Newsday LLCquot;)
to own and operate the Company's Newsday Media Group business (quot;NMGquot;). The Company closed on this transaction on July 29, 2008 and recorded a pretax
loss of $692 million ($693 million after taxes) in the second quarter of 2008 to write down the net assets of NMG to estimated fair value. At the closing, the Company
received a special distribution from the limited liability company of $612 million in cash and $18 million in prepaid rent under leases for certain NMG facilities retained
by the Company. Tribune owns approximately 3% of the equity in Newsday LLC. In February 2007, the Company announced an agreement to sell the New York
edition of Hoy , the Company's Spanish-language daily newspaper (quot;Hoy , New Yorkquot;). The sale of Hoy , New York closed in May 2007. In March 2007, the Company
announced its intentions to sell its Southern Connecticut Newspapers— The Advocate (Stamford) and Greenwich Time (collectively quot;SCNIquot;). The sale of SCNI
closed on November 1, 2007, and excluded the SCNI real estate in Stamford and Greenwich, Connecticut, which was sold in a separate transaction that closed on
April 22, 2008. During the third quarter of 2007, the Company entered into negotiations to sell the stock of one of its subsidiaries, EZ Buy and EZ Sell Recycler
Corporation (quot;Recyclerquot;). The sale of Recycler closed on Oct. 17, 2007. Selected financial information related to discontinued operations is summarized as follows:
Second Quarter
2008 2007
Income (loss) from operations, net of tax $ (11,484) $ 888
Gain (loss) on dispositions, net of tax (1) (693,202) 118
Total $ (704,686) $ 1,006
(1) In the second quarter of 2008, the Company recorded an after-tax loss of $693 million to write down the net assets of NMG to estimated fair value.
9
3. TRIBUNE COMPANY
FIRST HALF RESULTS OF OPERATIONS
(In thousands)
FIRST HALF (A)
%
2008 2007 Change
OPERATING REVENUES $ 2,115,588 $ 2,264,234 (6.6)
OPERATING EXPENSES (B)
Before Write-downs of Intangible Assets 1,802,200 1,921,805 (6.2)
Write-downs of Intangible Assets 3,843,111 - NM
After Write-downs of Intangible Assets 5,645,311 1,921,805 NM
OPERATING PROFIT (LOSS) (C)
Before Write-downs of Intangible Assets 313,388 342,429 (8.5)
Write-downs of Intangible Assets (3,843,111) - NM
After Write-downs of Intangible Assets (3,529,723) 342,429 NM
Net Income on Equity Investments (D) 34,929 41,394 (15.6)
Interest and Dividend Income 7,126 6,979 2.1
Interest Expense (463,004) (195,658) 136.6
Non-Operating Items (E) 95,175 (111,058) NM
Income (Loss) from Continuing Operations Before Income Taxes (3,855,497) 84,086 NM
Income Taxes (E) 1,862,752 (43,152) NM
Income (Loss) from Continuing Operations (1,992,745) 40,934 NM
Income (Loss) from Discontinued Operations, net of tax (F) (717,742) (27,953) NM
NET INCOME (LOSS) $ (2,710,487) $ 12,981 NM
10
4. (A) 2008 first half: Dec. 31, 2007 to June 29, 2008. (26 weeks)
2007 first half: Jan. 1, 2007 to July 1, 2007. (26 weeks)
(B) Operating expenses for the first half of 2008 included charges of $3.8 billion for the write-downs of the Company's newspaper reporting unit goodwill
and newspaper masthead intangible assets, a charge of $71 million for severance and special termination benefits ($45 million at publishing, $17 million
at corporate, and $9 million at broadcasting and entertainment), a charge of $13 million related to the Company's management equity incentive plan, a
gain of $83 million related to the sale of the Company's studio production lot located in Hollywood, California, and a gain of $23 million related to the
sale of other real estate.
Operating expenses for the first half of 2007 included a charge of $28 million for severance ($25 million at publishing and $3 million at corporate), a
charge of $26 million for stock-based compensation expense, and a charge of $24 million for the write-off of Los Angeles Times plant equipment related
to the previously closed San Fernando Valley facility.
(C) Operating profit excludes interest and dividend income, interest expense, equity income and losses, non-operating items and income taxes.
(D) Net income on equity investments for the first half of 2008 included a $13 million impairment write-down at one of the Company's interactive investments.
(E) The first half of 2008 included the following non-operating items:
Pretax After-tax
Gain (Loss) Gain (Loss)
Gain on PHONES and related investment (1) $ 106,320 $ 105,065
Write-down of equity investment (2) (10,312) (10,190)
Other, net (833) (1,047)
Income tax adjustment (3) - 1,859,358
Total non-operating items $ 95,175 $ 1,953,186
The first half of 2007 included the following non-operating items:
Pretax After-tax
Gain (Loss) Gain (Loss)
Loss on PHONES and related investment (1) $ (97,175) $ (59,277)
Strategic transaction expenses (4) (35,398) (29,428)
Other, net (5) 21,515 13,123
Total non-operating items $ (111,058) $ (75,582)
(1) The gain on PHONES and related investment in the first half of 2008 represented primarily the change in fair values of the Company's PHONES and
the related Time Warner shares. Effective Dec. 31, 2007, the Company has elected to account for its PHONES utilizing the fair value option under Financial
Accounting Standards Board Statement No. 159, quot;The Fair Value Option for Financial Assets and Financial Liabilities.quot; As a result of this election, the
Company no longer measures the changes in fair value of just the derivative component of the PHONES, but instead measures the changes in fair value
of the entire PHONES debt. The loss on PHONES and related investment in the first half of 2007 represented primarily the change in fair values of the
derivative component of the Company's PHONES and the related Time Warner shares.
(2) On June 30, 2008, the Company received net proceeds of $22 million from the sale of its investment in ShopLocal, LLC. The Company recorded a write-down
of $10 million in the second quarter of 2008 to reduce the carrying value of the investment to the amount of net proceeds received.
(3) In the first quarter of 2008, the Company filed an election to be treated as a subchapter S corporation. As a result, essentially all of the Company's net
deferred tax liabilities have been eliminated and such adjustment was recorded as a reduction in the Company's provision for income tax expense in the
first quarter of 2008.
(4) Includes expenses related to the Company's strategic review and going-private transaction approved by the Company's board of directors on April 1, 2007
and completed in December 2007. These expenses included a $13.5 million pretax loss from refinancing certain credit agreements.
(5) Other, net in the first half of 2007 included an $18 million pretax gain from the settlement of the Company's Hurricane Katrina insurance claim.
(F) In May 2008, the Company announced an agreement with a subsidiary of Cablevision Systems Corporation to form a new limited liability company (quot;Newsday LLCquot;)
to own and operate the Company's Newsday Media Group business (quot;NMGquot;). The Company closed on this transaction on July 29, 2008 and recorded a pretax
loss of $692 million ($693 million after taxes) in the second quarter of 2008 to write down the net assets of NMG to estimated fair value. At the closing, the Company
received a special distribution from the limited liability company of $612 million in cash and $18 million in prepaid rent under leases for certain NMG facilities retained
by the Company. Tribune owns approximately 3% of the equity in Newsday LLC. In February 2007, the Company announced an agreement to sell the New York
edition of Hoy , the Company's Spanish-language daily newspaper (quot;Hoy , New Yorkquot;). The sale of Hoy , New York closed in May 2007. In March 2007, the Company
announced its intentions to sell its Southern Connecticut Newspapers— The Advocate (Stamford) and Greenwich Time (collectively quot;SCNIquot;). The sale of SCNI
closed on November 1, 2007, and excluded the SCNI real estate in Stamford and Greenwich, Connecticut, which was sold in a separate transaction that closed on
April 22, 2008. During the third quarter of 2007, the Company entered into negotiations to sell the stock of one of its subsidiaries, EZ Buy and EZ Sell Recycler
Corporation (quot;Recyclerquot;). The sale of Recycler closed on Oct. 17, 2007. Selected financial information related to discontinued operations is summarized as follows:
First Half
2008 2007
Income (loss) from operations, net of tax $ (24,033) $ 5,101
Loss on dispositions, net of tax (1) (2) (693,709) (33,054)
Total $ (717,742) $ (27,953)
(1) In the first half of 2008, the Company recorded an after-tax loss of $693 million to write down the net assets of NMG to estimated fair value.
(2) In the first half of 2007, the Company recorded an after-tax loss of $33 million to write down the SCNI net assets to estimated fair value, less costs to sell.
11
6. (A) The Company uses cash operating expenses to evaluate internal performance. The Company has presented cash operating expenses because it is a common
measure used by rating agencies, lenders and financial analysts. Cash operating expense is not a measure of financial performance under generally accepted
accounting principles (quot;GAAPquot;) and should not be considered in isolation or as a substitute for measures of performance prepared in accordance with
GAAP.
Following is a reconciliation of operating expenses to cash operating expenses for the second quarter of 2008:
Broadcasting and
Publishing Entertainment Corporate Consolidated
Operating expenses $ 4,468,473 $ 305,851 $ 10,127 $ 4,784,451
Less: depreciation and amortization expense 39,226 12,728 253 52,207
Less: write-downs of intangible assets 3,843,111 - - 3,843,111
Cash operating expenses $ 586,136 $ 293,123 $ 9,874 $ 889,133
Following is a reconciliation of operating expenses to cash operating expenses for the second quarter of 2007:
Broadcasting and
Publishing Entertainment Corporate Consolidated
Operating expenses $ 702,242 $ 285,225 $ 13,972 $ 1,001,439
Less: depreciation and amortization expense 38,139 12,725 317 51,181
Cash operating expenses $ 664,103 $ 272,500 $ 13,655 $ 950,258
Following is a reconciliation of operating expenses to cash operating expenses for the first half of 2008:
Broadcasting and
Publishing Entertainment Corporate Consolidated
Operating expenses $ 5,144,349 $ 462,338 $ 38,624 $ 5,645,311
Less: depreciation and amortization expense 78,220 25,461 556 104,237
Less: write-downs of intangible assets 3,843,111 - - 3,843,111
Cash operating expenses $ 1,223,018 $ 436,877 $ 38,068 $ 1,697,963
Following is a reconciliation of operating expenses to cash operating expenses for the first half of 2007:
Broadcasting and
Publishing Entertainment Corporate Consolidated
Operating expenses $ 1,381,341 $ 506,851 $ 33,613 $ 1,921,805
Less: depreciation and amortization expense 77,157 25,479 558 103,194
Cash operating expenses $ 1,304,184 $ 481,372 $ 33,055 $ 1,818,611
(B) Cash operating expenses for the second quarter of 2008 included a charge of $15 million for severance and special termination benefits at publishing and for
the first half of 2008 included a charge of $71 million for severance and special termination benefits ($45 million at publishing, $17 million at corporate and
$9 million at broadcasting and entertainment). Cash operating expenses for the second quarter of 2008 included a charge of $5 million related to the Company's
management equity incentive plan ($3 million at publishing, $1 million at broadcasting and entertainment and $1 million at corporate), and for the first half
of 2008 included a charge of $13 million related to the Company's management equity incentive plan ($7 million at publishing, $3 million at broadcasting and
entertainment, and $3 million at corporate). In addition, publishing cash operating expenses for the second quarter of 2008 included a gain of $23 million
related to the sale of real estate, and broadcasting and entertainment cash operating expenses for the first half of 2008 included a gain of $83 million related
to the sale of the Company's studio production lot. Cash operating expenses for the second quarter of 2007 included a severance charge of $27 million
($25 million at publishing and $2 million at corporate) and for the first half of 2007 included a severance charge of $28 million ($25 million at publishing and
$3 million at corporate). Cash operating expenses for the second quarter of 2007 included stock-based compensation of $8 million ($5 million at publishing,
$2 million at broadcasting and entertainment and $1 million at corporate) and for the first half of 2007 included stock-based compensation of $26 million
($12 million at publishing, $5 million at broadcasting and entertainment, and $9 million at corporate). In addition, publishing cash operating expenses for the
second quarter and first half of 2007 included a charge of $24 million for the write-off of Los Angeles Times plant equipment related to the previously closed
San Fernando Valley facility.
(C) Operating cash flow is defined as operating profit before depreciation and amortization and write-downs of intangible assets. The Company uses operating
cash flow along with operating profit and other measures to evaluate the financial performance of the Company's business segments. The Company has
presented operating cash flow because it is a common alternative measure of financial performance used by rating agencies, lenders and financial analysts.
These groups use operating cash flow along with other measures as a way to estimate the value of a company. The Company's definition of
operating cash flow may not be consistent with that of other companies. Operating cash flow does not represent cash provided by operating activities
as reflected in the Company's consolidated statements of cash flows, is not a measure of financial performance under GAAP and should not be
considered in isolation or as a substitute for measures of performance prepared in accordance with GAAP.
13
7. (D) Operating profit for each segment excludes interest and dividend income, interest expense, equity income and losses, non-operating items and
income taxes.
(E) The $3.8 billion of non-cash impairment charges for the second quarter 2008 related to write-downs of the Company’s newspaper reporting unit goodwill
and newspaper masthead intangible assets.
Following is a reconciliation of operating profit (loss) to operating cash flow for the second quarter of 2008:
Broadcasting and
Publishing Entertainment Corporate Consolidated
Operating profit (loss) $ (3,767,918) $ 103,403 $ (10,127) $ (3,674,642)
Add back: depreciation and amortization expense 39,226 12,728 253 52,207
Add back: write-downs of intangible assets 3,843,111 - - 3,843,111
Operating cash flow $ 114,419 $ 116,131 $ (9,874) $ 220,676
Following is a reconciliation of operating profit (loss) to operating cash flow for the second quarter of 2007:
Broadcasting and
Publishing Entertainment Corporate Consolidated
Operating profit (loss) $ 81,336 $ 107,734 $ (13,972) $ 175,098
Add back: depreciation and amortization expense 38,139 12,725 317 51,181
Operating cash flow $ 119,475 $ 120,459 $ (13,655) $ 226,279
Following is a reconciliation of operating profit (loss) to operating cash flow for the first half of 2008:
Broadcasting and
Publishing Entertainment Corporate Consolidated
Operating profit (loss) $ (3,729,697) $ 238,598 $ (38,624) $ (3,529,723)
Add back: depreciation and amortization expense 78,220 25,461 556 104,237
Add back: write-downs of intangible assets 3,843,111 - - 3,843,111
Operating cash flow $ 191,634 $ 264,059 $ (38,068) $ 417,625
Following is a reconciliation of operating profit (loss) to operating cash flow for the first half of 2007:
Broadcasting and
Publishing Entertainment Corporate Consolidated
Operating profit (loss) $ 206,926 $ 169,116 $ (33,613) $ 342,429
Add back: depreciation and amortization expense 77,157 25,479 558 103,194
Operating cash flow $ 284,083 $ 194,595 $ (33,055) $ 445,623
14