SlideShare ist ein Scribd-Unternehmen logo
1 von 12
Downloaden Sie, um offline zu lesen
Celanese Corporation
                                                                                                     Investor Relations

Corporate News Release                                                                               1601 West LBJ Freeway
                                                                                                     Dallas, Texas 75234-6034


Celanese Corporation Reports Record Second Quarter Results; Reaffirms 2008 Outlook
Second quarter highlights:
       Net sales increased 20% to $1,868 million from prior year
       Operating profit increased to $207 million from $71 million in prior year
       Net earnings increased to $134 million from a loss of $117 million in prior year
       Operating EBITDA increased 24% to $406 million
       Diluted EPS from continuing operations increased to $1.21 from a loss of $0.81 in prior year
       Adjusted EPS increased to $1.20 from $0.85 in prior year
       Reaffirms 2008 outlook for adjusted earnings per share of between $3.60 and $3.85 and operating
       EBITDA of between $1,355 million and $1,415 million

                                                                Three Months Ended        Six Months Ended
                                                                      June 30,                 June 30,
                                                                 2008          2007       2008          2007
   (in $ millions, except per share data)
                                                                   1,868                    3,714
   Net sales                                                                     1,556                    3,111
                                                                                    71                      277
                                                                     207                      441
   Operating profit
   Net earnings                                                                                              84
                                                                     134                      279
                                                                                  (117)
                       1
   Operating EBITDA                                                  406                      787
                                                                                   328                      643
                                                                   $1.21                    $2.08
   Diluted EPS - continuing operations                                          ($0.81)                  ($0.04)
                                                                   $0.80                    $1.67
   Diluted EPS - Total                                                          ($0.76)                   $0.50
                 1
   Adjusted EPS                                                    $1.20                    $2.26
                                                                                 $0.85                    $1.62
   1
       Non-U.S. GAAP measures. See reconciliation in tables 1 and 6.


Dallas, July 21, 2008: Celanese Corporation (NYSE: CE) today reported record net sales of $1,868 million, a 20
percent increase from the prior year’s results, as higher pricing on continued strong demand, positive currency
impacts, and higher volumes associated with the company’s growth strategy in Asia, all contributed to strong top-
line growth. Operating profit more than doubled to $207 million from $71 million in the prior year period. The
company’s growth in Asia and certain advantaged raw material positions helped to mitigate the impact of
significantly higher overall raw material and energy costs. Last year’s results included $105 million of other
expenses primarily related to a long-term management compensation program and also included the impact of
the unplanned outage at the company’s Clear Lake, Texas, facility. Net earnings were $134 million compared
with a loss of $117 million in the same period last year. The second quarter 2008 results included approximately
$69 million in net losses from discontinued operations, principally related to a previously announced litigation
settlement. The 2007 results included the impact of the company’s debt refinancing transaction, which was
completed in April 2007.


Adjusted earnings per share for the second quarter were $1.20, a 41 percent increase over the prior year period,
reflecting strong volume and pricing on continued strong demand, as well as increased dividends from the
company’s strategic affiliates. This quarter’s results excluded approximately $24 million of certain other
adjustments, primarily related to the company’s revitalization activities. Operating EBITDA increased to a record
$406 million, up 24 percent from last year.
Page 2 of 12

“We delivered record second quarter earnings despite challenging global economic conditions and significant
inflation in raw material and energy pricing,” said David Weidman, chairman and chief executive officer. “Once
again, our results demonstrate the strength and earnings power of Celanese’s attractive portfolio of businesses.”


Recent Highlights
        Successfully started up its newly constructed 20,000 ton GUR® ultra-high molecular weight polyethylene
        (UHMW-PE) facility, 100,000 ton acetic anhydride facility, and 300,000 ton vinyl acetate monomer
        facility, all located at the company’s integrated chemical complex in Nanjing, China.
        Signed an agreement to establish a 20,000 square-meter commercial and technology center in Shanghai.
        Expected to be completed in early 2010, the new center will combine the headquarters for Celanese’s Asia
        businesses, customer application development and research and development facilities.
        Celanese’s Nutrinova business and BRAIN AG, a leading European biotech company, identified all-
        natural compounds for high intensity sweeteners and sweetness enhancers.
        Introduced EcoVAE™, a new vinyl acetate/ethylene (VAE) emulsion technology specially designed to
        facilitate the manufacture of high quality, eco-friendly paints for North America.
        Resolved a legacy litigation matter by entering into a settlement agreement relating to sales by the
        polyester staple fibers business, which Hoechst AG sold to KoSa, Inc. in 1998.
        Announced intent to divest ownership interest in legacy Infraserv investments located in Knapsack,
        Gendorf, and Wiesbaden, Germany, where Celanese no longer has manufacturing operations.


Second Quarter Segment Overview

Advanced Engineered Materials

Advanced Engineered Materials continued to execute its growth strategy, as global expansion offset the impacts
of ongoing challenges in the U.S. automotive sector and initial signs of weakness in the European sector. Net
sales increased to $300 million from $257 million in the same period last year, primarily on positive currency
impacts, as well as higher volumes, particularly in Asia. Operating profit increased to $37 million from $32
million in the prior year period, as increased volumes and lower overall expense more than offset significantly
higher raw material and energy costs, including ethylene and other petroleum-based feedstocks. Operating
EBITDA, however, was $68 million compared with $70 million in the same period last year, mainly due to lower
earnings from equity affiliates.

Consumer Specialties
Consumer Specialties continued to contribute stable earnings, driven by its expansion in Asia and successful
integration of its acquired Acetate Products Limited (APL) business. Net sales increased to $292 million
compared with $281 million in the same period last year, driven by higher pricing on continued strong demand
and positive currency impacts. Higher acetate tow volumes helped to offset lower acetate flake volumes resulting
from the company’s strategic decision to shift flake production to its expanded acetate China ventures, and
slightly lower volumes for Sunett®, the company’s high-intensity food sweetener business. Operating profit was
$46 million, $2 million lower than last year’s results, as the higher pricing could not fully offset significantly
higher raw material and energy costs in the period. Operating EBITDA increased to $107 million from $104
million in the same period last year, however, on higher dividends from the company’s China ventures.
Page 3 of 12

Industrial Specialties
Continued revitalization of the Industrial Specialties businesses delivered improved results, despite continued
softness in certain markets and significantly higher raw material costs. Net sales increased to $386 million from
$355 million in the same period last year, primarily driven by higher pricing related to increased raw material
costs, as well as favorable currency impacts. Increased volumes related to the company’s strategic expansion in
Asia were offset by volume declines in North American and southern European painting and coating
applications. Operating profit increased to $20 million, compared with a loss of $1 million in the prior year
period, as higher pricing more than offset higher raw material costs and the lower volumes. The 2007 results
included approximately $19 million of expense related to the company’s revitalization activities. Operating
EBITDA was $37 million compared with $34 million in the second quarter of 2007.


Acetyl Intermediates
Strategic expansions in Asia, attractive industry fundamentals, and advantaged raw material positions drove
significant sales and earnings growth in Acetyl Intermediates. Net sales were $1,067 million compared with $829
million in the same period last year, driven by higher pricing on continued strong demand, increased volumes
from its Nanjing acetic acid unit, and positive currency impacts. Operating profit increased to $148 million from
$91 million and operating EBITDA increased to $227 million from $148 million in the same period last year, as
the volume and pricing more than offset higher raw material and energy costs in the period. Increased dividends
from the company’s Ibn Sina methanol and MTBE cost affiliate also contributed to the improved results. The
prior year’s operating results included a partial impact of the unplanned outage at the company’s Clear Lake,
Texas, facility.


Taxes
The tax rate for adjusted earnings per share was 26 percent in the second quarter of 2008 compared with 28
percent in the second quarter of 2007. The U.S. GAAP effective tax rate for continuing operations for the second
quarter of 2008 was 18 percent compared with 26 percent in the same period last year. The decrease in the U.S.
GAAP effective tax rate for the period ended June 30, 2008 was primarily due to the U.S. income tax effect
resulting from the maturity of cross currency swap arrangements in June 2008. The tax rate for adjusted
earnings per share is based upon the company’s previous guidance which did not include these items. Cash taxes
for the first six months of 2008 were $45 million, $96 million lower than the prior year period.


Equity and Cost Investments
Earnings from equity investments and dividends from cost investments, which are reflected in the company’s
adjusted earnings and operating EBITDA, totaled $92 million in the second quarter versus $72 million in the
same period last year. Higher dividends from the company’s acetate China ventures and Ibn Sina cost affiliate
offset lower earnings from the Advanced Engineered Materials equity affiliates. Equity and cost investment
dividends, which are included in cash flows, were $87 million compared with $59 million in the prior year period.
Page 4 of 12

Cash Flow
The company generated $346 million in cash from operating activities during the first six months of 2008
compared with $79 million generated during the same period last year, driven by strong operating performance
and lower cash taxes. The 2008 results included a $107 million payment related to the resolution of a legacy
litigation matter and an increased use of cash in trade working capital. The 2007 results included a $74 million
cash payment related to a long-term management compensation program.


Cash used in investing activities was $33 million at the end of the second quarter and included a $93 million
payment to settle a cross currency swap that matured in June 2008.


During the first half of 2008, the company repurchased approximately $126 million of its outstanding common
shares and has approximately $274 million in authorized purchases remaining. Net debt at the end of the second
quarter was $2,640 million, a decrease of $91 million from the fourth quarter of 2007. Cash and cash equivalents
at the end of the second quarter were $983 million compared with $825 million at the end of 2007.


During the quarter, the company received a scheduled progress payment of $311 million related to the relocation
of Ticona’s Kelsterbach production facility, reflected in investing activities; and $59 million in associated value
added tax, reflected in operating activities.


Outlook

The company reaffirmed its full year outlook for adjusted earnings per share to between $3.60 and $3.85 based on
the strength of its performance in the first half of 2008 and continued execution of its earnings growth strategy.
On a comparable basis, 2007 results were $3.29 per share. The guidance is based on an adjusted tax rate of 26
percent and an estimated year-end weighted average of 166 million diluted shares outstanding. The company
also reaffirmed its operating EBITDA guidance range of between $1,355 million and $1,415 million.


“The rapid escalation of raw material and energy prices, along with concerns of slowing economic growth in the
U.S. and parts of Europe have created challenges in the short-term,” said Weidman. “With our geographic and
end market diversity, advantaged feedstock positions, and an integrated business model, we believe that Celanese
is well-positioned to mitigate the potential impact of today’s environment.”


Contacts:
Investor Relations                  Media – U.S.                                Media - Europe
Mark Oberle                         Gretchen Rosswurm                           Jens Kurth
Phone: +1 972 443 4464              Phone: +1 972 443 4847                      Phone: +49 69 305 7137
Telefax: +1 972 443 8519            Telefax: +1 972 443 8519                    Telefax: +49 69 305 36787
Mark.Oberle@celanese.com            Gretchen.Rosswurm@celanese.com              J.Kurth@celanese.com

As a global leader in the chemicals industry, Celanese Corporation makes products essential to everyday living. Our
products, found in consumer and industrial applications, are manufactured in North America, Europe and Asia. Net
sales totaled $6.4 billion in 2007, with approximately 70% generated outside of North America. Known for
operational excellence and execution of its business strategies, Celanese delivers value to customers around the globe
with innovations and best-in-class technologies. Based in Dallas, Texas, the company employs approximately 8,400
employees worldwide. For more information on Celanese Corporation, please visit the company's website at
www.celanese.com.
Page 5 of 12
Forward-Looking Statements

This release may contain “forward-looking statements,” which include information concerning the company’s plans, objectives, goals, strategies,
future revenues or performance, capital expenditures, financing needs and other information that is not historical information. When used in
this release, the words “outlook,” “forecast,” “estimates,” “expects,” “anticipates,” “projects,” “plans,” “intends,” “believes,” and variations of
such words or similar expressions are intended to identify forward-looking statements. All forward-looking statements are based upon current
expectations and beliefs and various assumptions. There can be no assurance that the company will realize these expectations or that these beliefs
will prove correct. There are a number of risks and uncertainties that could cause actual results to differ materially from the forward-looking
statements contained in this release. Numerous factors, many of which are beyond the company’s control, could cause actual results to differ
materially from those expressed as forward-looking statements. Certain of these risk factors are discussed in the company’s filings with the
Securities and Exchange Commission. Any forward-looking statement speaks only as of the date on which it is made, and the company
undertakes no obligation to update any forward-looking statements to reflect events or circumstances after the date on which it is made or to
reflect the occurrence of anticipated or unanticipated events or circumstances.

Reconciliation of Non-U.S. GAAP Measures to U.S. GAAP

This release reflects five performance measures, operating EBITDA, affiliate EBITDA, adjusted earnings per share, net debt and adjusted free cash
flow, as non-U.S. GAAP measures. The most directly comparable financial measure presented in accordance with U.S. GAAP in our consolidated
financial statements for operating EBITDA is operating profit; for affiliate EBITDA is equity in net earnings of affiliates; for adjusted earnings
per share is earnings per common share-diluted; for net debt is total debt; and for adjusted free cash flow is cash flow from operations.


Use of Non-U.S. GAAP Financial Information

           Operating EBITDA, a measure used by management to measure performance, is defined as operating profit from continuing
           operations, plus equity in net earnings from affiliates, other income and depreciation and amortization, and further adjusted for other
           charges and adjustments. We provide guidance on operating EBITDA and are unable to reconcile forecasted operating EBITDA to a
           GAAP financial measure because a forecast of Other Charges and Adjustments is not practical. Our management believes operating
           EBITDA is useful to investors because it is one of the primary measures our management uses for its planning and budgeting processes
           and to monitor and evaluate financial and operating results. Operating EBITDA is not a recognized term under U.S. GAAP and does
           not purport to be an alternative to operating profit as a measure of operating performance or to cash flows from operating activities as
           a measure of liquidity. Because not all companies use identical calculations, this presentation of operating EBITDA may not be
           comparable to other similarly titled measures of other companies. Additionally, operating EBITDA is not intended to be a measure of
           free cash flow for management’s discretionary use, as it does not consider certain cash requirements such as interest payments, tax
           payments and debt service requirements nor does it represent the amount used in our debt covenants.

           Affiliate EBITDA, a measure used by management to measure performance of its equity investments, is defined as the proportional
           operating profit plus the proportional depreciation and amortization of its equity investments. Affiliate EBITDA, including Celanese
           Proportional Share of affiliate information on Table 8, is not a recognized term under U.S. GAAP and is not meant to be an
           alternative to operating cash flow of the equity investments. The company has determined that it does not have sufficient ownership
           for operating control of these investments to consider their results on a consolidated basis. The company believes that investors should
           consider affiliate EBITDA when determining the equity investments’ overall value in the company.

           Adjusted earnings per share is a measure used by management to measure performance. It is defined as net earnings (loss) available to
           common shareholders plus preferred dividends, adjusted for other charges and adjustments, and divided by the number of basic
           common shares, diluted preferred shares, and options valued using the treasury method. We provide guidance on an adjusted earnings
           per share basis and are unable to reconcile forecasted adjusted earnings per share to a GAAP financial measure without unreasonable
           effort because a forecast of Other Items is not practical. We believe that the presentation of this non-U.S. GAAP measure provides
           useful information to management and investors regarding various financial and business trends relating to our financial condition
           and results of operations, and that when U.S. GAAP information is viewed in conjunction with non-U.S. GAAP information, investors
           are provided with a more meaningful understanding of our ongoing operating performance. This non-U.S. GAAP information is not
           intended to be considered in isolation or as a substitute for U.S. GAAP financial information.

           The tax rate used for adjusted earnings per share is the tax rate based on our initial guidance, less changes in uncertain tax positions.
           We adjust this tax rate during the year only if there is a substantial change in our underlying operations; an updated forecast would
           not necessarily result in a change to our tax rate used for adjusted earnings per share. The adjusted tax rate may differ significantly
           from the tax rate used for U.S. GAAP reporting in any given reporting period. It is not practical to reconcile our prospective adjusted
           tax rate to the actual U.S. GAAP tax rate in any future period.

           Net debt is defined as total debt less cash and cash equivalents. We believe that the presentation of this non-U.S. GAAP measure
           provides useful information to management and investors regarding changes to the company’s capital structure. Our management and
           credit analysts use net debt to evaluate the company's capital structure and assess credit quality. This non-U.S. GAAP information is
           not intended to be considered in isolation or as a substitute for U.S. GAAP financial information.

           Adjusted free cash flow is defined as cash flow from operations less capital expenditures, other productive asset purchases, operating
           cash from discontinued operations and certain other charges and adjustments. We believe that the presentation of this non-U.S.
           GAAP measure provides useful information to management and investors regarding changes to the company’s cash flow. Our
           management and credit analysts use adjusted free cash flow to evaluate the company’s liquidity and assess credit quality. This non-
           U.S. GAAP information is not intended to be considered in isolation or as a substitute for U.S. GAAP financial information.

Results Unaudited
The results presented in this release, together with the adjustments made to present the results on a comparable basis, have not been audited and
are based on internal financial data furnished to management. Quarterly results should not be taken as an indication of the results of operations
to be reported for any subsequent period or for the full fiscal year.
Page 6 of 12
Preliminary Consolidated Statements of Operations- Unaudited

                                                               Three Months Ended           Six Months Ended
                                                                     June 30,                    June 30,
(in $ millions, except per share data)                         2008           2007         2008           2007
Net sales                                                         1,868                       3,714
                                                                                 1,556                       3,111
                                                                 (1,472)                     (2,900)
  Cost of sales                                                                 (1,219)                     (2,415)
Gross profit                                                        396            337          814            696

                                                                   (138)                      (274)
 Selling, general and administrative expenses                                     (122)                      (238)
                             1
 Amortization of Intangibles                                        (20)                       (39)
                                                                                   (17)                       (35)
                                                                    (18)                       (41)
 Research and development expenses                                                 (19)                       (36)
                                                                     (7)                       (23)
 Other (charges) gains, net                                                       (105)                      (106)
                                                                     (3)                         4
 Foreign exchange gain (loss), net                                                   -                          -
                                                                     (3)                         -
 Gain (loss) on disposition of assets, net                                          (3)                        (4)
Operating profit                                                    207             71         441            277

                                                                     17                         27
 Equity in net earnings of affiliates                                               23                         41
                                                                    (63)                      (130)
 Interest expense                                                                  (61)                      (133)
                                                                      -                          -
 Refinancing expenses                                                             (256)                      (256)
                                                                     10                         19
 Interest income                                                                    11                         25
                                                                     75                        103
 Dividend income - cost investments                                                 49                         64
                                                                      1                          5
 Other income (expense), net                                                        (5)                       (15)
Earnings (loss) from continuing operations
 before tax and minority interests                                  247           (168)        465               3

                                                                    (45)                      (118)
 Income tax (provision) benefit                                                    44                           (5)
Earnings (loss) from continuing operations
 before minority interests                                          202           (124)        347              (2)

                                                                      1                          1
 Minority interests                                                                  -                           -
Earnings (loss) from continuing operations                          203           (124)        348              (2)

Earnings (loss) from discontinued operations:
                                                                   (112)                      (112)
  Earnings ( loss) from operation of discontinued operations                        (5)                        38
                                                                                    16                         47
                                                                                                  -
                                                                      -
  Gain on disposal of discontinued operations
                                                                                     (4)                        1
                                                                     43                          43
 Income tax benefit
                                                                                      7         (69)           86
Earnings (loss) from discontinued operations                        (69)

Net earnings (loss)                                                 134           (117)        279             84

                                                                     (2)                         (5)
Cumulative preferred stock dividends                                                (3)                         (5)
Net earnings (loss) available to common
 shareholders                                                       132           (120)        274             79

Earnings (loss) per common share - basic:
                                                                  $1.33                      $2.26
 Continuing operations                                                          ($0.81)                     ($0.04)
                                                                  (0.46)                     (0.45)
 Discontinued operations                                                          0.05                        0.54
Net earnings (loss) available to common shareholders              $0.87         ($0.76)      $1.81           $0.50

Earnings (loss) per common share - diluted:
                                                                  $1.21                      $2.08
 Continuing operations                                                          ($0.81)                     ($0.04)
                                                                  (0.41)                     (0.41)
 Discontinued operations                                                          0.05                        0.54
Net earnings (loss) available to common shareholders              $0.80         ($0.76)      $1.67           $0.50

Weighted average shares - basic                                   150.9                      151.4
                                                                                 156.9                      158.1
Weighted average shares - diluted                                 167.8                      167.6
                                                                                 156.9                      158.1
1
    Customer related intangibles
Page 7 of 12

Preliminary Consolidated Balance Sheets - Unaudited
                                                                June 30,      December 31,
                                                                  2008            2007
(in $ millions)
ASSETS
Current assets:
                                                                      983
  Cash and cash equivalents                                                           825
  Receivables:
                                                                     1,061
    Trade - third party and affiliates, net                                         1,009
                                                                       381
    Other                                                                             437
                                                                       754
  Inventories                                                                         636
                                                                        68
  Deferred income taxes                                                                70
                                                                        24
  Marketable securities, at fair value                                                 46
                                                                        30
  Other assets                                                                         40
Total current assets                                                 3,301          3,063

                                                                       803
 Investments                                                                          814
                                                                     2,542
 Property, plant and equipment, net                                                 2,362
                                                                        50
 Deferred income taxes                                                                 10
                                                                       208
 Marketable securities, at fair value                                                 209
                                                                       376
 Other assets                                                                         309
                                                                       897
 Goodwill                                                                             866
                                                                       437
 Intangible assets, net                                                               425
Total assets                                                         8,614          8,058

LIABILITIES AND SHAREHOLDERS' EQUITY
Current liabilities:
 Short-term borrowings and current
                                                                       252
  installments of long-term debt - third party and affiliates                         272
                                                                       829
 Trade payables - third parties and affiliates                                        818
                                                                       824
 Other liabilities                                                                    888
                                                                        30
 Deferred income taxes                                                                 30
                                                                        38
 Income taxes payable                                                                  23
Total current liabilities                                            1,973          2,031

                                                                     3,371
 Long-term debt                                                                     3,284
                                                                       277
 Deferred income taxes                                                                265
                                                                       259
 Income taxes payable                                                                 220
                                                                       676
 Benefit obligations                                                                  696
                                                                       822
 Other liabilities                                                                    495
                                                                         4
 Minority interests                                                                     5
 Shareholders' equity:
                                                                                        -
                                                                         -
  Preferred stock
                                                                                        -
                                                                         -
  Common stock
                                                                                     (403)
                                                                      (529)
  Treasury stock, at cost
                                                                       494
  Additional paid-in capital                                                          469
                                                                     1,061
  Retained earnings                                                                   799
                                                                       206
  Accumulated other comprehensive income (loss), net                                  197
                                                                     1,232          1,062
  Total shareholders' equity
Total liabilities and shareholders' equity                           8,614          8,058
Page 8 of 12
Table 1

Segment Data and Reconciliation of Operating Profit (Loss) to Operating EBITDA -
 a Non-U.S. GAAP Measure

                                                                              Three Months Ended                   Six Months Ended
                                                                                    June 30,                            June 30,
(in $ millions)                                                                2008          2007                  2008          2007
Net Sales
                                                                                    300                                 594
 Advanced Engineered Materials                                                                         257                                519
                                                                                    292                                 574
 Consumer Specialties                                                                                  281                                550
                                                                                    386                                 751
 Industrial Specialties                                                                                355                                701
 Acetyl Intermediates                                                             1,067                829            2,163             1,668
                  1
 Other Activities                                                                     1                                   1
                                                                                                         -                                  1
 Intersegment eliminations                                                         (178)              (166)            (369)             (328)
Total                                                                             1,868              1,556            3,714             3,111

Operating Profit (Loss)
 Advanced Engineered Materials                                                        37                32               67                   68
                                                                                      46                                 96
 Consumer Specialties                                                                                   48                                    96
 Industrial Specialties                                                               20                (1)              37                   11
                                                                                     148                                325
 Acetyl Intermediates                                                                                   91                                   223
                  1
 Other Activities                                                                    (44)                               (84)
                                                                                                       (99)                                 (121)
Total                                                                                207                71              441                  277

Equity Earnings, Cost - Dividend Income and Other Income Expense
                                                                                      11                                 20
 Advanced Engineered Materials                                                                          16                                   30
 Consumer Specialties                                                                 48                35               48                  35
                                                                                       -                                  -
 Industrial Specialties                                                                                  -                                    -
 Acetyl Intermediates                                                                 33                18               62                  23
                  1
 Other Activities                                                                      1                (2)               5                   2
Total                                                                                 93                67              135                  90


Other Charges and Other Adjustments 2
 Advanced Engineered Materials                                                         1                 5                 2                  5
                                                                                       -                                   1
 Consumer Specialties                                                                                    8                                    9
 Industrial Specialties                                                                3                19                 8                 19
                                                                                      12                                  20
 Acetyl Intermediates                                                                                   13                                   26
                  1
 Other Activities                                                                      8                                  15
                                                                                                        72                                   76
Total                                                                                 24               117                46                135

Depreciation and Amortization Expense
                                                                                      19                                 39
 Advanced Engineered Materials                                                                          17                                   34
 Consumer Specialties                                                                 13                13               27                  24
                                                                                      14                                 28
 Industrial Specialties                                                                                 16                                   30
 Acetyl Intermediates                                                                 34                26               66                  50
                  1
 Other Activities                                                                                        1                                    3
                                                                                                                          5
                                                                                       2
Total                                                                                 82                73              165                 141

Operating EBITDA
                                                                                      68                                128
 Advanced Engineered Materials                                                                          70                                  137
                                                                                     107                                172
 Consumer Specialties                                                                                  104                                  164
                                                                                      37                                 73
 Industrial Specialties                                                                                 34                                   60
                                                                                     227                                473
 Acetyl Intermediates                                                                                  148                                  322
                  1
 Other Activities                                                                    (33)                               (59)
                                                                                                       (28)                                 (40)
Total                                                                                406               328              787                 643
1
    Other Activities primarily includes corporate selling, general and administrative expenses and the results from captive insurance companies
2
    Excludes adjustments to minority interest, net interest, taxes, depreciation, amortization and discontinued operations (See Table 7).
Page 9 of 12
Table 2

Factors Affecting Second Quarter 2008 Segment Net Sales Compared to Second Quarter 2007
                                                                                                                  Other 1
                                                            Volume              Price        Currency                                    Total
(in percent)
  Advanced Engineered Materials                                 8%               0%               9%                   0%                17%
  Consumer Specialties                                         -4%               5%               3%                   0%                 4%
  Industrial Specialties                                       -9%              13%               8%                  -3%                 9%
  Acetyl Intermediates                                         10%              13%               6%                   0%                29%
  Total Company                                                 4%              11%               6%                  -1%                20%

Factors Affecting Six Months 2008 Segment Net Sales Compared to Six Months 2007
                                                                                                                           1
                                                                                                                  Other
(in percent)                                                Volume              Price        Currency                                    Total
  Advanced Engineered Materials                                 7%               -1%              8%                   0%                14%
  Consumer Specialties                                         -7%                4%              3%                   4%                 4%
  Industrial Specialties                                      -10%              12%               7%                  -2%                 7%
  Acetyl Intermediates                                          9%              15%               6%                   0%                30%
  Total Company                                                 2%              11%               7%                  -1%                19%
1
    Primarily represents net sales from APL (Acetate), divestiture of AT Plastics Films business and captive insurance companies (Total Company).


Table 3
Cash Flow Information
                                                                                                                                       Six Months Ended
                                                                                                                                           June 30,
(in $ millions)                                                                                                                         2008         2007
                                                        1
Net cash provided by operating activities                                                                                                   346          79
                                                    2
Net cash provided by (used in) investing activities                                                                                         (33)        295
Net cash used in financing activities                                                                                                      (183)       (706)
Exchange rate effects on cash                                                                                                                28          11
                                                                                                                                            825
Cash and cash equivalents at beginning of period                                                                                                        791
                                                                                                                                            983         470
Cash and cash equivalents at end of period

                                                                                                                                            613         470
Cash and cash equivalents at end of period, net of Ticona Kelsterbach plant relocation activities
1
    2008 includes $59 million of value-added taxes related to Ticona Kelsterbach plant relocation
2
    2008 includes $311 million of deferred proceeds related to Ticona Kelsterbach plant relocation


Table 4
Cash Dividends Received
                                                                                                                        Three Months Ended          Six Months Ended
                                                                                                                             June 30,                    June 30,
(in $ millions)                                                                                                          2008        2007            2008       2007
                                                                                                                             12                          55
Dividends from equity investments                                                                                                       10                         40
Dividends from cost investments                                                                                              75         49              103        64
Total                                                                                                                        87         59              158       104


Table 5
Net Debt - Reconciliation of a Non-U.S. GAAP Measure
                                                                                                     June 30,        December 31,
(in $ millions)                                                                                        2008              2007
Short-term borrowings and current
                                                                                                            252
   installments of long-term debt - third party and affiliates                                                                   272
Long-term debt                                                                                            3,371                3,284
                                                                                                          3,623                3,556
Total debt
                                                                                                            983
Less: Cash and cash equivalents                                                                                                  825
Net Debt                                                                                                  2,640                2,731
Page 10 of 12


Table 6


Adjusted Earnings (Loss) Per Share - Reconciliation of a Non-U.S. GAAP Measure


                                                                                                     Three Months Ended                 Six Months Ended
                                                                                                          June 30,                          June 30,
                                                                                                      2008         2007                 2008         2007
(in $ millions, except per share data)
Earnings (loss) from continuing operations
  before tax and minority interests                                                                         247                            465
                                                                                                                                (168)                       3
Non-GAAP Adjustments:
                                        1
  Other charges and other adjustments                                                                         24                            46
                                                                                                                                117                    135
                                                                                                                                256                    254
                                                                                                               -                             -
  Refinancing costs
Adjusted Earnings (loss) from continuing operations
  before tax and minority interests                                                                         271                            511
                                                                                                                                205                     392
                                                    2
Income tax (provision) benefit on adjusted earnings                                                         (70)                          (133)
                                                                                                                                (57)                   (110)
                                                                                                                                   -
                                                                                                              1                              1
Minority interests                                                                                                                                        0
Adjusted Earnings (loss) from continuing operations                                                         202                 148        379          282
                                                                                                             (2)                            (5)
Preferred dividends                                                                                                              (3)                     (5)
Adjusted net earnings (loss) available to common shareholders                                               200                 145        374          277
                                                                                                              2                              5
Add back: Preferred dividends                                                                                                     3                       5
Adjusted net earnings (loss) for adjusted EPS                                                               202                 148        379          282


Diluted shares (millions)
                                                                                                          150.9                          151.4
Weighted average shares outstanding                                                                                         156.9                     158.1
                                                                                                                                                       12.0
                                                                                                                                          12.1
                                                                                                           12.1
Assumed conversion of Preferred Shares                                                                                       12.0
                                                                                                                                                        0.2
                                                                                                                                           0.6
                                                                                                            0.8
Assumed conversion of Restricted Stock                                                                                        0.5
                                                                                                                              5.2                       4.2
                                                                                                                                           3.4
                                                                                                            4.1
Assumed conversion of stock options
                                                                                                          167.8                          167.6
Total diluted shares                                                                                                        174.6                     174.5
Adjusted EPS                                                                                        $      1.20       $      0.85         2.26         1.62
1
    See Table 7 for details
2
    The adjusted tax rate for the three months ended June 30, 2008 is 26% based on the forecasted adjusted tax rate for 2008.
Page 11 of 12


Table 7

Reconciliation of Other Charges and Other Adjustments


Other Charges:
                                                                                  Three Months Ended       Six Months Ended
                                                                                       June 30,                June 30,
(in $ millions)                                                                   2008          2007       2008         2007
                                                                                        4                        11
Employee termination benefits                                                                         25                     25
                                                                                                                              -
                                                                                                                  7
                                                                                        -
Plant/office closures                                                                                  -
                                                                                                                             74
                                                                                                                   -
                                                                                        -
Long-term compensation triggered by Exit Event                                                        74
                                                                                                                              3
                                                                                                                   -
                                                                                        -
Asset impairments                                                                                      3
                                                                                        3                         5
Ticona Kelsterbach plant relocation                                                                    3                      3
                                                                                                       -           -
                                                                                        -
Other                                                                                                                         1
   Total                                                                                7            105         23        106


Other Adjustments: 1
                                                                                  Three Months Ended       Six Months Ended                      Income
                                                                                        June 30,               June 30,                         Statement
                                                                                                                                             Classification
(in $ millions)                                                                   2008           2007      2008         2007
                                                                                        (2)                      (2)
Ethylene pipeline exit costs                                                                           -                     10   Other income/expense, net
                                                                                         9                      18
Business optimization                                                                                  3                      5   SG&A
                                                                                          -                        -
Foreign exchange loss related to refinancing transaction                                               9                      9   Other income/expense, net
                                                                                        (2)                      (4)
Ticona Kelsterbach plant relocation                                                                    -                      -   Cost of Sales
                                                                                         7                        7
Plant closures                                                                                         -                      -   Cost of Sales
                                                                                         5                        4
Other                                                                                                  -                      5   Various
                                                                                       17             12        23           29
   Total

                                                                                      24            117         46         135
Total other charges and other adjustments
1
    These items are included in net earnings but not included in other charges.
Page 12 of 12
Table 8

Equity Affiliate Preliminary Results - Total - Unaudited
                                                                       Three Months Ended                                        Six Months Ended
(in $ millions)                                                                June 30,                                                   June 30,
                                                                    2008                        2007                         2008                    2007
Net Sales
    Ticona Affiliates1                                                         364                        312                          719                    619
    Infraserv2                                                                 592                        411                        1,140                    753
    Total                                                                      956                        723                        1,859                  1,372

Operating Profit
    Ticona Affiliates                                                           41                          49                             74                  93
    Infraserv                                                                   29                          25                             48                  42
    Total                                                                       70                          74                            122                 135

Depreciation and Amortization
    Ticona Affiliates                                                           16                          13                            38                      27
    Infraserv                                                                   29                          21                            56                      40
                                                                                45                          34                            94                      67
    Total

Affiliate EBITDA3
    Ticona Affiliates                                                           57                         62                             112                 120
    Infraserv                                                                   58                         46                             104                  82
    Total                                                                      115                        108                             216                 202

Net Income
    Ticona Affiliates                                                           22                          30                             41                  60
    Infraserv                                                                   27                          27                             65                  40
    Total                                                                       49                          57                            106                 100

Net Debt
    Ticona Affiliates                                                          179                        164                             179                 164
    Infraserv                                                                  356                         47                             356                  47
    Total                                                                      535                        211                             535                 211


Equity Affiliate Preliminary Results - Celanese Proportional Share - Unaudited4
                                                                       Three Months Ended                                        Six Months Ended
(in $ millions)                                                             June 30,                                                 June 30,
                                                                    2008                        2007                         2008                    2007
Net Sales
    Ticona Affiliates                                                          167                        145                             330                 287
    Infraserv                                                                  158                        133                             334                 253
                                                                               325                        278                             664                 540
    Total

Operating Profit
    Ticona Affiliates                                                           19                          24                            34                      45
    Infraserv                                                                    8                           9                            14                      14
                                                                                27                          33                            48                      59
    Total

Depreciation and Amortization
    Ticona Affiliates                                                             7                          6                            17                      12
    Infraserv                                                                    8                           7                            17                      14
    Total                                                                       15                          13                            34                      26

Affiliate EBITDA3
    Ticona Affiliates                                                           26                          30                            51                      57
    Infraserv                                                                   16                          16                            31                      27
                                                                                42                          46                            82                      84
    Total

Equity in net earnings of affiliates                  (as reported on the Income Statement)
                                                                                10                                                        19
    Ticona Affiliates                                                                                       15                                                    29
    Infraserv                                                                    7                           8                             8                      12
    Total                                                                       17                          23                            27                      41

Affiliate EBITDA in excess of Equity in net earnings of affiliates5
    Ticona Affiliates                                                           16                          15                            32                      28
    Infraserv                                                                    9                           8                            23                      15
    Total                                                                       25                          23                            55                      43

Net Debt
    Ticona Affiliates                                                           83                          75                             83                     75
                                                                                87                                                         87
    Infraserv                                                                                               17                                                    17
    Total                                                                      170                          92                            170                     92

1
Ticona Affiliates includes PolyPlastics (45% ownership), Korean Engineering Plastics (50%) and Fortron Industries(50%)
2
Infraserv includes Infraserv Entities valued as equity investments (Infraserv Höchst Group - 31% ownership, Infraserv Gendorf - 39% and Infraserv Knapsack 27%)
3
Affiliate EBITDA is the sum of Operating Profit and Depreciation and Amortization, a non-U.S. GAAP measure
4
Calculated as the product of figures from the above table times Celanese ownership percentage
5
Product of Celanese proportion of Affiliate EBITDA less Equity in net earnings of affiliates; not included in Celanese operating EBITDA

Weitere ähnliche Inhalte

Was ist angesagt?

Raytheon Reports 2007 Fourth Quarter Results
	Raytheon Reports 2007 Fourth Quarter Results	Raytheon Reports 2007 Fourth Quarter Results
Raytheon Reports 2007 Fourth Quarter Resultsfinance12
 
celanese q2_2006_pm_e
celanese q2_2006_pm_ecelanese q2_2006_pm_e
celanese q2_2006_pm_efinance44
 
AES 2Q 08 Review
AES 2Q 08 ReviewAES 2Q 08 Review
AES 2Q 08 Reviewfinance19
 
Raytheon Reports 2008 First Quarter Results
	Raytheon Reports 2008 First Quarter Results	Raytheon Reports 2008 First Quarter Results
Raytheon Reports 2008 First Quarter Resultsfinance12
 
Annual report 2008
Annual report 2008Annual report 2008
Annual report 2008canon99in
 
fpl group library.corporate-library. corporate-
 fpl group  library.corporate-library. corporate- fpl group  library.corporate-library. corporate-
fpl group library.corporate-library. corporate-finance17
 
2007/02/06/01f
2007/02/06/01f2007/02/06/01f
2007/02/06/01ffinance21
 
celanese q2_2007_earnings_pres
celanese q2_2007_earnings_prescelanese q2_2007_earnings_pres
celanese q2_2007_earnings_presfinance44
 
Raytheon Reports 2008 Second Quarter Results
Raytheon Reports 2008 Second Quarter ResultsRaytheon Reports 2008 Second Quarter Results
Raytheon Reports 2008 Second Quarter Resultsfinance12
 
Hexion CSFBConferenceMarch2008Final
Hexion CSFBConferenceMarch2008FinalHexion CSFBConferenceMarch2008Final
Hexion CSFBConferenceMarch2008Finalfinance36
 
celanese q2_2006_presentation
celanese q2_2006_presentationcelanese q2_2006_presentation
celanese q2_2006_presentationfinance44
 
AES 1Q 08 Review
AES 1Q 08 ReviewAES 1Q 08 Review
AES 1Q 08 Reviewfinance19
 
Primero 2011 Q4 and Year End Results
Primero 2011 Q4 and Year End ResultsPrimero 2011 Q4 and Year End Results
Primero 2011 Q4 and Year End Resultsprimero_mining
 
occidental petroleum Supplementals
occidental petroleum Supplementalsoccidental petroleum Supplementals
occidental petroleum Supplementalsfinance13
 

Was ist angesagt? (15)

Raytheon Reports 2007 Fourth Quarter Results
	Raytheon Reports 2007 Fourth Quarter Results	Raytheon Reports 2007 Fourth Quarter Results
Raytheon Reports 2007 Fourth Quarter Results
 
celanese q2_2006_pm_e
celanese q2_2006_pm_ecelanese q2_2006_pm_e
celanese q2_2006_pm_e
 
AES 2Q 08 Review
AES 2Q 08 ReviewAES 2Q 08 Review
AES 2Q 08 Review
 
Raytheon Reports 2008 First Quarter Results
	Raytheon Reports 2008 First Quarter Results	Raytheon Reports 2008 First Quarter Results
Raytheon Reports 2008 First Quarter Results
 
Annual report 2008
Annual report 2008Annual report 2008
Annual report 2008
 
fpl group library.corporate-library. corporate-
 fpl group  library.corporate-library. corporate- fpl group  library.corporate-library. corporate-
fpl group library.corporate-library. corporate-
 
2007/02/06/01f
2007/02/06/01f2007/02/06/01f
2007/02/06/01f
 
celanese q2_2007_earnings_pres
celanese q2_2007_earnings_prescelanese q2_2007_earnings_pres
celanese q2_2007_earnings_pres
 
Raytheon Reports 2008 Second Quarter Results
Raytheon Reports 2008 Second Quarter ResultsRaytheon Reports 2008 Second Quarter Results
Raytheon Reports 2008 Second Quarter Results
 
Hexion CSFBConferenceMarch2008Final
Hexion CSFBConferenceMarch2008FinalHexion CSFBConferenceMarch2008Final
Hexion CSFBConferenceMarch2008Final
 
celanese q2_2006_presentation
celanese q2_2006_presentationcelanese q2_2006_presentation
celanese q2_2006_presentation
 
AES 1Q 08 Review
AES 1Q 08 ReviewAES 1Q 08 Review
AES 1Q 08 Review
 
Shell Q1 2008 Qra
Shell Q1 2008 QraShell Q1 2008 Qra
Shell Q1 2008 Qra
 
Primero 2011 Q4 and Year End Results
Primero 2011 Q4 and Year End ResultsPrimero 2011 Q4 and Year End Results
Primero 2011 Q4 and Year End Results
 
occidental petroleum Supplementals
occidental petroleum Supplementalsoccidental petroleum Supplementals
occidental petroleum Supplementals
 

Ähnlich wie q208earningsrelease_july_21_2008

q308earningsrelease_final_oct_21_2008-5
q308earningsrelease_final_oct_21_2008-5q308earningsrelease_final_oct_21_2008-5
q308earningsrelease_final_oct_21_2008-5finance44
 
q208earningsrelease_july_21_2008-3
q208earningsrelease_july_21_2008-3q208earningsrelease_july_21_2008-3
q208earningsrelease_july_21_2008-3finance44
 
celanese q208earning srelease_july_21_2008-3
celanese q208earning srelease_july_21_2008-3celanese q208earning srelease_july_21_2008-3
celanese q208earning srelease_july_21_2008-3finance44
 
q4_2008_report_e
q4_2008_report_eq4_2008_report_e
q4_2008_report_efinance44
 
celanese mr_q1_2005_e
celanese mr_q1_2005_ecelanese mr_q1_2005_e
celanese mr_q1_2005_efinance44
 
celanese q208earning srelease_july_21_2008
celanese q208earning srelease_july_21_2008celanese q208earning srelease_july_21_2008
celanese q208earning srelease_july_21_2008finance44
 
danaher 08_1Q_Release
danaher 08_1Q_Releasedanaher 08_1Q_Release
danaher 08_1Q_Releasefinance24
 
raytheon Q4 Earnings Presentation
raytheon Q4 Earnings Presentationraytheon Q4 Earnings Presentation
raytheon Q4 Earnings Presentationfinance12
 
celanese q4_2006_e
celanese q4_2006_ecelanese q4_2006_e
celanese q4_2006_efinance44
 
monsanto 10-10-07
monsanto 10-10-07monsanto 10-10-07
monsanto 10-10-07finance28
 
.monsanto 10-10-07
.monsanto 10-10-07.monsanto 10-10-07
.monsanto 10-10-07finance28
 
Monsanto Q4 2007 Financial Results
Monsanto Q4 2007 Financial ResultsMonsanto Q4 2007 Financial Results
Monsanto Q4 2007 Financial Resultsearningsreport
 
spectra energy Release050608
spectra energy Release050608spectra energy Release050608
spectra energy Release050608finance49
 
raytheon Q4 Earnings Presentation
raytheon Q4 Earnings Presentationraytheon Q4 Earnings Presentation
raytheon Q4 Earnings Presentationfinance12
 
aetna Download Documentation Earnings Release and Tables2007 1st
aetna Download Documentation	Earnings Release and Tables2007 1staetna Download Documentation	Earnings Release and Tables2007 1st
aetna Download Documentation Earnings Release and Tables2007 1stfinance9
 
raytheon Q4 Earnings Presentation
raytheon Q4 Earnings Presentationraytheon Q4 Earnings Presentation
raytheon Q4 Earnings Presentationfinance12
 

Ähnlich wie q208earningsrelease_july_21_2008 (20)

q308earningsrelease_final_oct_21_2008-5
q308earningsrelease_final_oct_21_2008-5q308earningsrelease_final_oct_21_2008-5
q308earningsrelease_final_oct_21_2008-5
 
q208earningsrelease_july_21_2008-3
q208earningsrelease_july_21_2008-3q208earningsrelease_july_21_2008-3
q208earningsrelease_july_21_2008-3
 
celanese q208earning srelease_july_21_2008-3
celanese q208earning srelease_july_21_2008-3celanese q208earning srelease_july_21_2008-3
celanese q208earning srelease_july_21_2008-3
 
q4_2008_report_e
q4_2008_report_eq4_2008_report_e
q4_2008_report_e
 
celanese mr_q1_2005_e
celanese mr_q1_2005_ecelanese mr_q1_2005_e
celanese mr_q1_2005_e
 
celanese q208earning srelease_july_21_2008
celanese q208earning srelease_july_21_2008celanese q208earning srelease_july_21_2008
celanese q208earning srelease_july_21_2008
 
danaher 08_1Q_Release
danaher 08_1Q_Releasedanaher 08_1Q_Release
danaher 08_1Q_Release
 
raytheon Q4 Earnings Presentation
raytheon Q4 Earnings Presentationraytheon Q4 Earnings Presentation
raytheon Q4 Earnings Presentation
 
celanese q4_2006_e
celanese q4_2006_ecelanese q4_2006_e
celanese q4_2006_e
 
monsanto 10-10-07
monsanto 10-10-07monsanto 10-10-07
monsanto 10-10-07
 
.monsanto 10-10-07
.monsanto 10-10-07.monsanto 10-10-07
.monsanto 10-10-07
 
Monsanto Q4 2007 Financial Results
Monsanto Q4 2007 Financial ResultsMonsanto Q4 2007 Financial Results
Monsanto Q4 2007 Financial Results
 
spectra energy Release050608
spectra energy Release050608spectra energy Release050608
spectra energy Release050608
 
raytheon Q4 Earnings Presentation
raytheon Q4 Earnings Presentationraytheon Q4 Earnings Presentation
raytheon Q4 Earnings Presentation
 
aetna Download Documentation Earnings Release and Tables2007 1st
aetna Download Documentation	Earnings Release and Tables2007 1staetna Download Documentation	Earnings Release and Tables2007 1st
aetna Download Documentation Earnings Release and Tables2007 1st
 
raytheon Q4 Earnings Presentation
raytheon Q4 Earnings Presentationraytheon Q4 Earnings Presentation
raytheon Q4 Earnings Presentation
 
Shell Q2 2008 Qra
Shell Q2 2008 QraShell Q2 2008 Qra
Shell Q2 2008 Qra
 
AES 4Q 08ER
AES 4Q 08ERAES 4Q 08ER
AES 4Q 08ER
 
AES 4Q 08ER
AES 4Q 08ERAES 4Q 08ER
AES 4Q 08ER
 
AES 4Q 08ER
AES 4Q 08ERAES 4Q 08ER
AES 4Q 08ER
 

Mehr von finance44

oshkosh Q106_Presentation
oshkosh   Q106_Presentationoshkosh   Q106_Presentation
oshkosh Q106_Presentationfinance44
 
oshkosh Q206_Earnings_Presentation
oshkosh   Q206_Earnings_Presentationoshkosh   Q206_Earnings_Presentation
oshkosh Q206_Earnings_Presentationfinance44
 
oshkosh Q306_Presentation
oshkosh   Q306_Presentationoshkosh   Q306_Presentation
oshkosh Q306_Presentationfinance44
 
oshkosh Q107_Slides
oshkosh   Q107_Slidesoshkosh   Q107_Slides
oshkosh Q107_Slidesfinance44
 
oshkosh Q207_Slides
oshkosh   Q207_Slidesoshkosh   Q207_Slides
oshkosh Q207_Slidesfinance44
 
oshkosh Q32007slides
oshkosh   Q32007slidesoshkosh   Q32007slides
oshkosh Q32007slidesfinance44
 
oshkosh Q407_Earnings
oshkosh   Q407_Earningsoshkosh   Q407_Earnings
oshkosh Q407_Earningsfinance44
 
oshkosh Q108_earnings_slides
oshkosh   Q108_earnings_slidesoshkosh   Q108_earnings_slides
oshkosh Q108_earnings_slidesfinance44
 
oshkosh Q208_Slides
oshkosh   Q208_Slidesoshkosh   Q208_Slides
oshkosh Q208_Slidesfinance44
 
oshkosh Q308_Slides
oshkosh   Q308_Slidesoshkosh   Q308_Slides
oshkosh Q308_Slidesfinance44
 
OSK_Q4_2008_Earnings_Release_Slides
OSK_Q4_2008_Earnings_Release_SlidesOSK_Q4_2008_Earnings_Release_Slides
OSK_Q4_2008_Earnings_Release_Slidesfinance44
 
oshkosh Goldman_110508
oshkosh   Goldman_110508oshkosh   Goldman_110508
oshkosh Goldman_110508finance44
 
oshkosh Baird_111208
oshkosh   Baird_111208oshkosh   Baird_111208
oshkosh Baird_111208finance44
 
oshkosh B9FAB733-F810-4AE7-A95B-4388C6B08318_Cowen_020509
oshkosh   B9FAB733-F810-4AE7-A95B-4388C6B08318_Cowen_020509oshkosh   B9FAB733-F810-4AE7-A95B-4388C6B08318_Cowen_020509
oshkosh B9FAB733-F810-4AE7-A95B-4388C6B08318_Cowen_020509finance44
 
oshkosh Q108_earnings_slides
oshkosh   Q108_earnings_slidesoshkosh   Q108_earnings_slides
oshkosh Q108_earnings_slidesfinance44
 
oshkosh Q208_Slides
oshkosh   Q208_Slidesoshkosh   Q208_Slides
oshkosh Q208_Slidesfinance44
 
oshkosh Q308_Slides
oshkosh   Q308_Slidesoshkosh   Q308_Slides
oshkosh Q308_Slidesfinance44
 
oshkosh OSK_Q4_2008_Earnings_Release_Slides
oshkosh   OSK_Q4_2008_Earnings_Release_Slidesoshkosh   OSK_Q4_2008_Earnings_Release_Slides
oshkosh OSK_Q4_2008_Earnings_Release_Slidesfinance44
 

Mehr von finance44 (20)

oshkosh Q106_Presentation
oshkosh   Q106_Presentationoshkosh   Q106_Presentation
oshkosh Q106_Presentation
 
oshkosh Q206_Earnings_Presentation
oshkosh   Q206_Earnings_Presentationoshkosh   Q206_Earnings_Presentation
oshkosh Q206_Earnings_Presentation
 
oshkosh Q306_Presentation
oshkosh   Q306_Presentationoshkosh   Q306_Presentation
oshkosh Q306_Presentation
 
OSK_101606
OSK_101606OSK_101606
OSK_101606
 
Oshkosh
OshkoshOshkosh
Oshkosh
 
oshkosh Q107_Slides
oshkosh   Q107_Slidesoshkosh   Q107_Slides
oshkosh Q107_Slides
 
oshkosh Q207_Slides
oshkosh   Q207_Slidesoshkosh   Q207_Slides
oshkosh Q207_Slides
 
oshkosh Q32007slides
oshkosh   Q32007slidesoshkosh   Q32007slides
oshkosh Q32007slides
 
oshkosh Q407_Earnings
oshkosh   Q407_Earningsoshkosh   Q407_Earnings
oshkosh Q407_Earnings
 
oshkosh Q108_earnings_slides
oshkosh   Q108_earnings_slidesoshkosh   Q108_earnings_slides
oshkosh Q108_earnings_slides
 
oshkosh Q208_Slides
oshkosh   Q208_Slidesoshkosh   Q208_Slides
oshkosh Q208_Slides
 
oshkosh Q308_Slides
oshkosh   Q308_Slidesoshkosh   Q308_Slides
oshkosh Q308_Slides
 
OSK_Q4_2008_Earnings_Release_Slides
OSK_Q4_2008_Earnings_Release_SlidesOSK_Q4_2008_Earnings_Release_Slides
OSK_Q4_2008_Earnings_Release_Slides
 
oshkosh Goldman_110508
oshkosh   Goldman_110508oshkosh   Goldman_110508
oshkosh Goldman_110508
 
oshkosh Baird_111208
oshkosh   Baird_111208oshkosh   Baird_111208
oshkosh Baird_111208
 
oshkosh B9FAB733-F810-4AE7-A95B-4388C6B08318_Cowen_020509
oshkosh   B9FAB733-F810-4AE7-A95B-4388C6B08318_Cowen_020509oshkosh   B9FAB733-F810-4AE7-A95B-4388C6B08318_Cowen_020509
oshkosh B9FAB733-F810-4AE7-A95B-4388C6B08318_Cowen_020509
 
oshkosh Q108_earnings_slides
oshkosh   Q108_earnings_slidesoshkosh   Q108_earnings_slides
oshkosh Q108_earnings_slides
 
oshkosh Q208_Slides
oshkosh   Q208_Slidesoshkosh   Q208_Slides
oshkosh Q208_Slides
 
oshkosh Q308_Slides
oshkosh   Q308_Slidesoshkosh   Q308_Slides
oshkosh Q308_Slides
 
oshkosh OSK_Q4_2008_Earnings_Release_Slides
oshkosh   OSK_Q4_2008_Earnings_Release_Slidesoshkosh   OSK_Q4_2008_Earnings_Release_Slides
oshkosh OSK_Q4_2008_Earnings_Release_Slides
 

Kürzlich hochgeladen

VIP Independent Call Girls in Andheri 🌹 9920725232 ( Call Me ) Mumbai Escorts...
VIP Independent Call Girls in Andheri 🌹 9920725232 ( Call Me ) Mumbai Escorts...VIP Independent Call Girls in Andheri 🌹 9920725232 ( Call Me ) Mumbai Escorts...
VIP Independent Call Girls in Andheri 🌹 9920725232 ( Call Me ) Mumbai Escorts...dipikadinghjn ( Why You Choose Us? ) Escorts
 
Mira Road Memorable Call Grls Number-9833754194-Bhayandar Speciallty Call Gir...
Mira Road Memorable Call Grls Number-9833754194-Bhayandar Speciallty Call Gir...Mira Road Memorable Call Grls Number-9833754194-Bhayandar Speciallty Call Gir...
Mira Road Memorable Call Grls Number-9833754194-Bhayandar Speciallty Call Gir...priyasharma62062
 
WhatsApp 📞 Call : 9892124323 ✅Call Girls In Chembur ( Mumbai ) secure service
WhatsApp 📞 Call : 9892124323  ✅Call Girls In Chembur ( Mumbai ) secure serviceWhatsApp 📞 Call : 9892124323  ✅Call Girls In Chembur ( Mumbai ) secure service
WhatsApp 📞 Call : 9892124323 ✅Call Girls In Chembur ( Mumbai ) secure servicePooja Nehwal
 
Vasai-Virar Fantastic Call Girls-9833754194-Call Girls MUmbai
Vasai-Virar Fantastic Call Girls-9833754194-Call Girls MUmbaiVasai-Virar Fantastic Call Girls-9833754194-Call Girls MUmbai
Vasai-Virar Fantastic Call Girls-9833754194-Call Girls MUmbaipriyasharma62062
 
Booking open Available Pune Call Girls Shivane 6297143586 Call Hot Indian Gi...
Booking open Available Pune Call Girls Shivane  6297143586 Call Hot Indian Gi...Booking open Available Pune Call Girls Shivane  6297143586 Call Hot Indian Gi...
Booking open Available Pune Call Girls Shivane 6297143586 Call Hot Indian Gi...Call Girls in Nagpur High Profile
 
VIP Independent Call Girls in Taloja 🌹 9920725232 ( Call Me ) Mumbai Escorts ...
VIP Independent Call Girls in Taloja 🌹 9920725232 ( Call Me ) Mumbai Escorts ...VIP Independent Call Girls in Taloja 🌹 9920725232 ( Call Me ) Mumbai Escorts ...
VIP Independent Call Girls in Taloja 🌹 9920725232 ( Call Me ) Mumbai Escorts ...dipikadinghjn ( Why You Choose Us? ) Escorts
 
Enjoy Night⚡Call Girls Patel Nagar Delhi >༒8448380779 Escort Service
Enjoy Night⚡Call Girls Patel Nagar Delhi >༒8448380779 Escort ServiceEnjoy Night⚡Call Girls Patel Nagar Delhi >༒8448380779 Escort Service
Enjoy Night⚡Call Girls Patel Nagar Delhi >༒8448380779 Escort ServiceDelhi Call girls
 
Booking open Available Pune Call Girls Wadgaon Sheri 6297143586 Call Hot Ind...
Booking open Available Pune Call Girls Wadgaon Sheri  6297143586 Call Hot Ind...Booking open Available Pune Call Girls Wadgaon Sheri  6297143586 Call Hot Ind...
Booking open Available Pune Call Girls Wadgaon Sheri 6297143586 Call Hot Ind...Call Girls in Nagpur High Profile
 
Business Principles, Tools, and Techniques in Participating in Various Types...
Business Principles, Tools, and Techniques  in Participating in Various Types...Business Principles, Tools, and Techniques  in Participating in Various Types...
Business Principles, Tools, and Techniques in Participating in Various Types...jeffreytingson
 
VIP Independent Call Girls in Mira Bhayandar 🌹 9920725232 ( Call Me ) Mumbai ...
VIP Independent Call Girls in Mira Bhayandar 🌹 9920725232 ( Call Me ) Mumbai ...VIP Independent Call Girls in Mira Bhayandar 🌹 9920725232 ( Call Me ) Mumbai ...
VIP Independent Call Girls in Mira Bhayandar 🌹 9920725232 ( Call Me ) Mumbai ...dipikadinghjn ( Why You Choose Us? ) Escorts
 
Top Rated Pune Call Girls Aundh ⟟ 6297143586 ⟟ Call Me For Genuine Sex Servi...
Top Rated  Pune Call Girls Aundh ⟟ 6297143586 ⟟ Call Me For Genuine Sex Servi...Top Rated  Pune Call Girls Aundh ⟟ 6297143586 ⟟ Call Me For Genuine Sex Servi...
Top Rated Pune Call Girls Aundh ⟟ 6297143586 ⟟ Call Me For Genuine Sex Servi...Call Girls in Nagpur High Profile
 
Indore Real Estate Market Trends Report.pdf
Indore Real Estate Market Trends Report.pdfIndore Real Estate Market Trends Report.pdf
Indore Real Estate Market Trends Report.pdfSaviRakhecha1
 
Diva-Thane European Call Girls Number-9833754194-Diva Busty Professional Call...
Diva-Thane European Call Girls Number-9833754194-Diva Busty Professional Call...Diva-Thane European Call Girls Number-9833754194-Diva Busty Professional Call...
Diva-Thane European Call Girls Number-9833754194-Diva Busty Professional Call...priyasharma62062
 
Gurley shaw Theory of Monetary Economics.
Gurley shaw Theory of Monetary Economics.Gurley shaw Theory of Monetary Economics.
Gurley shaw Theory of Monetary Economics.Vinodha Devi
 
Stock Market Brief Deck (Under Pressure).pdf
Stock Market Brief Deck (Under Pressure).pdfStock Market Brief Deck (Under Pressure).pdf
Stock Market Brief Deck (Under Pressure).pdfMichael Silva
 
Top Rated Pune Call Girls Sinhagad Road ⟟ 6297143586 ⟟ Call Me For Genuine S...
Top Rated  Pune Call Girls Sinhagad Road ⟟ 6297143586 ⟟ Call Me For Genuine S...Top Rated  Pune Call Girls Sinhagad Road ⟟ 6297143586 ⟟ Call Me For Genuine S...
Top Rated Pune Call Girls Sinhagad Road ⟟ 6297143586 ⟟ Call Me For Genuine S...Call Girls in Nagpur High Profile
 
Solution Manual for Principles of Corporate Finance 14th Edition by Richard B...
Solution Manual for Principles of Corporate Finance 14th Edition by Richard B...Solution Manual for Principles of Corporate Finance 14th Edition by Richard B...
Solution Manual for Principles of Corporate Finance 14th Edition by Richard B...ssifa0344
 
8377087607, Door Step Call Girls In Kalkaji (Locanto) 24/7 Available
8377087607, Door Step Call Girls In Kalkaji (Locanto) 24/7 Available8377087607, Door Step Call Girls In Kalkaji (Locanto) 24/7 Available
8377087607, Door Step Call Girls In Kalkaji (Locanto) 24/7 Availabledollysharma2066
 

Kürzlich hochgeladen (20)

VIP Independent Call Girls in Andheri 🌹 9920725232 ( Call Me ) Mumbai Escorts...
VIP Independent Call Girls in Andheri 🌹 9920725232 ( Call Me ) Mumbai Escorts...VIP Independent Call Girls in Andheri 🌹 9920725232 ( Call Me ) Mumbai Escorts...
VIP Independent Call Girls in Andheri 🌹 9920725232 ( Call Me ) Mumbai Escorts...
 
Mira Road Memorable Call Grls Number-9833754194-Bhayandar Speciallty Call Gir...
Mira Road Memorable Call Grls Number-9833754194-Bhayandar Speciallty Call Gir...Mira Road Memorable Call Grls Number-9833754194-Bhayandar Speciallty Call Gir...
Mira Road Memorable Call Grls Number-9833754194-Bhayandar Speciallty Call Gir...
 
WhatsApp 📞 Call : 9892124323 ✅Call Girls In Chembur ( Mumbai ) secure service
WhatsApp 📞 Call : 9892124323  ✅Call Girls In Chembur ( Mumbai ) secure serviceWhatsApp 📞 Call : 9892124323  ✅Call Girls In Chembur ( Mumbai ) secure service
WhatsApp 📞 Call : 9892124323 ✅Call Girls In Chembur ( Mumbai ) secure service
 
Vasai-Virar Fantastic Call Girls-9833754194-Call Girls MUmbai
Vasai-Virar Fantastic Call Girls-9833754194-Call Girls MUmbaiVasai-Virar Fantastic Call Girls-9833754194-Call Girls MUmbai
Vasai-Virar Fantastic Call Girls-9833754194-Call Girls MUmbai
 
Booking open Available Pune Call Girls Shivane 6297143586 Call Hot Indian Gi...
Booking open Available Pune Call Girls Shivane  6297143586 Call Hot Indian Gi...Booking open Available Pune Call Girls Shivane  6297143586 Call Hot Indian Gi...
Booking open Available Pune Call Girls Shivane 6297143586 Call Hot Indian Gi...
 
VIP Independent Call Girls in Taloja 🌹 9920725232 ( Call Me ) Mumbai Escorts ...
VIP Independent Call Girls in Taloja 🌹 9920725232 ( Call Me ) Mumbai Escorts ...VIP Independent Call Girls in Taloja 🌹 9920725232 ( Call Me ) Mumbai Escorts ...
VIP Independent Call Girls in Taloja 🌹 9920725232 ( Call Me ) Mumbai Escorts ...
 
Enjoy Night⚡Call Girls Patel Nagar Delhi >༒8448380779 Escort Service
Enjoy Night⚡Call Girls Patel Nagar Delhi >༒8448380779 Escort ServiceEnjoy Night⚡Call Girls Patel Nagar Delhi >༒8448380779 Escort Service
Enjoy Night⚡Call Girls Patel Nagar Delhi >༒8448380779 Escort Service
 
Booking open Available Pune Call Girls Wadgaon Sheri 6297143586 Call Hot Ind...
Booking open Available Pune Call Girls Wadgaon Sheri  6297143586 Call Hot Ind...Booking open Available Pune Call Girls Wadgaon Sheri  6297143586 Call Hot Ind...
Booking open Available Pune Call Girls Wadgaon Sheri 6297143586 Call Hot Ind...
 
Business Principles, Tools, and Techniques in Participating in Various Types...
Business Principles, Tools, and Techniques  in Participating in Various Types...Business Principles, Tools, and Techniques  in Participating in Various Types...
Business Principles, Tools, and Techniques in Participating in Various Types...
 
(INDIRA) Call Girl Srinagar Call Now 8617697112 Srinagar Escorts 24x7
(INDIRA) Call Girl Srinagar Call Now 8617697112 Srinagar Escorts 24x7(INDIRA) Call Girl Srinagar Call Now 8617697112 Srinagar Escorts 24x7
(INDIRA) Call Girl Srinagar Call Now 8617697112 Srinagar Escorts 24x7
 
VIP Independent Call Girls in Mira Bhayandar 🌹 9920725232 ( Call Me ) Mumbai ...
VIP Independent Call Girls in Mira Bhayandar 🌹 9920725232 ( Call Me ) Mumbai ...VIP Independent Call Girls in Mira Bhayandar 🌹 9920725232 ( Call Me ) Mumbai ...
VIP Independent Call Girls in Mira Bhayandar 🌹 9920725232 ( Call Me ) Mumbai ...
 
Top Rated Pune Call Girls Aundh ⟟ 6297143586 ⟟ Call Me For Genuine Sex Servi...
Top Rated  Pune Call Girls Aundh ⟟ 6297143586 ⟟ Call Me For Genuine Sex Servi...Top Rated  Pune Call Girls Aundh ⟟ 6297143586 ⟟ Call Me For Genuine Sex Servi...
Top Rated Pune Call Girls Aundh ⟟ 6297143586 ⟟ Call Me For Genuine Sex Servi...
 
Indore Real Estate Market Trends Report.pdf
Indore Real Estate Market Trends Report.pdfIndore Real Estate Market Trends Report.pdf
Indore Real Estate Market Trends Report.pdf
 
Diva-Thane European Call Girls Number-9833754194-Diva Busty Professional Call...
Diva-Thane European Call Girls Number-9833754194-Diva Busty Professional Call...Diva-Thane European Call Girls Number-9833754194-Diva Busty Professional Call...
Diva-Thane European Call Girls Number-9833754194-Diva Busty Professional Call...
 
Gurley shaw Theory of Monetary Economics.
Gurley shaw Theory of Monetary Economics.Gurley shaw Theory of Monetary Economics.
Gurley shaw Theory of Monetary Economics.
 
Stock Market Brief Deck (Under Pressure).pdf
Stock Market Brief Deck (Under Pressure).pdfStock Market Brief Deck (Under Pressure).pdf
Stock Market Brief Deck (Under Pressure).pdf
 
(Vedika) Low Rate Call Girls in Pune Call Now 8250077686 Pune Escorts 24x7
(Vedika) Low Rate Call Girls in Pune Call Now 8250077686 Pune Escorts 24x7(Vedika) Low Rate Call Girls in Pune Call Now 8250077686 Pune Escorts 24x7
(Vedika) Low Rate Call Girls in Pune Call Now 8250077686 Pune Escorts 24x7
 
Top Rated Pune Call Girls Sinhagad Road ⟟ 6297143586 ⟟ Call Me For Genuine S...
Top Rated  Pune Call Girls Sinhagad Road ⟟ 6297143586 ⟟ Call Me For Genuine S...Top Rated  Pune Call Girls Sinhagad Road ⟟ 6297143586 ⟟ Call Me For Genuine S...
Top Rated Pune Call Girls Sinhagad Road ⟟ 6297143586 ⟟ Call Me For Genuine S...
 
Solution Manual for Principles of Corporate Finance 14th Edition by Richard B...
Solution Manual for Principles of Corporate Finance 14th Edition by Richard B...Solution Manual for Principles of Corporate Finance 14th Edition by Richard B...
Solution Manual for Principles of Corporate Finance 14th Edition by Richard B...
 
8377087607, Door Step Call Girls In Kalkaji (Locanto) 24/7 Available
8377087607, Door Step Call Girls In Kalkaji (Locanto) 24/7 Available8377087607, Door Step Call Girls In Kalkaji (Locanto) 24/7 Available
8377087607, Door Step Call Girls In Kalkaji (Locanto) 24/7 Available
 

q208earningsrelease_july_21_2008

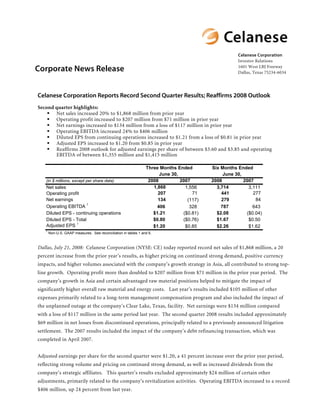
  • 1. Celanese Corporation Investor Relations Corporate News Release 1601 West LBJ Freeway Dallas, Texas 75234-6034 Celanese Corporation Reports Record Second Quarter Results; Reaffirms 2008 Outlook Second quarter highlights: Net sales increased 20% to $1,868 million from prior year Operating profit increased to $207 million from $71 million in prior year Net earnings increased to $134 million from a loss of $117 million in prior year Operating EBITDA increased 24% to $406 million Diluted EPS from continuing operations increased to $1.21 from a loss of $0.81 in prior year Adjusted EPS increased to $1.20 from $0.85 in prior year Reaffirms 2008 outlook for adjusted earnings per share of between $3.60 and $3.85 and operating EBITDA of between $1,355 million and $1,415 million Three Months Ended Six Months Ended June 30, June 30, 2008 2007 2008 2007 (in $ millions, except per share data) 1,868 3,714 Net sales 1,556 3,111 71 277 207 441 Operating profit Net earnings 84 134 279 (117) 1 Operating EBITDA 406 787 328 643 $1.21 $2.08 Diluted EPS - continuing operations ($0.81) ($0.04) $0.80 $1.67 Diluted EPS - Total ($0.76) $0.50 1 Adjusted EPS $1.20 $2.26 $0.85 $1.62 1 Non-U.S. GAAP measures. See reconciliation in tables 1 and 6. Dallas, July 21, 2008: Celanese Corporation (NYSE: CE) today reported record net sales of $1,868 million, a 20 percent increase from the prior year’s results, as higher pricing on continued strong demand, positive currency impacts, and higher volumes associated with the company’s growth strategy in Asia, all contributed to strong top- line growth. Operating profit more than doubled to $207 million from $71 million in the prior year period. The company’s growth in Asia and certain advantaged raw material positions helped to mitigate the impact of significantly higher overall raw material and energy costs. Last year’s results included $105 million of other expenses primarily related to a long-term management compensation program and also included the impact of the unplanned outage at the company’s Clear Lake, Texas, facility. Net earnings were $134 million compared with a loss of $117 million in the same period last year. The second quarter 2008 results included approximately $69 million in net losses from discontinued operations, principally related to a previously announced litigation settlement. The 2007 results included the impact of the company’s debt refinancing transaction, which was completed in April 2007. Adjusted earnings per share for the second quarter were $1.20, a 41 percent increase over the prior year period, reflecting strong volume and pricing on continued strong demand, as well as increased dividends from the company’s strategic affiliates. This quarter’s results excluded approximately $24 million of certain other adjustments, primarily related to the company’s revitalization activities. Operating EBITDA increased to a record $406 million, up 24 percent from last year.
  • 2. Page 2 of 12 “We delivered record second quarter earnings despite challenging global economic conditions and significant inflation in raw material and energy pricing,” said David Weidman, chairman and chief executive officer. “Once again, our results demonstrate the strength and earnings power of Celanese’s attractive portfolio of businesses.” Recent Highlights Successfully started up its newly constructed 20,000 ton GUR® ultra-high molecular weight polyethylene (UHMW-PE) facility, 100,000 ton acetic anhydride facility, and 300,000 ton vinyl acetate monomer facility, all located at the company’s integrated chemical complex in Nanjing, China. Signed an agreement to establish a 20,000 square-meter commercial and technology center in Shanghai. Expected to be completed in early 2010, the new center will combine the headquarters for Celanese’s Asia businesses, customer application development and research and development facilities. Celanese’s Nutrinova business and BRAIN AG, a leading European biotech company, identified all- natural compounds for high intensity sweeteners and sweetness enhancers. Introduced EcoVAE™, a new vinyl acetate/ethylene (VAE) emulsion technology specially designed to facilitate the manufacture of high quality, eco-friendly paints for North America. Resolved a legacy litigation matter by entering into a settlement agreement relating to sales by the polyester staple fibers business, which Hoechst AG sold to KoSa, Inc. in 1998. Announced intent to divest ownership interest in legacy Infraserv investments located in Knapsack, Gendorf, and Wiesbaden, Germany, where Celanese no longer has manufacturing operations. Second Quarter Segment Overview Advanced Engineered Materials Advanced Engineered Materials continued to execute its growth strategy, as global expansion offset the impacts of ongoing challenges in the U.S. automotive sector and initial signs of weakness in the European sector. Net sales increased to $300 million from $257 million in the same period last year, primarily on positive currency impacts, as well as higher volumes, particularly in Asia. Operating profit increased to $37 million from $32 million in the prior year period, as increased volumes and lower overall expense more than offset significantly higher raw material and energy costs, including ethylene and other petroleum-based feedstocks. Operating EBITDA, however, was $68 million compared with $70 million in the same period last year, mainly due to lower earnings from equity affiliates. Consumer Specialties Consumer Specialties continued to contribute stable earnings, driven by its expansion in Asia and successful integration of its acquired Acetate Products Limited (APL) business. Net sales increased to $292 million compared with $281 million in the same period last year, driven by higher pricing on continued strong demand and positive currency impacts. Higher acetate tow volumes helped to offset lower acetate flake volumes resulting from the company’s strategic decision to shift flake production to its expanded acetate China ventures, and slightly lower volumes for Sunett®, the company’s high-intensity food sweetener business. Operating profit was $46 million, $2 million lower than last year’s results, as the higher pricing could not fully offset significantly higher raw material and energy costs in the period. Operating EBITDA increased to $107 million from $104 million in the same period last year, however, on higher dividends from the company’s China ventures.
  • 3. Page 3 of 12 Industrial Specialties Continued revitalization of the Industrial Specialties businesses delivered improved results, despite continued softness in certain markets and significantly higher raw material costs. Net sales increased to $386 million from $355 million in the same period last year, primarily driven by higher pricing related to increased raw material costs, as well as favorable currency impacts. Increased volumes related to the company’s strategic expansion in Asia were offset by volume declines in North American and southern European painting and coating applications. Operating profit increased to $20 million, compared with a loss of $1 million in the prior year period, as higher pricing more than offset higher raw material costs and the lower volumes. The 2007 results included approximately $19 million of expense related to the company’s revitalization activities. Operating EBITDA was $37 million compared with $34 million in the second quarter of 2007. Acetyl Intermediates Strategic expansions in Asia, attractive industry fundamentals, and advantaged raw material positions drove significant sales and earnings growth in Acetyl Intermediates. Net sales were $1,067 million compared with $829 million in the same period last year, driven by higher pricing on continued strong demand, increased volumes from its Nanjing acetic acid unit, and positive currency impacts. Operating profit increased to $148 million from $91 million and operating EBITDA increased to $227 million from $148 million in the same period last year, as the volume and pricing more than offset higher raw material and energy costs in the period. Increased dividends from the company’s Ibn Sina methanol and MTBE cost affiliate also contributed to the improved results. The prior year’s operating results included a partial impact of the unplanned outage at the company’s Clear Lake, Texas, facility. Taxes The tax rate for adjusted earnings per share was 26 percent in the second quarter of 2008 compared with 28 percent in the second quarter of 2007. The U.S. GAAP effective tax rate for continuing operations for the second quarter of 2008 was 18 percent compared with 26 percent in the same period last year. The decrease in the U.S. GAAP effective tax rate for the period ended June 30, 2008 was primarily due to the U.S. income tax effect resulting from the maturity of cross currency swap arrangements in June 2008. The tax rate for adjusted earnings per share is based upon the company’s previous guidance which did not include these items. Cash taxes for the first six months of 2008 were $45 million, $96 million lower than the prior year period. Equity and Cost Investments Earnings from equity investments and dividends from cost investments, which are reflected in the company’s adjusted earnings and operating EBITDA, totaled $92 million in the second quarter versus $72 million in the same period last year. Higher dividends from the company’s acetate China ventures and Ibn Sina cost affiliate offset lower earnings from the Advanced Engineered Materials equity affiliates. Equity and cost investment dividends, which are included in cash flows, were $87 million compared with $59 million in the prior year period.
  • 4. Page 4 of 12 Cash Flow The company generated $346 million in cash from operating activities during the first six months of 2008 compared with $79 million generated during the same period last year, driven by strong operating performance and lower cash taxes. The 2008 results included a $107 million payment related to the resolution of a legacy litigation matter and an increased use of cash in trade working capital. The 2007 results included a $74 million cash payment related to a long-term management compensation program. Cash used in investing activities was $33 million at the end of the second quarter and included a $93 million payment to settle a cross currency swap that matured in June 2008. During the first half of 2008, the company repurchased approximately $126 million of its outstanding common shares and has approximately $274 million in authorized purchases remaining. Net debt at the end of the second quarter was $2,640 million, a decrease of $91 million from the fourth quarter of 2007. Cash and cash equivalents at the end of the second quarter were $983 million compared with $825 million at the end of 2007. During the quarter, the company received a scheduled progress payment of $311 million related to the relocation of Ticona’s Kelsterbach production facility, reflected in investing activities; and $59 million in associated value added tax, reflected in operating activities. Outlook The company reaffirmed its full year outlook for adjusted earnings per share to between $3.60 and $3.85 based on the strength of its performance in the first half of 2008 and continued execution of its earnings growth strategy. On a comparable basis, 2007 results were $3.29 per share. The guidance is based on an adjusted tax rate of 26 percent and an estimated year-end weighted average of 166 million diluted shares outstanding. The company also reaffirmed its operating EBITDA guidance range of between $1,355 million and $1,415 million. “The rapid escalation of raw material and energy prices, along with concerns of slowing economic growth in the U.S. and parts of Europe have created challenges in the short-term,” said Weidman. “With our geographic and end market diversity, advantaged feedstock positions, and an integrated business model, we believe that Celanese is well-positioned to mitigate the potential impact of today’s environment.” Contacts: Investor Relations Media – U.S. Media - Europe Mark Oberle Gretchen Rosswurm Jens Kurth Phone: +1 972 443 4464 Phone: +1 972 443 4847 Phone: +49 69 305 7137 Telefax: +1 972 443 8519 Telefax: +1 972 443 8519 Telefax: +49 69 305 36787 Mark.Oberle@celanese.com Gretchen.Rosswurm@celanese.com J.Kurth@celanese.com As a global leader in the chemicals industry, Celanese Corporation makes products essential to everyday living. Our products, found in consumer and industrial applications, are manufactured in North America, Europe and Asia. Net sales totaled $6.4 billion in 2007, with approximately 70% generated outside of North America. Known for operational excellence and execution of its business strategies, Celanese delivers value to customers around the globe with innovations and best-in-class technologies. Based in Dallas, Texas, the company employs approximately 8,400 employees worldwide. For more information on Celanese Corporation, please visit the company's website at www.celanese.com.
  • 5. Page 5 of 12 Forward-Looking Statements This release may contain “forward-looking statements,” which include information concerning the company’s plans, objectives, goals, strategies, future revenues or performance, capital expenditures, financing needs and other information that is not historical information. When used in this release, the words “outlook,” “forecast,” “estimates,” “expects,” “anticipates,” “projects,” “plans,” “intends,” “believes,” and variations of such words or similar expressions are intended to identify forward-looking statements. All forward-looking statements are based upon current expectations and beliefs and various assumptions. There can be no assurance that the company will realize these expectations or that these beliefs will prove correct. There are a number of risks and uncertainties that could cause actual results to differ materially from the forward-looking statements contained in this release. Numerous factors, many of which are beyond the company’s control, could cause actual results to differ materially from those expressed as forward-looking statements. Certain of these risk factors are discussed in the company’s filings with the Securities and Exchange Commission. Any forward-looking statement speaks only as of the date on which it is made, and the company undertakes no obligation to update any forward-looking statements to reflect events or circumstances after the date on which it is made or to reflect the occurrence of anticipated or unanticipated events or circumstances. Reconciliation of Non-U.S. GAAP Measures to U.S. GAAP This release reflects five performance measures, operating EBITDA, affiliate EBITDA, adjusted earnings per share, net debt and adjusted free cash flow, as non-U.S. GAAP measures. The most directly comparable financial measure presented in accordance with U.S. GAAP in our consolidated financial statements for operating EBITDA is operating profit; for affiliate EBITDA is equity in net earnings of affiliates; for adjusted earnings per share is earnings per common share-diluted; for net debt is total debt; and for adjusted free cash flow is cash flow from operations. Use of Non-U.S. GAAP Financial Information Operating EBITDA, a measure used by management to measure performance, is defined as operating profit from continuing operations, plus equity in net earnings from affiliates, other income and depreciation and amortization, and further adjusted for other charges and adjustments. We provide guidance on operating EBITDA and are unable to reconcile forecasted operating EBITDA to a GAAP financial measure because a forecast of Other Charges and Adjustments is not practical. Our management believes operating EBITDA is useful to investors because it is one of the primary measures our management uses for its planning and budgeting processes and to monitor and evaluate financial and operating results. Operating EBITDA is not a recognized term under U.S. GAAP and does not purport to be an alternative to operating profit as a measure of operating performance or to cash flows from operating activities as a measure of liquidity. Because not all companies use identical calculations, this presentation of operating EBITDA may not be comparable to other similarly titled measures of other companies. Additionally, operating EBITDA is not intended to be a measure of free cash flow for management’s discretionary use, as it does not consider certain cash requirements such as interest payments, tax payments and debt service requirements nor does it represent the amount used in our debt covenants. Affiliate EBITDA, a measure used by management to measure performance of its equity investments, is defined as the proportional operating profit plus the proportional depreciation and amortization of its equity investments. Affiliate EBITDA, including Celanese Proportional Share of affiliate information on Table 8, is not a recognized term under U.S. GAAP and is not meant to be an alternative to operating cash flow of the equity investments. The company has determined that it does not have sufficient ownership for operating control of these investments to consider their results on a consolidated basis. The company believes that investors should consider affiliate EBITDA when determining the equity investments’ overall value in the company. Adjusted earnings per share is a measure used by management to measure performance. It is defined as net earnings (loss) available to common shareholders plus preferred dividends, adjusted for other charges and adjustments, and divided by the number of basic common shares, diluted preferred shares, and options valued using the treasury method. We provide guidance on an adjusted earnings per share basis and are unable to reconcile forecasted adjusted earnings per share to a GAAP financial measure without unreasonable effort because a forecast of Other Items is not practical. We believe that the presentation of this non-U.S. GAAP measure provides useful information to management and investors regarding various financial and business trends relating to our financial condition and results of operations, and that when U.S. GAAP information is viewed in conjunction with non-U.S. GAAP information, investors are provided with a more meaningful understanding of our ongoing operating performance. This non-U.S. GAAP information is not intended to be considered in isolation or as a substitute for U.S. GAAP financial information. The tax rate used for adjusted earnings per share is the tax rate based on our initial guidance, less changes in uncertain tax positions. We adjust this tax rate during the year only if there is a substantial change in our underlying operations; an updated forecast would not necessarily result in a change to our tax rate used for adjusted earnings per share. The adjusted tax rate may differ significantly from the tax rate used for U.S. GAAP reporting in any given reporting period. It is not practical to reconcile our prospective adjusted tax rate to the actual U.S. GAAP tax rate in any future period. Net debt is defined as total debt less cash and cash equivalents. We believe that the presentation of this non-U.S. GAAP measure provides useful information to management and investors regarding changes to the company’s capital structure. Our management and credit analysts use net debt to evaluate the company's capital structure and assess credit quality. This non-U.S. GAAP information is not intended to be considered in isolation or as a substitute for U.S. GAAP financial information. Adjusted free cash flow is defined as cash flow from operations less capital expenditures, other productive asset purchases, operating cash from discontinued operations and certain other charges and adjustments. We believe that the presentation of this non-U.S. GAAP measure provides useful information to management and investors regarding changes to the company’s cash flow. Our management and credit analysts use adjusted free cash flow to evaluate the company’s liquidity and assess credit quality. This non- U.S. GAAP information is not intended to be considered in isolation or as a substitute for U.S. GAAP financial information. Results Unaudited The results presented in this release, together with the adjustments made to present the results on a comparable basis, have not been audited and are based on internal financial data furnished to management. Quarterly results should not be taken as an indication of the results of operations to be reported for any subsequent period or for the full fiscal year.
  • 6. Page 6 of 12 Preliminary Consolidated Statements of Operations- Unaudited Three Months Ended Six Months Ended June 30, June 30, (in $ millions, except per share data) 2008 2007 2008 2007 Net sales 1,868 3,714 1,556 3,111 (1,472) (2,900) Cost of sales (1,219) (2,415) Gross profit 396 337 814 696 (138) (274) Selling, general and administrative expenses (122) (238) 1 Amortization of Intangibles (20) (39) (17) (35) (18) (41) Research and development expenses (19) (36) (7) (23) Other (charges) gains, net (105) (106) (3) 4 Foreign exchange gain (loss), net - - (3) - Gain (loss) on disposition of assets, net (3) (4) Operating profit 207 71 441 277 17 27 Equity in net earnings of affiliates 23 41 (63) (130) Interest expense (61) (133) - - Refinancing expenses (256) (256) 10 19 Interest income 11 25 75 103 Dividend income - cost investments 49 64 1 5 Other income (expense), net (5) (15) Earnings (loss) from continuing operations before tax and minority interests 247 (168) 465 3 (45) (118) Income tax (provision) benefit 44 (5) Earnings (loss) from continuing operations before minority interests 202 (124) 347 (2) 1 1 Minority interests - - Earnings (loss) from continuing operations 203 (124) 348 (2) Earnings (loss) from discontinued operations: (112) (112) Earnings ( loss) from operation of discontinued operations (5) 38 16 47 - - Gain on disposal of discontinued operations (4) 1 43 43 Income tax benefit 7 (69) 86 Earnings (loss) from discontinued operations (69) Net earnings (loss) 134 (117) 279 84 (2) (5) Cumulative preferred stock dividends (3) (5) Net earnings (loss) available to common shareholders 132 (120) 274 79 Earnings (loss) per common share - basic: $1.33 $2.26 Continuing operations ($0.81) ($0.04) (0.46) (0.45) Discontinued operations 0.05 0.54 Net earnings (loss) available to common shareholders $0.87 ($0.76) $1.81 $0.50 Earnings (loss) per common share - diluted: $1.21 $2.08 Continuing operations ($0.81) ($0.04) (0.41) (0.41) Discontinued operations 0.05 0.54 Net earnings (loss) available to common shareholders $0.80 ($0.76) $1.67 $0.50 Weighted average shares - basic 150.9 151.4 156.9 158.1 Weighted average shares - diluted 167.8 167.6 156.9 158.1 1 Customer related intangibles
  • 7. Page 7 of 12 Preliminary Consolidated Balance Sheets - Unaudited June 30, December 31, 2008 2007 (in $ millions) ASSETS Current assets: 983 Cash and cash equivalents 825 Receivables: 1,061 Trade - third party and affiliates, net 1,009 381 Other 437 754 Inventories 636 68 Deferred income taxes 70 24 Marketable securities, at fair value 46 30 Other assets 40 Total current assets 3,301 3,063 803 Investments 814 2,542 Property, plant and equipment, net 2,362 50 Deferred income taxes 10 208 Marketable securities, at fair value 209 376 Other assets 309 897 Goodwill 866 437 Intangible assets, net 425 Total assets 8,614 8,058 LIABILITIES AND SHAREHOLDERS' EQUITY Current liabilities: Short-term borrowings and current 252 installments of long-term debt - third party and affiliates 272 829 Trade payables - third parties and affiliates 818 824 Other liabilities 888 30 Deferred income taxes 30 38 Income taxes payable 23 Total current liabilities 1,973 2,031 3,371 Long-term debt 3,284 277 Deferred income taxes 265 259 Income taxes payable 220 676 Benefit obligations 696 822 Other liabilities 495 4 Minority interests 5 Shareholders' equity: - - Preferred stock - - Common stock (403) (529) Treasury stock, at cost 494 Additional paid-in capital 469 1,061 Retained earnings 799 206 Accumulated other comprehensive income (loss), net 197 1,232 1,062 Total shareholders' equity Total liabilities and shareholders' equity 8,614 8,058
  • 8. Page 8 of 12 Table 1 Segment Data and Reconciliation of Operating Profit (Loss) to Operating EBITDA - a Non-U.S. GAAP Measure Three Months Ended Six Months Ended June 30, June 30, (in $ millions) 2008 2007 2008 2007 Net Sales 300 594 Advanced Engineered Materials 257 519 292 574 Consumer Specialties 281 550 386 751 Industrial Specialties 355 701 Acetyl Intermediates 1,067 829 2,163 1,668 1 Other Activities 1 1 - 1 Intersegment eliminations (178) (166) (369) (328) Total 1,868 1,556 3,714 3,111 Operating Profit (Loss) Advanced Engineered Materials 37 32 67 68 46 96 Consumer Specialties 48 96 Industrial Specialties 20 (1) 37 11 148 325 Acetyl Intermediates 91 223 1 Other Activities (44) (84) (99) (121) Total 207 71 441 277 Equity Earnings, Cost - Dividend Income and Other Income Expense 11 20 Advanced Engineered Materials 16 30 Consumer Specialties 48 35 48 35 - - Industrial Specialties - - Acetyl Intermediates 33 18 62 23 1 Other Activities 1 (2) 5 2 Total 93 67 135 90 Other Charges and Other Adjustments 2 Advanced Engineered Materials 1 5 2 5 - 1 Consumer Specialties 8 9 Industrial Specialties 3 19 8 19 12 20 Acetyl Intermediates 13 26 1 Other Activities 8 15 72 76 Total 24 117 46 135 Depreciation and Amortization Expense 19 39 Advanced Engineered Materials 17 34 Consumer Specialties 13 13 27 24 14 28 Industrial Specialties 16 30 Acetyl Intermediates 34 26 66 50 1 Other Activities 1 3 5 2 Total 82 73 165 141 Operating EBITDA 68 128 Advanced Engineered Materials 70 137 107 172 Consumer Specialties 104 164 37 73 Industrial Specialties 34 60 227 473 Acetyl Intermediates 148 322 1 Other Activities (33) (59) (28) (40) Total 406 328 787 643 1 Other Activities primarily includes corporate selling, general and administrative expenses and the results from captive insurance companies 2 Excludes adjustments to minority interest, net interest, taxes, depreciation, amortization and discontinued operations (See Table 7).
  • 9. Page 9 of 12 Table 2 Factors Affecting Second Quarter 2008 Segment Net Sales Compared to Second Quarter 2007 Other 1 Volume Price Currency Total (in percent) Advanced Engineered Materials 8% 0% 9% 0% 17% Consumer Specialties -4% 5% 3% 0% 4% Industrial Specialties -9% 13% 8% -3% 9% Acetyl Intermediates 10% 13% 6% 0% 29% Total Company 4% 11% 6% -1% 20% Factors Affecting Six Months 2008 Segment Net Sales Compared to Six Months 2007 1 Other (in percent) Volume Price Currency Total Advanced Engineered Materials 7% -1% 8% 0% 14% Consumer Specialties -7% 4% 3% 4% 4% Industrial Specialties -10% 12% 7% -2% 7% Acetyl Intermediates 9% 15% 6% 0% 30% Total Company 2% 11% 7% -1% 19% 1 Primarily represents net sales from APL (Acetate), divestiture of AT Plastics Films business and captive insurance companies (Total Company). Table 3 Cash Flow Information Six Months Ended June 30, (in $ millions) 2008 2007 1 Net cash provided by operating activities 346 79 2 Net cash provided by (used in) investing activities (33) 295 Net cash used in financing activities (183) (706) Exchange rate effects on cash 28 11 825 Cash and cash equivalents at beginning of period 791 983 470 Cash and cash equivalents at end of period 613 470 Cash and cash equivalents at end of period, net of Ticona Kelsterbach plant relocation activities 1 2008 includes $59 million of value-added taxes related to Ticona Kelsterbach plant relocation 2 2008 includes $311 million of deferred proceeds related to Ticona Kelsterbach plant relocation Table 4 Cash Dividends Received Three Months Ended Six Months Ended June 30, June 30, (in $ millions) 2008 2007 2008 2007 12 55 Dividends from equity investments 10 40 Dividends from cost investments 75 49 103 64 Total 87 59 158 104 Table 5 Net Debt - Reconciliation of a Non-U.S. GAAP Measure June 30, December 31, (in $ millions) 2008 2007 Short-term borrowings and current 252 installments of long-term debt - third party and affiliates 272 Long-term debt 3,371 3,284 3,623 3,556 Total debt 983 Less: Cash and cash equivalents 825 Net Debt 2,640 2,731
  • 10. Page 10 of 12 Table 6 Adjusted Earnings (Loss) Per Share - Reconciliation of a Non-U.S. GAAP Measure Three Months Ended Six Months Ended June 30, June 30, 2008 2007 2008 2007 (in $ millions, except per share data) Earnings (loss) from continuing operations before tax and minority interests 247 465 (168) 3 Non-GAAP Adjustments: 1 Other charges and other adjustments 24 46 117 135 256 254 - - Refinancing costs Adjusted Earnings (loss) from continuing operations before tax and minority interests 271 511 205 392 2 Income tax (provision) benefit on adjusted earnings (70) (133) (57) (110) - 1 1 Minority interests 0 Adjusted Earnings (loss) from continuing operations 202 148 379 282 (2) (5) Preferred dividends (3) (5) Adjusted net earnings (loss) available to common shareholders 200 145 374 277 2 5 Add back: Preferred dividends 3 5 Adjusted net earnings (loss) for adjusted EPS 202 148 379 282 Diluted shares (millions) 150.9 151.4 Weighted average shares outstanding 156.9 158.1 12.0 12.1 12.1 Assumed conversion of Preferred Shares 12.0 0.2 0.6 0.8 Assumed conversion of Restricted Stock 0.5 5.2 4.2 3.4 4.1 Assumed conversion of stock options 167.8 167.6 Total diluted shares 174.6 174.5 Adjusted EPS $ 1.20 $ 0.85 2.26 1.62 1 See Table 7 for details 2 The adjusted tax rate for the three months ended June 30, 2008 is 26% based on the forecasted adjusted tax rate for 2008.
  • 11. Page 11 of 12 Table 7 Reconciliation of Other Charges and Other Adjustments Other Charges: Three Months Ended Six Months Ended June 30, June 30, (in $ millions) 2008 2007 2008 2007 4 11 Employee termination benefits 25 25 - 7 - Plant/office closures - 74 - - Long-term compensation triggered by Exit Event 74 3 - - Asset impairments 3 3 5 Ticona Kelsterbach plant relocation 3 3 - - - Other 1 Total 7 105 23 106 Other Adjustments: 1 Three Months Ended Six Months Ended Income June 30, June 30, Statement Classification (in $ millions) 2008 2007 2008 2007 (2) (2) Ethylene pipeline exit costs - 10 Other income/expense, net 9 18 Business optimization 3 5 SG&A - - Foreign exchange loss related to refinancing transaction 9 9 Other income/expense, net (2) (4) Ticona Kelsterbach plant relocation - - Cost of Sales 7 7 Plant closures - - Cost of Sales 5 4 Other - 5 Various 17 12 23 29 Total 24 117 46 135 Total other charges and other adjustments 1 These items are included in net earnings but not included in other charges.
  • 12. Page 12 of 12 Table 8 Equity Affiliate Preliminary Results - Total - Unaudited Three Months Ended Six Months Ended (in $ millions) June 30, June 30, 2008 2007 2008 2007 Net Sales Ticona Affiliates1 364 312 719 619 Infraserv2 592 411 1,140 753 Total 956 723 1,859 1,372 Operating Profit Ticona Affiliates 41 49 74 93 Infraserv 29 25 48 42 Total 70 74 122 135 Depreciation and Amortization Ticona Affiliates 16 13 38 27 Infraserv 29 21 56 40 45 34 94 67 Total Affiliate EBITDA3 Ticona Affiliates 57 62 112 120 Infraserv 58 46 104 82 Total 115 108 216 202 Net Income Ticona Affiliates 22 30 41 60 Infraserv 27 27 65 40 Total 49 57 106 100 Net Debt Ticona Affiliates 179 164 179 164 Infraserv 356 47 356 47 Total 535 211 535 211 Equity Affiliate Preliminary Results - Celanese Proportional Share - Unaudited4 Three Months Ended Six Months Ended (in $ millions) June 30, June 30, 2008 2007 2008 2007 Net Sales Ticona Affiliates 167 145 330 287 Infraserv 158 133 334 253 325 278 664 540 Total Operating Profit Ticona Affiliates 19 24 34 45 Infraserv 8 9 14 14 27 33 48 59 Total Depreciation and Amortization Ticona Affiliates 7 6 17 12 Infraserv 8 7 17 14 Total 15 13 34 26 Affiliate EBITDA3 Ticona Affiliates 26 30 51 57 Infraserv 16 16 31 27 42 46 82 84 Total Equity in net earnings of affiliates (as reported on the Income Statement) 10 19 Ticona Affiliates 15 29 Infraserv 7 8 8 12 Total 17 23 27 41 Affiliate EBITDA in excess of Equity in net earnings of affiliates5 Ticona Affiliates 16 15 32 28 Infraserv 9 8 23 15 Total 25 23 55 43 Net Debt Ticona Affiliates 83 75 83 75 87 87 Infraserv 17 17 Total 170 92 170 92 1 Ticona Affiliates includes PolyPlastics (45% ownership), Korean Engineering Plastics (50%) and Fortron Industries(50%) 2 Infraserv includes Infraserv Entities valued as equity investments (Infraserv Höchst Group - 31% ownership, Infraserv Gendorf - 39% and Infraserv Knapsack 27%) 3 Affiliate EBITDA is the sum of Operating Profit and Depreciation and Amortization, a non-U.S. GAAP measure 4 Calculated as the product of figures from the above table times Celanese ownership percentage 5 Product of Celanese proportion of Affiliate EBITDA less Equity in net earnings of affiliates; not included in Celanese operating EBITDA