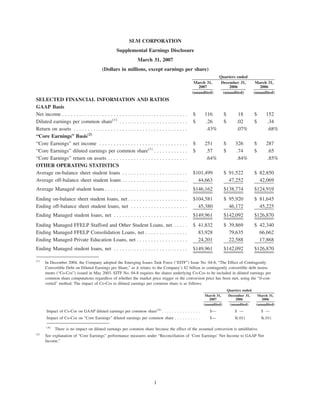
SlideShare ist ein Scribd-Unternehmen logo
1 von 9
Downloaden Sie, um offline zu lesen
SLM CORPORATION
                                                    Supplemental Earnings Disclosure
                                                                 March 31, 2007
                                          (Dollars in millions, except earnings per share)
                                                                                                                    Quarters ended
                                                                                                      March 31,      December 31,              March 31,
                                                                                                        2007             2006                    2006
                                                                                                     (unaudited)      (unaudited)             (unaudited)
SELECTED FINANCIAL INFORMATION AND RATIOS
GAAP Basis
Net income . . . . . . . . . . . . . . . . . . . . . . . . . . . . . . . . . . . . . . . . . . . .   $     116           $         18         $     152
Diluted earnings per common share(1) . . . . . . . . . . . . . . . . . . . . . . . .                 $     .26           $        .02         $     .34
Return on assets . . . . . . . . . . . . . . . . . . . . . . . . . . . . . . . . . . . . . . . .           .43%                   .07%              .68%
“Core Earnings” Basis(2)
“Core Earnings” net income . . . . . . . . . . . . . . . . . . . . . . . . . . . . . . .             $     251           $       326          $     287
“Core Earnings” diluted earnings per common share(1) . . . . . . . . . . . .                         $     .57           $       .74          $     .65
“Core Earnings” return on assets . . . . . . . . . . . . . . . . . . . . . . . . . . . .                   .64%                  .84%               .85%
OTHER OPERATING STATISTICS
Average on-balance sheet student loans . . . . . . . . . . . . . . . . . . . . . . .                 $101,499            $ 91,522             $ 82,850
Average off-balance sheet student loans . . . . . . . . . . . . . . . . . . . . . . .                  44,663              47,252               42,069
Average Managed student loans . . . . . . . . . . . . . . . . . . . . . . . . . . . . .              $146,162            $138,774             $124,919
Ending on-balance sheet student loans, net . . . . . . . . . . . . . . . . . . . . .                 $104,581            $ 95,920             $ 81,645
Ending off-balance sheet student loans, net . . . . . . . . . . . . . . . . . . . .                    45,380              46,172               45,225
Ending Managed student loans, net . . . . . . . . . . . . . . . . . . . . . . . . . .                $149,961            $142,092             $126,870
Ending Managed FFELP Stafford and Other Student Loans, net . . . . .                                 $ 41,832            $ 39,869             $ 42,340
Ending Managed FFELP Consolidation Loans, net . . . . . . . . . . . . . . .                            83,928              79,635               66,662
Ending Managed Private Education Loans, net . . . . . . . . . . . . . . . . . .                        24,201              22,588               17,868
Ending Managed student loans, net . . . . . . . . . . . . . . . . . . . . . . . . . .                $149,961            $142,092             $126,870

(1)
      In December 2004, the Company adopted the Emerging Issues Task Force (“EITF”) Issue No. 04-8, “The Effect of Contingently
      Convertible Debt on Diluted Earnings per Share,” as it relates to the Company’s $2 billion in contingently convertible debt instru-
      ments (“Co-Cos”) issued in May 2003. EITF No. 04-8 requires the shares underlying Co-Cos to be included in diluted earnings per
      common share computations regardless of whether the market price trigger or the conversion price has been met, using the “if-con-
      verted” method. The impact of Co-Cos to diluted earnings per common share is as follows:
                                                                                                                             Quarters ended
                                                                                                            March 31,         December 31,      March 31,
                                                                                                              2007                2006            2006
                                                                                                           (unaudited)         (unaudited)     (unaudited)
      Impact of Co-Cos on GAAP diluted earnings per common share(A) . . . . . . . . . . . . . . .             $—                 $—               $—
      Impact of Co-Cos on “Core Earnings” diluted earnings per common share . . . . . . . . . .               $—                 $(.01)           $(.01)

      (A)
            There is no impact on diluted earnings per common share because the effect of the assumed conversion is antidilutive.
(2)
      See explanation of “Core Earnings” performance measures under “Reconciliation of ‘Core Earnings’ Net Income to GAAP Net
      Income.”


                                                                            1
SLM CORPORATION
                                                        Consolidated Balance Sheets
                                               (In thousands, except per share amounts)
                                                                                           March 31,    December 31,     March 31,
                                                                                             2007           2006           2006
                                                                                          (unaudited)                   (unaudited)
Assets
FFELP Stafford and Other Student Loans (net of allowance
  for losses of $10,192; $8,701; and $5,547, respectively) . . . $ 28,561,670                           $ 24,840,464   $18,882,890
FFELP Consolidation Loans (net of allowance for losses of
  $12,087; $11,614; and $9,983 respectively) . . . . . . . . . . . .                    66,170,098        61,324,008    53,450,647
Private Education Loans (net of allowance for losses of
  $369,072; $308,346; and $232,147, respectively) . . . . . . . .                        9,849,481         9,755,289     9,311,164
Other loans (net of allowance for losses of $19,803; $20,394;
  and $15,081, respectively) . . . . . . . . . . . . . . . . . . . . . . . . .           1,350,416         1,308,832     1,114,200
Cash and investments . . . . . . . . . . . . . . . . . . . . . . . . . . . . . .         6,116,168         5,184,673     4,349,669
Restricted cash and investments . . . . . . . . . . . . . . . . . . . . . . .            3,719,020         3,423,326     3,065,148
Retained Interest in off-balance sheet securitized loans . . . . . .                     3,643,322         3,341,591     2,487,117
Goodwill and acquired intangible assets, net. . . . . . . . . . . . . .                  1,364,016         1,371,606     1,091,301
Other assets. . . . . . . . . . . . . . . . . . . . . . . . . . . . . . . . . . . . . .  6,102,275         5,585,943     4,013,450
Total assets . . . . . . . . . . . . . . . . . . . . . . . . . . . . . . . . . . . . . . $126,876,466   $116,135,732   $97,765,586

Liabilities
Short-term borrowings . . . . . . . . . . . . . . . . . . . . . . . . . . . . . . $ 4,428,980           $ 3,528,263    $ 3,362,548
Long-term borrowings . . . . . . . . . . . . . . . . . . . . . . . . . . . . . . 114,070,797             104,558,531    87,083,110
Other liabilities . . . . . . . . . . . . . . . . . . . . . . . . . . . . . . . . . . . 3,990,878          3,679,781     3,555,318
Total liabilities . . . . . . . . . . . . . . . . . . . . . . . . . . . . . . . . . . .   122,490,655    111,766,575    94,000,976
Commitments and contingencies
Minority interest in subsidiaries . . . . . . . . . . . . . . . . . . . . .                     9,029          9,115          9,682
Stockholders’ equity
Preferred stock, par value $.20 per share, 20,000 shares
  authorized; Series A: 3,300; 3,300; and 3,300 shares,
  respectively, issued at stated value of $50 per share;
  Series B: 4,000; 4,000; and 4,000 shares, respectively,
  issued at stated value of $100 per share . . . . . . . . . . . . . . .                      565,000       565,000        565,000
Common stock, par value $.20 per share, 1,125,000 shares
  authorized: 434,587; 433,113; and 429,329 shares,
  respectively, issued . . . . . . . . . . . . . . . . . . . . . . . . . . . . . .             86,918         86,623        85,866
Additional paid-in capital . . . . . . . . . . . . . . . . . . . . . . . . . . .            2,638,334      2,565,211     2,364,252
Accumulated other comprehensive income, net of tax . . . . . . .                              300,884        349,111       328,496
Retained earnings . . . . . . . . . . . . . . . . . . . . . . . . . . . . . . . . .         1,833,359      1,834,718     1,163,570
Stockholders’ equity before treasury stock . . . . . . . . . . . . . . .                    5,424,495      5,400,663     4,507,184
Common stock held in treasury: 22,650; 22,496; and
  16,599 shares, respectively . . . . . . . . . . . . . . . . . . . . . . . . .             1,047,713      1,040,621       752,256
Total stockholders’ equity . . . . . . . . . . . . . . . . . . . . . . . . . . .            4,376,782      4,360,042     3,754,928
Total liabilities and stockholders’ equity . . . . . . . . . . . . . . . . . $126,876,466               $116,135,732   $97,765,586


                                                                            2
SLM CORPORATION
                                                    Consolidated Statements of Income
                                                (In thousands, except per share amounts)
                                                                                                                  Quarters ended
                                                                                                     March 31,     December 31,     March 31,
                                                                                                       2007            2006           2006
                                                                                                    (unaudited)     (unaudited)    (unaudited)
Interest income:
   FFELP Stafford and Other Student Loans .                      . . . . . . . . . . . . . . . . . $ 450,762       $ 408,727       $ 298,500
   FFELP Consolidation Loans . . . . . . . . . . .               .................                  1,014,846        966,840         821,335
   Private Education Loans . . . . . . . . . . . . . .           .................                    338,421        291,425         241,353
   Other loans . . . . . . . . . . . . . . . . . . . . . . .     .................                     27,973         26,556          23,307
   Cash and investments . . . . . . . . . . . . . . . .          .................                    113,904        141,155          95,810
Total interest income . . . . . . . . . . . . . . . . . . . . . . . . . . . . . . . . . . .         1,945,906       1,834,703      1,480,305
Total interest expense . . . . . . . . . . . . . . . . . . . . . . . . . . . . . . . . . .          1,532,090       1,462,733      1,092,784
Net interest income . . . . . . . . . . . . . . . . . . . . . . . . . . . . . . . . . . . .           413,816          371,970         387,521
Less: provisions for losses . . . . . . . . . . . . . . . . . . . . . . . . . . . . . . .             150,330           92,005          60,319
Net interest income after provisions for losses . . . . . . . . . . . . . . . .                       263,486          279,965         327,202
Other income:
  Gains on student loan securitizations . . . . . . . . . . . . . . . . . . . . .                     367,300                —          30,023
  Servicing and securitization revenue . . . . . . . . . . . . . . . . . . . . . .                    251,938           184,686         98,931
  Losses on securities, net . . . . . . . . . . . . . . . . . . . . . . . . . . . . . . .             (30,967)          (24,458)        (2,948)
  Gains (losses) on derivative and hedging activities, net . . . . . . . .                           (356,969)         (244,521)       (86,739)
  Guarantor servicing fees . . . . . . . . . . . . . . . . . . . . . . . . . . . . . . .               39,241            33,089         26,907
  Debt management fees . . . . . . . . . . . . . . . . . . . . . . . . . . . . . . . .                 87,322            92,501         91,612
  Collections revenue . . . . . . . . . . . . . . . . . . . . . . . . . . . . . . . . . .              65,562            57,878         56,681
  Other . . . . . . . . . . . . . . . . . . . . . . . . . . . . . . . . . . . . . . . . . . . . .      96,433           103,927         71,376
Total other income . . . . . . . . . . . . . . . . . . . . . . . . . . . . . . . . . . . . .          519,860          203,102         285,843
Operating expenses . . . . . . . . . . . . . . . . . . . . . . . . . . . . . . . . . . . .            356,174          352,747         323,309
Income before income taxes and minority interest in net earnings
  of subsidiaries . . . . . . . . . . . . . . . . . . . . . . . . . . . . . . . . . . . . . .         427,172          130,320         289,736
Income taxes . . . . . . . . . . . . . . . . . . . . . . . . . . . . . . . . . . . . . . . . .        310,014          111,752         137,045
Income before minority interest in net earnings of subsidiaries . . . .                               117,158           18,568         152,691
Minority interest in net earnings of subsidiaries . . . . . . . . . . . . . . .                         1,005              463           1,090
Net income . . . . . . . . . . . . . . . . . . . . . . . . . . . . . . . . . . . . . . . . . .        116,153           18,105         151,601
Preferred stock dividends . . . . . . . . . . . . . . . . . . . . . . . . . . . . . . . .               9,093            9,258           8,301
Net income attributable to common stock . . . . . . . . . . . . . . . . . . . . $ 107,060                          $      8,847    $ 143,300
Basic earnings per common share . . . . . . . . . . . . . . . . . . . . . . . . $                           .26    $        .02    $       .35
Average common shares outstanding . . . . . . . . . . . . . . . . . . . . . . .                       411,040          409,597         412,675
Diluted earnings per common share . . . . . . . . . . . . . . . . . . . . . . $                             .26    $        .02    $       .34
Average common and common equivalent shares outstanding . . . . .                                     418,449          418,357         422,974
Dividends per common share . . . . . . . . . . . . . . . . . . . . . . . . . . . . . $                      .25    $        .25    $       .22

                                                                              3
SLM CORPORATION
                                                                Segment and “Core Earnings”
                                                       Consolidated Statements of Income
                                                                        (In thousands)
                                                                                             Quarter ended March 31, 2007
                                                                                              Corporate Total “Core                      Total
                                                                     Lending        DMO       and Other    Earnings” Adjustments         GAAP
                                                                                                      (unaudited)
Interest income:
   FFELP Stafford and Other Student
      Loans . . . . . . . . . . . . . . . . . . . . . .     .   .   $ 695,353 $     —          $       —     $ 695,353    $(244,591)   $ 450,762
   FFELP Consolidation Loans . . . . . . . .                .   .    1,331,235      —                  —      1,331,235    (316,389)    1,014,846
   Private Education Loans . . . . . . . . . . .            .   .      657,584      —                  —        657,584    (319,163)      338,421
   Other loans . . . . . . . . . . . . . . . . . . . .      .   .       27,973      —                  —         27,973          —         27,973
   Cash and investments . . . . . . . . . . . . .           .   .      161,677      —               2,135       163,812     (49,908)      113,904
Total interest income . . . . . . . . . . . . . . .         .   .    2,873,822      —               2,135     2,875,957    (930,051)    1,945,906
Total interest expense. . . . . . . . . . . . . . .         .   .    2,220,136   6,687              5,568     2,232,391    (700,301)    1,532,090
Net interest income . . . . . . . . . . . . . . . .         .   .      653,686  (6,687)            (3,433)      643,566    (229,750)      413,816
Less: provisions for losses . . . . . . . . . . .           .   .      197,930      —                 606       198,536     (48,206)      150,330
Net interest income after provisions for
   losses . . . . . . . . . . . . . . . . . . . . . . . .   .   .     455,756     (6,687)       (4,039)        445,030     (181,544)     263,486
Fee income . . . . . . . . . . . . . . . . . . . . . .      .   .          —      87,326        39,241         126,567           (4)     126,563
Collections revenue . . . . . . . . . . . . . . . .         .   .          —      65,322            —           65,322          240       65,562
Other income . . . . . . . . . . . . . . . . . . . .        .   .      44,418         —         51,317          95,735      232,000      327,735
Total other income. . . . . . . . . . . . . . . . .         .   .      44,418    152,648        90,558         287,624      232,236      519,860
Operating expenses(1) . . . . . . . . . . . . . . .         .   .     171,563     93,248        67,505         332,316       23,858      356,174
Income before income taxes and minority
   interest in net earnings of subsidiaries .               ..        328,611       52,713      19,014         400,338      26,834       427,172
Income tax expense(2) . . . . . . . . . . . . . .           ..        121,586       19,504       7,035         148,125     161,889       310,014
Minority interest in net earnings of
   subsidiaries . . . . . . . . . . . . . . . . . . . .     ..             —       1,005            —            1,005           —         1,005
Net income . . . . . . . . . . . . . . . . . . . . . .      ..      $ 207,025   $ 32,204       $11,979       $ 251,208    $(135,055)   $ 116,153

(1)
      Operating expenses for the Lending, DMO, and Corporate and Other business segments include $9 million, $3 million, and $4 mil-
      lion, respectively, of stock option compensation expense.
(2)
      Income taxes are based on a percentage of net income before tax for the individual reportable segment.


                                                                                4
Quarter ended December 31, 2006
                                                                                         Corporate Total “Core                          Total
                                                                    Lending        DMO   and Other    Earnings” Adjustments             GAAP
                                                                                                 (unaudited)
Interest income:
   FFELP Stafford and Other Student
      Loans . . . . . . . . . . . . . . . . . . . . . .     .   . $ 700,961    $       —     $       —     $ 700,961    $ (292,234) $ 408,727
   FFELP Consolidation Loans . . . . . . . .                .   .  1,305,744           —             —      1,305,744      (338,904)   966,840
   Private Education Loans . . . . . . . . . . .            .   .    620,092           —             —        620,092      (328,667)   291,425
   Other loans . . . . . . . . . . . . . . . . . . . .      .   .     26,556           —             —         26,556            —      26,556
   Cash and investments . . . . . . . . . . . . .           .   .    197,161           —          2,225       199,386       (58,231)   141,155
Total interest income . . . . . . . . . . . . . . .         .   .  2,850,514           —          2,225     2,852,739    (1,018,036) 1,834,703
Total interest expense. . . . . . . . . . . . . . .         .   .  2,189,781        6,440         5,630     2,201,851      (739,118) 1,462,733
Net interest income . . . . . . . . . . . . . . . .         .   .    660,733       (6,440)       (3,405)      650,888      (278,918)   371,970
Less: provisions for losses . . . . . . . . . . .           .   .     87,895           —            298        88,193         3,812     92,005
Net interest income after provisions for
   losses . . . . . . . . . . . . . . . . . . . . . . . .   .   .    572,838     (6,440)         (3,703)     562,695      (282,730)     279,965
Fee income . . . . . . . . . . . . . . . . . . . . . .      .   .         —      92,501          33,089      125,590            —       125,590
Collections revenue . . . . . . . . . . . . . . . .         .   .         —      57,473              —        57,473           405       57,878
Other income . . . . . . . . . . . . . . . . . . . .        .   .     40,034         —           59,690       99,724       (80,090)      19,634
Total other income. . . . . . . . . . . . . . . . .         .   .     40,034    149,974          92,779      282,787       (79,685)     203,102
Operating expenses(1) . . . . . . . . . . . . . . .         .   .    164,289     91,833          71,567      327,689        25,058      352,747
Income before income taxes and minority
   interest in net earnings of subsidiaries .               ..       448,583       51,701        17,509      517,793      (387,473)     130,320
Income tax expense(2) . . . . . . . . . . . . . .           ..       165,976       19,178         6,429      191,583       (79,831)     111,752
Minority interest in net earnings of
   subsidiaries . . . . . . . . . . . . . . . . . . . .     ..         —            463           —              463            —           463
Net income . . . . . . . . . . . . . . . . . . . . . .      . . $ 282,607      $ 32,060      $11,080       $ 325,747    $ (307,642) $    18,105

(1)
      Operating expenses for the Lending, DMO, and Corporate and Other business segments include $8 million, $3 million, and $3 mil-
      lion, respectively, of stock option compensation expense.
(2)
      Income taxes are based on a percentage of net income before tax for the individual reportable segment.


                                                                               5
Quarter ended March 31, 2006
                                                                                                    Corporate    Total “Core                    Total
                                                                          Lending       DMO         and Other     Earnings”       Adjustments   GAAP
                                                                                                           (unaudited)
Interest income:
   FFELP Stafford and Other Student Loans                     .   .   . $ 649,751 $     —$     —                $ 649,751         $(351,251) $ 298,500
   FFELP Consolidation Loans . . . . . . . . .                .   .   . 1,027,962       —      —                 1,027,962         (206,627)   821,335
   Private Education Loans . . . . . . . . . . . .            .   .   .   428,760       —      —                   428,760         (187,407)   241,353
   Other loans . . . . . . . . . . . . . . . . . . . . .      .   .   .    23,307       —      —                    23,307               —      23,307
   Cash and investments . . . . . . . . . . . . . .           .   .   .   130,461       —   1,323                  131,784          (35,974)    95,810
Total interest income . . . . . . . . . . . . . . . .         .   .   . 2,260,241       —   1,323                2,261,564         (781,259) 1,480,305
Total interest expense. . . . . . . . . . . . . . . .         .   .   . 1,659,372    5,156  1,278                1,665,806         (573,022) 1,092,784
Net interest income . . . . . . . . . . . . . . . . .         .   .   .   600,869   (5,156)    45                  595,758         (208,237)   387,521
Less: provisions for losses . . . . . . . . . . . .           .   .   .    74,820       —      19                   74,839          (14,520)    60,319
Net interest income after provisions for
   losses . . . . . . . . . . . . . . . . . . . . . . . . .   .   .   .   526,049        (5,156)          26       520,919         (193,717)    327,202
Fee income . . . . . . . . . . . . . . . . . . . . . . .      .   .   .        —         91,612       26,907       118,519               —      118,519
Collections revenue . . . . . . . . . . . . . . . . .         .   .   .        —         56,540           —         56,540              141      56,681
Other income . . . . . . . . . . . . . . . . . . . . .        .   .   .    40,572            —        30,009        70,581           40,062     110,643
Total other income. . . . . . . . . . . . . . . . . .         .   .   .    40,572       148,152       56,916       245,640           40,203     285,843
Operating expenses(1) . . . . . . . . . . . . . . . .         .   .   .   161,438        89,513       58,512       309,463           13,846     323,309
Income before income taxes and minority
   interest in net earnings of subsidiaries . .               ...         405,183        53,483       (1,570)      457,096         (167,360)    289,736
Income tax expense(2) . . . . . . . . . . . . . . .           ...         149,917        19,789         (581)      169,125          (32,080)    137,045
Minority interest in net earnings of
   subsidiaries . . . . . . . . . . . . . . . . . . . . .     ...          —     1,090                  —       1,090                    —       1,090
Net income . . . . . . . . . . . . . . . . . . . . . . .      . . . $ 255,266 $ 32,604              $ (989) $ 286,881             $(135,280) $ 151,601

(1)
      Operating expenses for the Lending, DMO, and Corporate and Other business segments include $10 million, $3 million, and $5 mil-
      lion, respectively, of stock option compensation expense.
(2)
      Income taxes are based on a percentage of net income before tax for the individual reportable segment.


                                                                                    6
SLM CORPORATION
                          Reconciliation of “Core Earnings” Net Income to GAAP Net Income
                                              (In thousands, except per share amounts)
                                                                                                                    Quarters ended
                                                                                                     March 31,       December 31,     March 31,
                                                                                                       2007              2006           2006
                                                                                                    (unaudited)       (unaudited)    (unaudited)
“Core Earnings” net income(A) . . . . . . . . . . .               . . . . . . . . . . . . . . . . . $ 251,208        $ 325,747       $ 286,881
“Core Earnings” adjustments:
  Net impact of securitization accounting . . . .                 .................                      421,485          (67,984)        (62,061)
  Net impact of derivative accounting . . . . . . .               .................                     (331,724)        (242,614)        (38,817)
  Net impact of Floor Income . . . . . . . . . . . .              .................                      (39,021)         (51,762)        (52,569)
  Net impact of acquired intangibles(B) . . . . . .               .................                      (23,906)         (25,113)        (13,913)
Total “Core Earnings” adjustments before income taxes and minority
  interest in net earnings of subsidiaries . . . . . . . . . . . . . . . . . . . . . .                    26,834         (387,473)       (167,360)
Net tax effect(C) . . . . . . . . . . . . . . . . . . . . . . . . . . . . . . . . . . . . . . . .       (161,889)          79,831          32,080
Total “Core Earnings” adjustments before minority interest in net
  earnings of subsidiaries . . . . . . . . . . . . . . . . . . . . . . . . . . . . . . . . .            (135,055)        (307,642)       (135,280)
Minority interest in net earnings of subsidiaries . . . . . . . . . . . . . . . . .                           —                —               —
Total “Core Earnings” adjustments . . . . . . . . . . . . . . . . . . . . . . . . . .                   (135,055)        (307,642)       (135,280)
GAAP net income . . . . . . . . . . . . . . . . . . . . . . . . . . . . . . . . . . . . . . $ 116,153                $ 18,105        $ 151,601
GAAP diluted earnings per common share . . . . . . . . . . . . . . . . . . . . $                             .26     $        .02    $        .34
(A)
      “Core Earnings” diluted earnings per common share . . . . . . . . . . . . . . . . . . . .     $        .57     $        .74    $        .65
(B)
      Represents goodwill and intangible impairment and the amortization of acquired intangibles.
(C)
      Such tax effect is based upon the Company’s “Core Earnings” effective tax rate for the year. The net tax effect results primarily from
      the exclusion of the permanent income tax impact of the equity forward contracts.


“Core Earnings”
     In accordance with the Rules and Regulations of the Securities and Exchange Commission (“SEC”), we
prepare financial statements in accordance with generally accepted accounting principles in the United States
of America (“GAAP”). In addition to evaluating the Company’s GAAP-based financial information, manage-
ment evaluates the Company’s business segments on a basis that, as allowed under SFAS No. 131, “Disclo-
sures about Segments of an Enterprise and Related Information,” differs from GAAP. We refer to
management’s basis of evaluating our segment results as “Core Earnings” presentations for each business
segment and we refer to this information in our presentations with credit rating agencies and lenders. While
“Core Earnings” are not a substitute for reported results under GAAP, we rely on “Core Earnings” to manage
each operating segment because we believe these measures provide additional information regarding the
operational and performance indicators that are most closely assessed by management.
     Our “Core Earnings” are not defined terms within GAAP and may not be comparable to similarly titled
measures reported by other companies. “Core Earnings” net income reflects only current period adjustments to
GAAP net income as described below. Unlike financial accounting, there is no comprehensive, authoritative
guidance for management reporting and as a result, our management reporting is not necessarily comparable
with similar information for any other financial institution. Our operating segments are defined by the products
and services they offer or the types of customers they serve, and they reflect the manner in which financial
information is currently evaluated by management. Intersegment revenues and expenses are netted within the
appropriate financial statement line items consistent with the income statement presentation provided to
management. Changes in management structure or allocation methodologies and procedures may result in

                                                                            7
changes in reported segment financial information. A more detailed discussion of the differences between
GAAP and “Core Earnings” follows.

Limitations of “Core Earnings”
     While GAAP provides a uniform, comprehensive basis of accounting, for the reasons described above,
management believes that “Core Earnings” are an important additional tool for providing a more complete
understanding of the Company’s results of operations. Nevertheless, “Core Earnings” are subject to certain
general and specific limitations that investors should carefully consider. For example, as stated above, unlike
financial accounting, there is no comprehensive, authoritative guidance for management reporting. Our “Core
Earnings” are not defined terms within GAAP and may not be comparable to similarly titled measures
reported by other companies. Unlike GAAP, “Core Earnings” reflect only current period adjustments to GAAP.
Accordingly, the Company’s “Core Earnings” presentation does not represent a comprehensive basis of
accounting. Investors, therefore, may not compare our Company’s performance with that of other financial
services companies based upon “Core Earnings.” “Core Earnings” results are only meant to supplement GAAP
results by providing additional information regarding the operational and performance indicators that are most
closely used by management, the Company’s board of directors, rating agencies and lenders to assess
performance.
     Other limitations arise from the specific adjustments that management makes to GAAP results to derive
“Core Earnings” results. For example, in reversing the unrealized gains and losses that result from
SFAS No. 133, “Accounting for Derivative Instruments and Hedging Activities,” on derivatives that do not
qualify for “hedge treatment,” as well as on derivatives that do qualify but are in part ineffective because they
are not perfect hedges, we focus on the long-term economic effectiveness of those instruments relative to the
underlying hedged item and isolate the effects of interest rate volatility, changing credit spreads and changes
in our stock price on the fair value of such instruments during the period. Under GAAP, the effects of these
factors on the fair value of the derivative instruments (but not on the underlying hedged item) tend to show
more volatility in the short term. While our presentation of our results on a “Core Earnings” basis provides
important information regarding the performance of our Managed portfolio, a limitation of this presentation is
that we are presenting the ongoing spread income on loans that have been sold to a trust managed by us.
While we believe that our “Core Earnings” presentation presents the economic substance of our Managed loan
portfolio, it understates earnings volatility from securitization gains. Our “Core Earnings” results exclude
certain Floor Income, which is real cash income, from our reported results and therefore may understate
earnings in certain periods. Management’s financial planning and valuation of operating results, however, does
not take into account Floor Income because of its inherent uncertainty, except when it is economically hedged
through Floor Income Contracts.

Pre-Tax Differences between “Core Earnings” and GAAP
      Our “Core Earnings” are the primary financial performance measures used by management to evaluate
performance and to allocate resources. Accordingly, financial information is reported to management on a
“Core Earnings” basis by reportable segment, as these are the measures used regularly by our chief operating
decision maker. Our “Core Earnings” are used in developing our financial plans and tracking results, and also
in establishing corporate performance targets and determining incentive compensation. Management believes
this information provides additional insight into the financial performance of the Company’s core business
activities. “Core Earnings” net income reflects only current period adjustments to GAAP net income, as
described in the more detailed discussion of the differences between “Core Earnings” and GAAP that follows,
which includes further detail on each specific adjustment required to reconcile our “Core Earnings” segment
presentation to our GAAP earnings.
    1) Securitization Accounting: Under GAAP, certain securitization transactions in our Lending operating
       segment are accounted for as sales of assets. Under “Core Earnings” for the Lending operating
       segment, we present all securitization transactions on a “Core Earnings” basis as long-term non-
       recourse financings. The upfront “gains” on sale from securitization transactions as well as ongoing
       “servicing and securitization revenue” presented in accordance with GAAP are excluded from “Core

                                                        8
Earnings” and are replaced by the interest income, provisions for loan losses, and interest expense as
   they are earned or incurred on the securitization loans. We also exclude transactions with our off-
   balance sheet trusts from “Core Earnings” as they are considered intercompany transactions on a
   “Core Earnings” basis.
2) Derivative Accounting: “Core Earnings” exclude periodic unrealized gains and losses arising
   primarily in our Lending operating segment, and to a lesser degree in our Corporate and Other
   reportable segment, that are caused primarily by the one-sided mark-to-market derivative valuations
   prescribed by SFAS No. 133 on derivatives that do not qualify for “hedge treatment” under GAAP. In
   our “Core Earnings” presentation, we recognize the economic effect of these hedges, which generally
   results in any cash paid or received being recognized ratably as an expense or revenue over the hedged
   item’s life. “Core Earnings” also exclude the gain or loss on equity forward contracts that under
   SFAS No. 133, are required to be accounted for as derivatives and are marked-to-market through
   earnings.
3) Floor Income: The timing and amount (if any) of Floor Income earned in our Lending operating
   segment is uncertain and in excess of expected spreads. Therefore, we exclude such income from
   “Core Earnings” when it is not economically hedged. We employ derivatives, primarily Floor Income
   Contracts and futures, to economically hedge Floor Income. As discussed above in “Derivative
   Accounting,” these derivatives do not qualify as effective accounting hedges, and therefore, under
   GAAP, they are marked-to-market through the “gains (losses) on derivative and hedging activities,
   net” line on the income statement with no offsetting gain or loss recorded for the economically hedged
   items. For “Core Earnings,” we reverse the fair value adjustments on the Floor Income Contracts and
   futures economically hedging Floor Income and include the amortization of net premiums received in
   income.
4) Acquired Intangibles: Our “Core Earnings” exclude goodwill and intangible impairment and the
   amortization of acquired intangibles.


                                                  9

Weitere ähnliche Inhalte

Was ist angesagt?

Was ist angesagt? (18)

slm SuppFinInfo1Qtr07W33652A_2156_N_993
slm SuppFinInfo1Qtr07W33652A_2156_N_993slm SuppFinInfo1Qtr07W33652A_2156_N_993
slm SuppFinInfo1Qtr07W33652A_2156_N_993
 
plains all american pipeline 2005 10-K part 2
plains all american pipeline   2005 10-K part 2plains all american pipeline   2005 10-K part 2
plains all american pipeline 2005 10-K part 2
 
SLM Corp3QTR2006SupEarnDisc
SLM Corp3QTR2006SupEarnDiscSLM Corp3QTR2006SupEarnDisc
SLM Corp3QTR2006SupEarnDisc
 
China youthmediaannualreport2008
China youthmediaannualreport2008China youthmediaannualreport2008
China youthmediaannualreport2008
 
southern 2007 Narrative Section
southern 2007 Narrative Sectionsouthern 2007 Narrative Section
southern 2007 Narrative Section
 
hca annual reports2001
hca annual reports2001hca annual reports2001
hca annual reports2001
 
danaher 01-4qrel
danaher 01-4qreldanaher 01-4qrel
danaher 01-4qrel
 
SLM CorpSupFinInfoQ406
SLM CorpSupFinInfoQ406SLM CorpSupFinInfoQ406
SLM CorpSupFinInfoQ406
 
qwest communications Q_4Q07_attach
qwest communications Q_4Q07_attachqwest communications Q_4Q07_attach
qwest communications Q_4Q07_attach
 
BANK OF AMERICA 1998 Annual Report
BANK OF AMERICA 1998 Annual ReportBANK OF AMERICA 1998 Annual Report
BANK OF AMERICA 1998 Annual Report
 
danaher 06_4Q_Release
danaher 06_4Q_Releasedanaher 06_4Q_Release
danaher 06_4Q_Release
 
danaher 05-4Q-REL
danaher 05-4Q-RELdanaher 05-4Q-REL
danaher 05-4Q-REL
 
plains all american pipeline 2006 10-K part2
plains all american pipeline  2006 10-K part2plains all american pipeline  2006 10-K part2
plains all american pipeline 2006 10-K part2
 
danaher 08_4Q_Release
danaher 08_4Q_Releasedanaher 08_4Q_Release
danaher 08_4Q_Release
 
Unitus Community Credit Union - Addendum to the 2008 Annual Report
Unitus Community Credit Union - Addendum to the 2008 Annual ReportUnitus Community Credit Union - Addendum to the 2008 Annual Report
Unitus Community Credit Union - Addendum to the 2008 Annual Report
 
xcel energy IR2007Q4
xcel energy IR2007Q4xcel energy IR2007Q4
xcel energy IR2007Q4
 
Washington Federal Investor Presentation
Washington Federal Investor PresentationWashington Federal Investor Presentation
Washington Federal Investor Presentation
 
tjx Annual Reports1998
tjx Annual Reports1998tjx Annual Reports1998
tjx Annual Reports1998
 

Andere mochten auch

KBR2007AnnualReport
KBR2007AnnualReportKBR2007AnnualReport
KBR2007AnnualReport
finance42
 
dana holdings Q208Earnings_080708
dana holdings Q208Earnings_080708dana holdings Q208Earnings_080708
dana holdings Q208Earnings_080708
finance42
 
dana holdings CC934DB3-89EA-454B-A087-C075C5972F55_AANYPres_011409
dana holdings CC934DB3-89EA-454B-A087-C075C5972F55_AANYPres_011409dana holdings CC934DB3-89EA-454B-A087-C075C5972F55_AANYPres_011409
dana holdings CC934DB3-89EA-454B-A087-C075C5972F55_AANYPres_011409
finance42
 
slm FinalPreliminaryProxy2007
slm FinalPreliminaryProxy2007slm FinalPreliminaryProxy2007
slm FinalPreliminaryProxy2007
finance42
 
dana holdings BusinessConduct_BOD_013108
dana holdings BusinessConduct_BOD_013108dana holdings BusinessConduct_BOD_013108
dana holdings BusinessConduct_BOD_013108
finance42
 
dana holdings AuditCommitteeCharter_013108
dana holdings AuditCommitteeCharter_013108dana holdings AuditCommitteeCharter_013108
dana holdings AuditCommitteeCharter_013108
finance42
 
KBRQ407EarningsRelease
KBRQ407EarningsReleaseKBRQ407EarningsRelease
KBRQ407EarningsRelease
finance42
 
tenet healthcare 1stQtrCalendarFiscalYr03_10Q33103
tenet healthcare 1stQtrCalendarFiscalYr03_10Q33103tenet healthcare 1stQtrCalendarFiscalYr03_10Q33103
tenet healthcare 1stQtrCalendarFiscalYr03_10Q33103
finance42
 
dana holdings StandardsofBusiness_english_F_01_08
dana holdings StandardsofBusiness_english_F_01_08dana holdings StandardsofBusiness_english_F_01_08
dana holdings StandardsofBusiness_english_F_01_08
finance42
 
slm ann10k_2000
slm ann10k_2000slm ann10k_2000
slm ann10k_2000
finance42
 
slm annrpt_2001
slm annrpt_2001slm annrpt_2001
slm annrpt_2001
finance42
 
tenet healthcare _Rel_2008_Q4_FINAL_
tenet healthcare _Rel_2008_Q4_FINAL_tenet healthcare _Rel_2008_Q4_FINAL_
tenet healthcare _Rel_2008_Q4_FINAL_
finance42
 
kbr CreditSuissePresentation
kbr CreditSuissePresentationkbr CreditSuissePresentation
kbr CreditSuissePresentation
finance42
 
dana holdings RelatedPartyTransactionsPolicy_013108
dana holdings RelatedPartyTransactionsPolicy_013108dana holdings RelatedPartyTransactionsPolicy_013108
dana holdings RelatedPartyTransactionsPolicy_013108
finance42
 
slm 2004proxy
slm 2004proxyslm 2004proxy
slm 2004proxy
finance42
 
tenet healthcare 1Q0410Q
tenet healthcare 1Q0410Qtenet healthcare 1Q0410Q
tenet healthcare 1Q0410Q
finance42
 

Andere mochten auch (18)

KBR2007AnnualReport
KBR2007AnnualReportKBR2007AnnualReport
KBR2007AnnualReport
 
dana holdings Q208Earnings_080708
dana holdings Q208Earnings_080708dana holdings Q208Earnings_080708
dana holdings Q208Earnings_080708
 
TEX07AR
TEX07ARTEX07AR
TEX07AR
 
dana holdings CC934DB3-89EA-454B-A087-C075C5972F55_AANYPres_011409
dana holdings CC934DB3-89EA-454B-A087-C075C5972F55_AANYPres_011409dana holdings CC934DB3-89EA-454B-A087-C075C5972F55_AANYPres_011409
dana holdings CC934DB3-89EA-454B-A087-C075C5972F55_AANYPres_011409
 
slm FinalPreliminaryProxy2007
slm FinalPreliminaryProxy2007slm FinalPreliminaryProxy2007
slm FinalPreliminaryProxy2007
 
dana holdings BusinessConduct_BOD_013108
dana holdings BusinessConduct_BOD_013108dana holdings BusinessConduct_BOD_013108
dana holdings BusinessConduct_BOD_013108
 
dana holdings AuditCommitteeCharter_013108
dana holdings AuditCommitteeCharter_013108dana holdings AuditCommitteeCharter_013108
dana holdings AuditCommitteeCharter_013108
 
KBRQ407EarningsRelease
KBRQ407EarningsReleaseKBRQ407EarningsRelease
KBRQ407EarningsRelease
 
tenet healthcare 1stQtrCalendarFiscalYr03_10Q33103
tenet healthcare 1stQtrCalendarFiscalYr03_10Q33103tenet healthcare 1stQtrCalendarFiscalYr03_10Q33103
tenet healthcare 1stQtrCalendarFiscalYr03_10Q33103
 
dana holdings StandardsofBusiness_english_F_01_08
dana holdings StandardsofBusiness_english_F_01_08dana holdings StandardsofBusiness_english_F_01_08
dana holdings StandardsofBusiness_english_F_01_08
 
slm ann10k_2000
slm ann10k_2000slm ann10k_2000
slm ann10k_2000
 
slm 200510K
slm 200510Kslm 200510K
slm 200510K
 
slm annrpt_2001
slm annrpt_2001slm annrpt_2001
slm annrpt_2001
 
tenet healthcare _Rel_2008_Q4_FINAL_
tenet healthcare _Rel_2008_Q4_FINAL_tenet healthcare _Rel_2008_Q4_FINAL_
tenet healthcare _Rel_2008_Q4_FINAL_
 
kbr CreditSuissePresentation
kbr CreditSuissePresentationkbr CreditSuissePresentation
kbr CreditSuissePresentation
 
dana holdings RelatedPartyTransactionsPolicy_013108
dana holdings RelatedPartyTransactionsPolicy_013108dana holdings RelatedPartyTransactionsPolicy_013108
dana holdings RelatedPartyTransactionsPolicy_013108
 
slm 2004proxy
slm 2004proxyslm 2004proxy
slm 2004proxy
 
tenet healthcare 1Q0410Q
tenet healthcare 1Q0410Qtenet healthcare 1Q0410Q
tenet healthcare 1Q0410Q
 

Ähnlich wie SuppEarnDiscQtr107W33652A_2155_N_991_1

SLM CorpSupplemental3Qtr08BOW71210BOW004_BITS_N
SLM CorpSupplemental3Qtr08BOW71210BOW004_BITS_NSLM CorpSupplemental3Qtr08BOW71210BOW004_BITS_N
SLM CorpSupplemental3Qtr08BOW71210BOW004_BITS_N
finance42
 
advance auto parts 2003_ar
advance auto parts 2003_aradvance auto parts 2003_ar
advance auto parts 2003_ar
finance48
 
crown holdings 2007AR
  crown holdings  2007AR  crown holdings  2007AR
crown holdings 2007AR
finance30
 
crown holdings 2007AR
  crown holdings  2007AR  crown holdings  2007AR
crown holdings 2007AR
finance30
 
crown holdings 2004annualfinal
  crown holdings 2004annualfinal  crown holdings 2004annualfinal
crown holdings 2004annualfinal
finance30
 
2004annualfinal
2004annualfinal2004annualfinal
2004annualfinal
finance30
 
2004annualfinal
2004annualfinal2004annualfinal
2004annualfinal
finance30
 
crown holdings 2004annualfinal
  crown holdings 2004annualfinal  crown holdings 2004annualfinal
crown holdings 2004annualfinal
finance30
 
agilent 03FinancialStatements
agilent  03FinancialStatementsagilent  03FinancialStatements
agilent 03FinancialStatements
finance38
 
qwest communications Historical Quarterly Results1Q 06_2Q08
qwest communications Historical Quarterly Results1Q 06_2Q08qwest communications Historical Quarterly Results1Q 06_2Q08
qwest communications Historical Quarterly Results1Q 06_2Q08
finance19
 
qwest communications Q_3Q07_Historical_v2
qwest communications Q_3Q07_Historical_v2qwest communications Q_3Q07_Historical_v2
qwest communications Q_3Q07_Historical_v2
finance19
 
qwest communications Historical Quarterly Results1Q 06_3Q08
qwest communications Historical Quarterly Results1Q 06_3Q08qwest communications Historical Quarterly Results1Q 06_3Q08
qwest communications Historical Quarterly Results1Q 06_3Q08
finance19
 
agilent AR04Financials
agilent  AR04Financialsagilent  AR04Financials
agilent AR04Financials
finance38
 
slm 2Qtr2006SupplementalFinancialInfoFinal
slm 2Qtr2006SupplementalFinancialInfoFinalslm 2Qtr2006SupplementalFinancialInfoFinal
slm 2Qtr2006SupplementalFinancialInfoFinal
finance42
 
crown holdings 2006AR
  crown holdings  2006AR  crown holdings  2006AR
crown holdings 2006AR
finance30
 
crown holdings 2006AR
  crown holdings  2006AR  crown holdings  2006AR
crown holdings 2006AR
finance30
 

Ähnlich wie SuppEarnDiscQtr107W33652A_2155_N_991_1 (20)

SLM CorpSupplemental3Qtr08BOW71210BOW004_BITS_N
SLM CorpSupplemental3Qtr08BOW71210BOW004_BITS_NSLM CorpSupplemental3Qtr08BOW71210BOW004_BITS_N
SLM CorpSupplemental3Qtr08BOW71210BOW004_BITS_N
 
advance auto parts 2003_ar
advance auto parts 2003_aradvance auto parts 2003_ar
advance auto parts 2003_ar
 
crown holdings 2007AR
  crown holdings  2007AR  crown holdings  2007AR
crown holdings 2007AR
 
2007AR
2007AR2007AR
2007AR
 
2007AR
2007AR2007AR
2007AR
 
crown holdings 2007AR
  crown holdings  2007AR  crown holdings  2007AR
crown holdings 2007AR
 
crown holdings 2004annualfinal
  crown holdings 2004annualfinal  crown holdings 2004annualfinal
crown holdings 2004annualfinal
 
2004annualfinal
2004annualfinal2004annualfinal
2004annualfinal
 
2004annualfinal
2004annualfinal2004annualfinal
2004annualfinal
 
crown holdings 2004annualfinal
  crown holdings 2004annualfinal  crown holdings 2004annualfinal
crown holdings 2004annualfinal
 
agilent 03FinancialStatements
agilent  03FinancialStatementsagilent  03FinancialStatements
agilent 03FinancialStatements
 
qwest communications Historical Quarterly Results1Q 06_2Q08
qwest communications Historical Quarterly Results1Q 06_2Q08qwest communications Historical Quarterly Results1Q 06_2Q08
qwest communications Historical Quarterly Results1Q 06_2Q08
 
qwest communications Q_3Q07_Historical_v2
qwest communications Q_3Q07_Historical_v2qwest communications Q_3Q07_Historical_v2
qwest communications Q_3Q07_Historical_v2
 
qwest communications Historical Quarterly Results1Q 06_3Q08
qwest communications Historical Quarterly Results1Q 06_3Q08qwest communications Historical Quarterly Results1Q 06_3Q08
qwest communications Historical Quarterly Results1Q 06_3Q08
 
agilent AR04Financials
agilent  AR04Financialsagilent  AR04Financials
agilent AR04Financials
 
slm 2Qtr2006SupplementalFinancialInfoFinal
slm 2Qtr2006SupplementalFinancialInfoFinalslm 2Qtr2006SupplementalFinancialInfoFinal
slm 2Qtr2006SupplementalFinancialInfoFinal
 
2006AR
2006AR2006AR
2006AR
 
crown holdings 2006AR
  crown holdings  2006AR  crown holdings  2006AR
crown holdings 2006AR
 
crown holdings 2006AR
  crown holdings  2006AR  crown holdings  2006AR
crown holdings 2006AR
 
2006AR
2006AR2006AR
2006AR
 

Mehr von finance42

saic annual reports 2003
saic annual reports 2003saic annual reports 2003
saic annual reports 2003
finance42
 
saic annual reports 2004
saic annual reports 2004saic annual reports 2004
saic annual reports 2004
finance42
 
saic annual reports 2005
saic annual reports 2005saic annual reports 2005
saic annual reports 2005
finance42
 
saic annual reports 2006
saic annual reports 2006saic annual reports 2006
saic annual reports 2006
finance42
 
saic annual reports 2007
saic annual reports 2007saic annual reports 2007
saic annual reports 2007
finance42
 
saic annual reports 2008
saic annual reports 2008saic annual reports 2008
saic annual reports 2008
finance42
 
terex Merrill050808
terex Merrill050808terex Merrill050808
terex Merrill050808
finance42
 
terex BofA050808
terex BofA050808terex BofA050808
terex BofA050808
finance42
 
terex Merrill050808
terex Merrill050808terex Merrill050808
terex Merrill050808
finance42
 
terex BofA050808
terex BofA050808terex BofA050808
terex BofA050808
finance42
 
terex Sanford053008
terex Sanford053008terex Sanford053008
terex Sanford053008
finance42
 
terex Shareholders0508
terex Shareholders0508terex Shareholders0508
terex Shareholders0508
finance42
 
terex Shareholders0508
terex Shareholders0508terex Shareholders0508
terex Shareholders0508
finance42
 
terex 08_06_04_JP_Morgan_Conf
terex 08_06_04_JP_Morgan_Confterex 08_06_04_JP_Morgan_Conf
terex 08_06_04_JP_Morgan_Conf
finance42
 
terex Sanford053008
terex Sanford053008terex Sanford053008
terex Sanford053008
finance42
 
terex 08_06_04_JP_Morgan_Conf
terex 08_06_04_JP_Morgan_Confterex 08_06_04_JP_Morgan_Conf
terex 08_06_04_JP_Morgan_Conf
finance42
 
terex KeyBanc060508
terex KeyBanc060508terex KeyBanc060508
terex KeyBanc060508
finance42
 
terex KeyBanc060508
terex KeyBanc060508terex KeyBanc060508
terex KeyBanc060508
finance42
 
terex Wachovia062508
terex Wachovia062508terex Wachovia062508
terex Wachovia062508
finance42
 
terex Wachovia062508
terex Wachovia062508terex Wachovia062508
terex Wachovia062508
finance42
 

Mehr von finance42 (20)

saic annual reports 2003
saic annual reports 2003saic annual reports 2003
saic annual reports 2003
 
saic annual reports 2004
saic annual reports 2004saic annual reports 2004
saic annual reports 2004
 
saic annual reports 2005
saic annual reports 2005saic annual reports 2005
saic annual reports 2005
 
saic annual reports 2006
saic annual reports 2006saic annual reports 2006
saic annual reports 2006
 
saic annual reports 2007
saic annual reports 2007saic annual reports 2007
saic annual reports 2007
 
saic annual reports 2008
saic annual reports 2008saic annual reports 2008
saic annual reports 2008
 
terex Merrill050808
terex Merrill050808terex Merrill050808
terex Merrill050808
 
terex BofA050808
terex BofA050808terex BofA050808
terex BofA050808
 
terex Merrill050808
terex Merrill050808terex Merrill050808
terex Merrill050808
 
terex BofA050808
terex BofA050808terex BofA050808
terex BofA050808
 
terex Sanford053008
terex Sanford053008terex Sanford053008
terex Sanford053008
 
terex Shareholders0508
terex Shareholders0508terex Shareholders0508
terex Shareholders0508
 
terex Shareholders0508
terex Shareholders0508terex Shareholders0508
terex Shareholders0508
 
terex 08_06_04_JP_Morgan_Conf
terex 08_06_04_JP_Morgan_Confterex 08_06_04_JP_Morgan_Conf
terex 08_06_04_JP_Morgan_Conf
 
terex Sanford053008
terex Sanford053008terex Sanford053008
terex Sanford053008
 
terex 08_06_04_JP_Morgan_Conf
terex 08_06_04_JP_Morgan_Confterex 08_06_04_JP_Morgan_Conf
terex 08_06_04_JP_Morgan_Conf
 
terex KeyBanc060508
terex KeyBanc060508terex KeyBanc060508
terex KeyBanc060508
 
terex KeyBanc060508
terex KeyBanc060508terex KeyBanc060508
terex KeyBanc060508
 
terex Wachovia062508
terex Wachovia062508terex Wachovia062508
terex Wachovia062508
 
terex Wachovia062508
terex Wachovia062508terex Wachovia062508
terex Wachovia062508
 

Kürzlich hochgeladen

VIP Call Girl in Mira Road 💧 9920725232 ( Call Me ) Get A New Crush Everyday ...
VIP Call Girl in Mira Road 💧 9920725232 ( Call Me ) Get A New Crush Everyday ...VIP Call Girl in Mira Road 💧 9920725232 ( Call Me ) Get A New Crush Everyday ...
VIP Call Girl in Mira Road 💧 9920725232 ( Call Me ) Get A New Crush Everyday ...
dipikadinghjn ( Why You Choose Us? ) Escorts
 
VIP Independent Call Girls in Andheri 🌹 9920725232 ( Call Me ) Mumbai Escorts...
VIP Independent Call Girls in Andheri 🌹 9920725232 ( Call Me ) Mumbai Escorts...VIP Independent Call Girls in Andheri 🌹 9920725232 ( Call Me ) Mumbai Escorts...
VIP Independent Call Girls in Andheri 🌹 9920725232 ( Call Me ) Mumbai Escorts...
dipikadinghjn ( Why You Choose Us? ) Escorts
 
VIP Call Girl Service Andheri West ⚡ 9920725232 What It Takes To Be The Best ...
VIP Call Girl Service Andheri West ⚡ 9920725232 What It Takes To Be The Best ...VIP Call Girl Service Andheri West ⚡ 9920725232 What It Takes To Be The Best ...
VIP Call Girl Service Andheri West ⚡ 9920725232 What It Takes To Be The Best ...
dipikadinghjn ( Why You Choose Us? ) Escorts
 
VIP Call Girl in Mumbai Central 💧 9920725232 ( Call Me ) Get A New Crush Ever...
VIP Call Girl in Mumbai Central 💧 9920725232 ( Call Me ) Get A New Crush Ever...VIP Call Girl in Mumbai Central 💧 9920725232 ( Call Me ) Get A New Crush Ever...
VIP Call Girl in Mumbai Central 💧 9920725232 ( Call Me ) Get A New Crush Ever...
dipikadinghjn ( Why You Choose Us? ) Escorts
 
Best VIP Call Girls Morni Hills Just Click Me 6367492432
Best VIP Call Girls Morni Hills Just Click Me 6367492432Best VIP Call Girls Morni Hills Just Click Me 6367492432
Best VIP Call Girls Morni Hills Just Click Me 6367492432
motiram463
 
VIP Independent Call Girls in Bandra West 🌹 9920725232 ( Call Me ) Mumbai Esc...
VIP Independent Call Girls in Bandra West 🌹 9920725232 ( Call Me ) Mumbai Esc...VIP Independent Call Girls in Bandra West 🌹 9920725232 ( Call Me ) Mumbai Esc...
VIP Independent Call Girls in Bandra West 🌹 9920725232 ( Call Me ) Mumbai Esc...
dipikadinghjn ( Why You Choose Us? ) Escorts
 
From Luxury Escort Service Kamathipura : 9352852248 Make on-demand Arrangemen...
From Luxury Escort Service Kamathipura : 9352852248 Make on-demand Arrangemen...From Luxury Escort Service Kamathipura : 9352852248 Make on-demand Arrangemen...
From Luxury Escort Service Kamathipura : 9352852248 Make on-demand Arrangemen...
From Luxury Escort : 9352852248 Make on-demand Arrangements Near yOU
 

Kürzlich hochgeladen (20)

VIP Call Girl in Mira Road 💧 9920725232 ( Call Me ) Get A New Crush Everyday ...
VIP Call Girl in Mira Road 💧 9920725232 ( Call Me ) Get A New Crush Everyday ...VIP Call Girl in Mira Road 💧 9920725232 ( Call Me ) Get A New Crush Everyday ...
VIP Call Girl in Mira Road 💧 9920725232 ( Call Me ) Get A New Crush Everyday ...
 
Kopar Khairane Russian Call Girls Number-9833754194-Navi Mumbai Fantastic Unl...
Kopar Khairane Russian Call Girls Number-9833754194-Navi Mumbai Fantastic Unl...Kopar Khairane Russian Call Girls Number-9833754194-Navi Mumbai Fantastic Unl...
Kopar Khairane Russian Call Girls Number-9833754194-Navi Mumbai Fantastic Unl...
 
VIP Independent Call Girls in Andheri 🌹 9920725232 ( Call Me ) Mumbai Escorts...
VIP Independent Call Girls in Andheri 🌹 9920725232 ( Call Me ) Mumbai Escorts...VIP Independent Call Girls in Andheri 🌹 9920725232 ( Call Me ) Mumbai Escorts...
VIP Independent Call Girls in Andheri 🌹 9920725232 ( Call Me ) Mumbai Escorts...
 
Vasai-Virar Fantastic Call Girls-9833754194-Call Girls MUmbai
Vasai-Virar Fantastic Call Girls-9833754194-Call Girls MUmbaiVasai-Virar Fantastic Call Girls-9833754194-Call Girls MUmbai
Vasai-Virar Fantastic Call Girls-9833754194-Call Girls MUmbai
 
Vasai-Virar High Profile Model Call Girls📞9833754194-Nalasopara Satisfy Call ...
Vasai-Virar High Profile Model Call Girls📞9833754194-Nalasopara Satisfy Call ...Vasai-Virar High Profile Model Call Girls📞9833754194-Nalasopara Satisfy Call ...
Vasai-Virar High Profile Model Call Girls📞9833754194-Nalasopara Satisfy Call ...
 
falcon-invoice-discounting-unlocking-prime-investment-opportunities
falcon-invoice-discounting-unlocking-prime-investment-opportunitiesfalcon-invoice-discounting-unlocking-prime-investment-opportunities
falcon-invoice-discounting-unlocking-prime-investment-opportunities
 
Booking open Available Pune Call Girls Shivane 6297143586 Call Hot Indian Gi...
Booking open Available Pune Call Girls Shivane  6297143586 Call Hot Indian Gi...Booking open Available Pune Call Girls Shivane  6297143586 Call Hot Indian Gi...
Booking open Available Pune Call Girls Shivane 6297143586 Call Hot Indian Gi...
 
Top Rated Pune Call Girls Shikrapur ⟟ 6297143586 ⟟ Call Me For Genuine Sex S...
Top Rated  Pune Call Girls Shikrapur ⟟ 6297143586 ⟟ Call Me For Genuine Sex S...Top Rated  Pune Call Girls Shikrapur ⟟ 6297143586 ⟟ Call Me For Genuine Sex S...
Top Rated Pune Call Girls Shikrapur ⟟ 6297143586 ⟟ Call Me For Genuine Sex S...
 
VIP Call Girl Service Andheri West ⚡ 9920725232 What It Takes To Be The Best ...
VIP Call Girl Service Andheri West ⚡ 9920725232 What It Takes To Be The Best ...VIP Call Girl Service Andheri West ⚡ 9920725232 What It Takes To Be The Best ...
VIP Call Girl Service Andheri West ⚡ 9920725232 What It Takes To Be The Best ...
 
W.D. Gann Theory Complete Information.pdf
W.D. Gann Theory Complete Information.pdfW.D. Gann Theory Complete Information.pdf
W.D. Gann Theory Complete Information.pdf
 
Top Rated Pune Call Girls Dighi ⟟ 6297143586 ⟟ Call Me For Genuine Sex Servi...
Top Rated  Pune Call Girls Dighi ⟟ 6297143586 ⟟ Call Me For Genuine Sex Servi...Top Rated  Pune Call Girls Dighi ⟟ 6297143586 ⟟ Call Me For Genuine Sex Servi...
Top Rated Pune Call Girls Dighi ⟟ 6297143586 ⟟ Call Me For Genuine Sex Servi...
 
VIP Call Girl in Mumbai Central 💧 9920725232 ( Call Me ) Get A New Crush Ever...
VIP Call Girl in Mumbai Central 💧 9920725232 ( Call Me ) Get A New Crush Ever...VIP Call Girl in Mumbai Central 💧 9920725232 ( Call Me ) Get A New Crush Ever...
VIP Call Girl in Mumbai Central 💧 9920725232 ( Call Me ) Get A New Crush Ever...
 
8377087607, Door Step Call Girls In Kalkaji (Locanto) 24/7 Available
8377087607, Door Step Call Girls In Kalkaji (Locanto) 24/7 Available8377087607, Door Step Call Girls In Kalkaji (Locanto) 24/7 Available
8377087607, Door Step Call Girls In Kalkaji (Locanto) 24/7 Available
 
Best VIP Call Girls Morni Hills Just Click Me 6367492432
Best VIP Call Girls Morni Hills Just Click Me 6367492432Best VIP Call Girls Morni Hills Just Click Me 6367492432
Best VIP Call Girls Morni Hills Just Click Me 6367492432
 
Top Rated Pune Call Girls Sinhagad Road ⟟ 6297143586 ⟟ Call Me For Genuine S...
Top Rated  Pune Call Girls Sinhagad Road ⟟ 6297143586 ⟟ Call Me For Genuine S...Top Rated  Pune Call Girls Sinhagad Road ⟟ 6297143586 ⟟ Call Me For Genuine S...
Top Rated Pune Call Girls Sinhagad Road ⟟ 6297143586 ⟟ Call Me For Genuine S...
 
VIP Independent Call Girls in Bandra West 🌹 9920725232 ( Call Me ) Mumbai Esc...
VIP Independent Call Girls in Bandra West 🌹 9920725232 ( Call Me ) Mumbai Esc...VIP Independent Call Girls in Bandra West 🌹 9920725232 ( Call Me ) Mumbai Esc...
VIP Independent Call Girls in Bandra West 🌹 9920725232 ( Call Me ) Mumbai Esc...
 
Business Principles, Tools, and Techniques in Participating in Various Types...
Business Principles, Tools, and Techniques  in Participating in Various Types...Business Principles, Tools, and Techniques  in Participating in Various Types...
Business Principles, Tools, and Techniques in Participating in Various Types...
 
From Luxury Escort Service Kamathipura : 9352852248 Make on-demand Arrangemen...
From Luxury Escort Service Kamathipura : 9352852248 Make on-demand Arrangemen...From Luxury Escort Service Kamathipura : 9352852248 Make on-demand Arrangemen...
From Luxury Escort Service Kamathipura : 9352852248 Make on-demand Arrangemen...
 
Stock Market Brief Deck (Under Pressure).pdf
Stock Market Brief Deck (Under Pressure).pdfStock Market Brief Deck (Under Pressure).pdf
Stock Market Brief Deck (Under Pressure).pdf
 
Bandra High Profile Sexy Call Girls,9833754194-Khar Road Speciality Call Girl...
Bandra High Profile Sexy Call Girls,9833754194-Khar Road Speciality Call Girl...Bandra High Profile Sexy Call Girls,9833754194-Khar Road Speciality Call Girl...
Bandra High Profile Sexy Call Girls,9833754194-Khar Road Speciality Call Girl...
 

SuppEarnDiscQtr107W33652A_2155_N_991_1

  • 1. SLM CORPORATION Supplemental Earnings Disclosure March 31, 2007 (Dollars in millions, except earnings per share) Quarters ended March 31, December 31, March 31, 2007 2006 2006 (unaudited) (unaudited) (unaudited) SELECTED FINANCIAL INFORMATION AND RATIOS GAAP Basis Net income . . . . . . . . . . . . . . . . . . . . . . . . . . . . . . . . . . . . . . . . . . . . $ 116 $ 18 $ 152 Diluted earnings per common share(1) . . . . . . . . . . . . . . . . . . . . . . . . $ .26 $ .02 $ .34 Return on assets . . . . . . . . . . . . . . . . . . . . . . . . . . . . . . . . . . . . . . . . .43% .07% .68% “Core Earnings” Basis(2) “Core Earnings” net income . . . . . . . . . . . . . . . . . . . . . . . . . . . . . . . $ 251 $ 326 $ 287 “Core Earnings” diluted earnings per common share(1) . . . . . . . . . . . . $ .57 $ .74 $ .65 “Core Earnings” return on assets . . . . . . . . . . . . . . . . . . . . . . . . . . . . .64% .84% .85% OTHER OPERATING STATISTICS Average on-balance sheet student loans . . . . . . . . . . . . . . . . . . . . . . . $101,499 $ 91,522 $ 82,850 Average off-balance sheet student loans . . . . . . . . . . . . . . . . . . . . . . . 44,663 47,252 42,069 Average Managed student loans . . . . . . . . . . . . . . . . . . . . . . . . . . . . . $146,162 $138,774 $124,919 Ending on-balance sheet student loans, net . . . . . . . . . . . . . . . . . . . . . $104,581 $ 95,920 $ 81,645 Ending off-balance sheet student loans, net . . . . . . . . . . . . . . . . . . . . 45,380 46,172 45,225 Ending Managed student loans, net . . . . . . . . . . . . . . . . . . . . . . . . . . $149,961 $142,092 $126,870 Ending Managed FFELP Stafford and Other Student Loans, net . . . . . $ 41,832 $ 39,869 $ 42,340 Ending Managed FFELP Consolidation Loans, net . . . . . . . . . . . . . . . 83,928 79,635 66,662 Ending Managed Private Education Loans, net . . . . . . . . . . . . . . . . . . 24,201 22,588 17,868 Ending Managed student loans, net . . . . . . . . . . . . . . . . . . . . . . . . . . $149,961 $142,092 $126,870 (1) In December 2004, the Company adopted the Emerging Issues Task Force (“EITF”) Issue No. 04-8, “The Effect of Contingently Convertible Debt on Diluted Earnings per Share,” as it relates to the Company’s $2 billion in contingently convertible debt instru- ments (“Co-Cos”) issued in May 2003. EITF No. 04-8 requires the shares underlying Co-Cos to be included in diluted earnings per common share computations regardless of whether the market price trigger or the conversion price has been met, using the “if-con- verted” method. The impact of Co-Cos to diluted earnings per common share is as follows: Quarters ended March 31, December 31, March 31, 2007 2006 2006 (unaudited) (unaudited) (unaudited) Impact of Co-Cos on GAAP diluted earnings per common share(A) . . . . . . . . . . . . . . . $— $— $— Impact of Co-Cos on “Core Earnings” diluted earnings per common share . . . . . . . . . . $— $(.01) $(.01) (A) There is no impact on diluted earnings per common share because the effect of the assumed conversion is antidilutive. (2) See explanation of “Core Earnings” performance measures under “Reconciliation of ‘Core Earnings’ Net Income to GAAP Net Income.” 1
  • 2. SLM CORPORATION Consolidated Balance Sheets (In thousands, except per share amounts) March 31, December 31, March 31, 2007 2006 2006 (unaudited) (unaudited) Assets FFELP Stafford and Other Student Loans (net of allowance for losses of $10,192; $8,701; and $5,547, respectively) . . . $ 28,561,670 $ 24,840,464 $18,882,890 FFELP Consolidation Loans (net of allowance for losses of $12,087; $11,614; and $9,983 respectively) . . . . . . . . . . . . 66,170,098 61,324,008 53,450,647 Private Education Loans (net of allowance for losses of $369,072; $308,346; and $232,147, respectively) . . . . . . . . 9,849,481 9,755,289 9,311,164 Other loans (net of allowance for losses of $19,803; $20,394; and $15,081, respectively) . . . . . . . . . . . . . . . . . . . . . . . . . 1,350,416 1,308,832 1,114,200 Cash and investments . . . . . . . . . . . . . . . . . . . . . . . . . . . . . . 6,116,168 5,184,673 4,349,669 Restricted cash and investments . . . . . . . . . . . . . . . . . . . . . . . 3,719,020 3,423,326 3,065,148 Retained Interest in off-balance sheet securitized loans . . . . . . 3,643,322 3,341,591 2,487,117 Goodwill and acquired intangible assets, net. . . . . . . . . . . . . . 1,364,016 1,371,606 1,091,301 Other assets. . . . . . . . . . . . . . . . . . . . . . . . . . . . . . . . . . . . . . 6,102,275 5,585,943 4,013,450 Total assets . . . . . . . . . . . . . . . . . . . . . . . . . . . . . . . . . . . . . . $126,876,466 $116,135,732 $97,765,586 Liabilities Short-term borrowings . . . . . . . . . . . . . . . . . . . . . . . . . . . . . . $ 4,428,980 $ 3,528,263 $ 3,362,548 Long-term borrowings . . . . . . . . . . . . . . . . . . . . . . . . . . . . . . 114,070,797 104,558,531 87,083,110 Other liabilities . . . . . . . . . . . . . . . . . . . . . . . . . . . . . . . . . . . 3,990,878 3,679,781 3,555,318 Total liabilities . . . . . . . . . . . . . . . . . . . . . . . . . . . . . . . . . . . 122,490,655 111,766,575 94,000,976 Commitments and contingencies Minority interest in subsidiaries . . . . . . . . . . . . . . . . . . . . . 9,029 9,115 9,682 Stockholders’ equity Preferred stock, par value $.20 per share, 20,000 shares authorized; Series A: 3,300; 3,300; and 3,300 shares, respectively, issued at stated value of $50 per share; Series B: 4,000; 4,000; and 4,000 shares, respectively, issued at stated value of $100 per share . . . . . . . . . . . . . . . 565,000 565,000 565,000 Common stock, par value $.20 per share, 1,125,000 shares authorized: 434,587; 433,113; and 429,329 shares, respectively, issued . . . . . . . . . . . . . . . . . . . . . . . . . . . . . . 86,918 86,623 85,866 Additional paid-in capital . . . . . . . . . . . . . . . . . . . . . . . . . . . 2,638,334 2,565,211 2,364,252 Accumulated other comprehensive income, net of tax . . . . . . . 300,884 349,111 328,496 Retained earnings . . . . . . . . . . . . . . . . . . . . . . . . . . . . . . . . . 1,833,359 1,834,718 1,163,570 Stockholders’ equity before treasury stock . . . . . . . . . . . . . . . 5,424,495 5,400,663 4,507,184 Common stock held in treasury: 22,650; 22,496; and 16,599 shares, respectively . . . . . . . . . . . . . . . . . . . . . . . . . 1,047,713 1,040,621 752,256 Total stockholders’ equity . . . . . . . . . . . . . . . . . . . . . . . . . . . 4,376,782 4,360,042 3,754,928 Total liabilities and stockholders’ equity . . . . . . . . . . . . . . . . . $126,876,466 $116,135,732 $97,765,586 2
  • 3. SLM CORPORATION Consolidated Statements of Income (In thousands, except per share amounts) Quarters ended March 31, December 31, March 31, 2007 2006 2006 (unaudited) (unaudited) (unaudited) Interest income: FFELP Stafford and Other Student Loans . . . . . . . . . . . . . . . . . . $ 450,762 $ 408,727 $ 298,500 FFELP Consolidation Loans . . . . . . . . . . . ................. 1,014,846 966,840 821,335 Private Education Loans . . . . . . . . . . . . . . ................. 338,421 291,425 241,353 Other loans . . . . . . . . . . . . . . . . . . . . . . . ................. 27,973 26,556 23,307 Cash and investments . . . . . . . . . . . . . . . . ................. 113,904 141,155 95,810 Total interest income . . . . . . . . . . . . . . . . . . . . . . . . . . . . . . . . . . . 1,945,906 1,834,703 1,480,305 Total interest expense . . . . . . . . . . . . . . . . . . . . . . . . . . . . . . . . . . 1,532,090 1,462,733 1,092,784 Net interest income . . . . . . . . . . . . . . . . . . . . . . . . . . . . . . . . . . . . 413,816 371,970 387,521 Less: provisions for losses . . . . . . . . . . . . . . . . . . . . . . . . . . . . . . . 150,330 92,005 60,319 Net interest income after provisions for losses . . . . . . . . . . . . . . . . 263,486 279,965 327,202 Other income: Gains on student loan securitizations . . . . . . . . . . . . . . . . . . . . . 367,300 — 30,023 Servicing and securitization revenue . . . . . . . . . . . . . . . . . . . . . . 251,938 184,686 98,931 Losses on securities, net . . . . . . . . . . . . . . . . . . . . . . . . . . . . . . . (30,967) (24,458) (2,948) Gains (losses) on derivative and hedging activities, net . . . . . . . . (356,969) (244,521) (86,739) Guarantor servicing fees . . . . . . . . . . . . . . . . . . . . . . . . . . . . . . . 39,241 33,089 26,907 Debt management fees . . . . . . . . . . . . . . . . . . . . . . . . . . . . . . . . 87,322 92,501 91,612 Collections revenue . . . . . . . . . . . . . . . . . . . . . . . . . . . . . . . . . . 65,562 57,878 56,681 Other . . . . . . . . . . . . . . . . . . . . . . . . . . . . . . . . . . . . . . . . . . . . . 96,433 103,927 71,376 Total other income . . . . . . . . . . . . . . . . . . . . . . . . . . . . . . . . . . . . . 519,860 203,102 285,843 Operating expenses . . . . . . . . . . . . . . . . . . . . . . . . . . . . . . . . . . . . 356,174 352,747 323,309 Income before income taxes and minority interest in net earnings of subsidiaries . . . . . . . . . . . . . . . . . . . . . . . . . . . . . . . . . . . . . . 427,172 130,320 289,736 Income taxes . . . . . . . . . . . . . . . . . . . . . . . . . . . . . . . . . . . . . . . . . 310,014 111,752 137,045 Income before minority interest in net earnings of subsidiaries . . . . 117,158 18,568 152,691 Minority interest in net earnings of subsidiaries . . . . . . . . . . . . . . . 1,005 463 1,090 Net income . . . . . . . . . . . . . . . . . . . . . . . . . . . . . . . . . . . . . . . . . . 116,153 18,105 151,601 Preferred stock dividends . . . . . . . . . . . . . . . . . . . . . . . . . . . . . . . . 9,093 9,258 8,301 Net income attributable to common stock . . . . . . . . . . . . . . . . . . . . $ 107,060 $ 8,847 $ 143,300 Basic earnings per common share . . . . . . . . . . . . . . . . . . . . . . . . $ .26 $ .02 $ .35 Average common shares outstanding . . . . . . . . . . . . . . . . . . . . . . . 411,040 409,597 412,675 Diluted earnings per common share . . . . . . . . . . . . . . . . . . . . . . $ .26 $ .02 $ .34 Average common and common equivalent shares outstanding . . . . . 418,449 418,357 422,974 Dividends per common share . . . . . . . . . . . . . . . . . . . . . . . . . . . . . $ .25 $ .25 $ .22 3
  • 4. SLM CORPORATION Segment and “Core Earnings” Consolidated Statements of Income (In thousands) Quarter ended March 31, 2007 Corporate Total “Core Total Lending DMO and Other Earnings” Adjustments GAAP (unaudited) Interest income: FFELP Stafford and Other Student Loans . . . . . . . . . . . . . . . . . . . . . . . . $ 695,353 $ — $ — $ 695,353 $(244,591) $ 450,762 FFELP Consolidation Loans . . . . . . . . . . 1,331,235 — — 1,331,235 (316,389) 1,014,846 Private Education Loans . . . . . . . . . . . . . 657,584 — — 657,584 (319,163) 338,421 Other loans . . . . . . . . . . . . . . . . . . . . . . 27,973 — — 27,973 — 27,973 Cash and investments . . . . . . . . . . . . . . . 161,677 — 2,135 163,812 (49,908) 113,904 Total interest income . . . . . . . . . . . . . . . . . 2,873,822 — 2,135 2,875,957 (930,051) 1,945,906 Total interest expense. . . . . . . . . . . . . . . . . 2,220,136 6,687 5,568 2,232,391 (700,301) 1,532,090 Net interest income . . . . . . . . . . . . . . . . . . 653,686 (6,687) (3,433) 643,566 (229,750) 413,816 Less: provisions for losses . . . . . . . . . . . . . 197,930 — 606 198,536 (48,206) 150,330 Net interest income after provisions for losses . . . . . . . . . . . . . . . . . . . . . . . . . . 455,756 (6,687) (4,039) 445,030 (181,544) 263,486 Fee income . . . . . . . . . . . . . . . . . . . . . . . . — 87,326 39,241 126,567 (4) 126,563 Collections revenue . . . . . . . . . . . . . . . . . . — 65,322 — 65,322 240 65,562 Other income . . . . . . . . . . . . . . . . . . . . . . 44,418 — 51,317 95,735 232,000 327,735 Total other income. . . . . . . . . . . . . . . . . . . 44,418 152,648 90,558 287,624 232,236 519,860 Operating expenses(1) . . . . . . . . . . . . . . . . . 171,563 93,248 67,505 332,316 23,858 356,174 Income before income taxes and minority interest in net earnings of subsidiaries . .. 328,611 52,713 19,014 400,338 26,834 427,172 Income tax expense(2) . . . . . . . . . . . . . . .. 121,586 19,504 7,035 148,125 161,889 310,014 Minority interest in net earnings of subsidiaries . . . . . . . . . . . . . . . . . . . . .. — 1,005 — 1,005 — 1,005 Net income . . . . . . . . . . . . . . . . . . . . . . .. $ 207,025 $ 32,204 $11,979 $ 251,208 $(135,055) $ 116,153 (1) Operating expenses for the Lending, DMO, and Corporate and Other business segments include $9 million, $3 million, and $4 mil- lion, respectively, of stock option compensation expense. (2) Income taxes are based on a percentage of net income before tax for the individual reportable segment. 4
  • 5. Quarter ended December 31, 2006 Corporate Total “Core Total Lending DMO and Other Earnings” Adjustments GAAP (unaudited) Interest income: FFELP Stafford and Other Student Loans . . . . . . . . . . . . . . . . . . . . . . . . $ 700,961 $ — $ — $ 700,961 $ (292,234) $ 408,727 FFELP Consolidation Loans . . . . . . . . . . 1,305,744 — — 1,305,744 (338,904) 966,840 Private Education Loans . . . . . . . . . . . . . 620,092 — — 620,092 (328,667) 291,425 Other loans . . . . . . . . . . . . . . . . . . . . . . 26,556 — — 26,556 — 26,556 Cash and investments . . . . . . . . . . . . . . . 197,161 — 2,225 199,386 (58,231) 141,155 Total interest income . . . . . . . . . . . . . . . . . 2,850,514 — 2,225 2,852,739 (1,018,036) 1,834,703 Total interest expense. . . . . . . . . . . . . . . . . 2,189,781 6,440 5,630 2,201,851 (739,118) 1,462,733 Net interest income . . . . . . . . . . . . . . . . . . 660,733 (6,440) (3,405) 650,888 (278,918) 371,970 Less: provisions for losses . . . . . . . . . . . . . 87,895 — 298 88,193 3,812 92,005 Net interest income after provisions for losses . . . . . . . . . . . . . . . . . . . . . . . . . . 572,838 (6,440) (3,703) 562,695 (282,730) 279,965 Fee income . . . . . . . . . . . . . . . . . . . . . . . . — 92,501 33,089 125,590 — 125,590 Collections revenue . . . . . . . . . . . . . . . . . . — 57,473 — 57,473 405 57,878 Other income . . . . . . . . . . . . . . . . . . . . . . 40,034 — 59,690 99,724 (80,090) 19,634 Total other income. . . . . . . . . . . . . . . . . . . 40,034 149,974 92,779 282,787 (79,685) 203,102 Operating expenses(1) . . . . . . . . . . . . . . . . . 164,289 91,833 71,567 327,689 25,058 352,747 Income before income taxes and minority interest in net earnings of subsidiaries . .. 448,583 51,701 17,509 517,793 (387,473) 130,320 Income tax expense(2) . . . . . . . . . . . . . . .. 165,976 19,178 6,429 191,583 (79,831) 111,752 Minority interest in net earnings of subsidiaries . . . . . . . . . . . . . . . . . . . . .. — 463 — 463 — 463 Net income . . . . . . . . . . . . . . . . . . . . . . . . $ 282,607 $ 32,060 $11,080 $ 325,747 $ (307,642) $ 18,105 (1) Operating expenses for the Lending, DMO, and Corporate and Other business segments include $8 million, $3 million, and $3 mil- lion, respectively, of stock option compensation expense. (2) Income taxes are based on a percentage of net income before tax for the individual reportable segment. 5
  • 6. Quarter ended March 31, 2006 Corporate Total “Core Total Lending DMO and Other Earnings” Adjustments GAAP (unaudited) Interest income: FFELP Stafford and Other Student Loans . . . $ 649,751 $ —$ — $ 649,751 $(351,251) $ 298,500 FFELP Consolidation Loans . . . . . . . . . . . . 1,027,962 — — 1,027,962 (206,627) 821,335 Private Education Loans . . . . . . . . . . . . . . . 428,760 — — 428,760 (187,407) 241,353 Other loans . . . . . . . . . . . . . . . . . . . . . . . . 23,307 — — 23,307 — 23,307 Cash and investments . . . . . . . . . . . . . . . . . 130,461 — 1,323 131,784 (35,974) 95,810 Total interest income . . . . . . . . . . . . . . . . . . . 2,260,241 — 1,323 2,261,564 (781,259) 1,480,305 Total interest expense. . . . . . . . . . . . . . . . . . . 1,659,372 5,156 1,278 1,665,806 (573,022) 1,092,784 Net interest income . . . . . . . . . . . . . . . . . . . . 600,869 (5,156) 45 595,758 (208,237) 387,521 Less: provisions for losses . . . . . . . . . . . . . . . 74,820 — 19 74,839 (14,520) 60,319 Net interest income after provisions for losses . . . . . . . . . . . . . . . . . . . . . . . . . . . . 526,049 (5,156) 26 520,919 (193,717) 327,202 Fee income . . . . . . . . . . . . . . . . . . . . . . . . . . — 91,612 26,907 118,519 — 118,519 Collections revenue . . . . . . . . . . . . . . . . . . . . — 56,540 — 56,540 141 56,681 Other income . . . . . . . . . . . . . . . . . . . . . . . . 40,572 — 30,009 70,581 40,062 110,643 Total other income. . . . . . . . . . . . . . . . . . . . . 40,572 148,152 56,916 245,640 40,203 285,843 Operating expenses(1) . . . . . . . . . . . . . . . . . . . 161,438 89,513 58,512 309,463 13,846 323,309 Income before income taxes and minority interest in net earnings of subsidiaries . . ... 405,183 53,483 (1,570) 457,096 (167,360) 289,736 Income tax expense(2) . . . . . . . . . . . . . . . ... 149,917 19,789 (581) 169,125 (32,080) 137,045 Minority interest in net earnings of subsidiaries . . . . . . . . . . . . . . . . . . . . . ... — 1,090 — 1,090 — 1,090 Net income . . . . . . . . . . . . . . . . . . . . . . . . . . $ 255,266 $ 32,604 $ (989) $ 286,881 $(135,280) $ 151,601 (1) Operating expenses for the Lending, DMO, and Corporate and Other business segments include $10 million, $3 million, and $5 mil- lion, respectively, of stock option compensation expense. (2) Income taxes are based on a percentage of net income before tax for the individual reportable segment. 6
  • 7. SLM CORPORATION Reconciliation of “Core Earnings” Net Income to GAAP Net Income (In thousands, except per share amounts) Quarters ended March 31, December 31, March 31, 2007 2006 2006 (unaudited) (unaudited) (unaudited) “Core Earnings” net income(A) . . . . . . . . . . . . . . . . . . . . . . . . . . . . $ 251,208 $ 325,747 $ 286,881 “Core Earnings” adjustments: Net impact of securitization accounting . . . . ................. 421,485 (67,984) (62,061) Net impact of derivative accounting . . . . . . . ................. (331,724) (242,614) (38,817) Net impact of Floor Income . . . . . . . . . . . . ................. (39,021) (51,762) (52,569) Net impact of acquired intangibles(B) . . . . . . ................. (23,906) (25,113) (13,913) Total “Core Earnings” adjustments before income taxes and minority interest in net earnings of subsidiaries . . . . . . . . . . . . . . . . . . . . . . 26,834 (387,473) (167,360) Net tax effect(C) . . . . . . . . . . . . . . . . . . . . . . . . . . . . . . . . . . . . . . . . (161,889) 79,831 32,080 Total “Core Earnings” adjustments before minority interest in net earnings of subsidiaries . . . . . . . . . . . . . . . . . . . . . . . . . . . . . . . . . (135,055) (307,642) (135,280) Minority interest in net earnings of subsidiaries . . . . . . . . . . . . . . . . . — — — Total “Core Earnings” adjustments . . . . . . . . . . . . . . . . . . . . . . . . . . (135,055) (307,642) (135,280) GAAP net income . . . . . . . . . . . . . . . . . . . . . . . . . . . . . . . . . . . . . . $ 116,153 $ 18,105 $ 151,601 GAAP diluted earnings per common share . . . . . . . . . . . . . . . . . . . . $ .26 $ .02 $ .34 (A) “Core Earnings” diluted earnings per common share . . . . . . . . . . . . . . . . . . . . $ .57 $ .74 $ .65 (B) Represents goodwill and intangible impairment and the amortization of acquired intangibles. (C) Such tax effect is based upon the Company’s “Core Earnings” effective tax rate for the year. The net tax effect results primarily from the exclusion of the permanent income tax impact of the equity forward contracts. “Core Earnings” In accordance with the Rules and Regulations of the Securities and Exchange Commission (“SEC”), we prepare financial statements in accordance with generally accepted accounting principles in the United States of America (“GAAP”). In addition to evaluating the Company’s GAAP-based financial information, manage- ment evaluates the Company’s business segments on a basis that, as allowed under SFAS No. 131, “Disclo- sures about Segments of an Enterprise and Related Information,” differs from GAAP. We refer to management’s basis of evaluating our segment results as “Core Earnings” presentations for each business segment and we refer to this information in our presentations with credit rating agencies and lenders. While “Core Earnings” are not a substitute for reported results under GAAP, we rely on “Core Earnings” to manage each operating segment because we believe these measures provide additional information regarding the operational and performance indicators that are most closely assessed by management. Our “Core Earnings” are not defined terms within GAAP and may not be comparable to similarly titled measures reported by other companies. “Core Earnings” net income reflects only current period adjustments to GAAP net income as described below. Unlike financial accounting, there is no comprehensive, authoritative guidance for management reporting and as a result, our management reporting is not necessarily comparable with similar information for any other financial institution. Our operating segments are defined by the products and services they offer or the types of customers they serve, and they reflect the manner in which financial information is currently evaluated by management. Intersegment revenues and expenses are netted within the appropriate financial statement line items consistent with the income statement presentation provided to management. Changes in management structure or allocation methodologies and procedures may result in 7
  • 8. changes in reported segment financial information. A more detailed discussion of the differences between GAAP and “Core Earnings” follows. Limitations of “Core Earnings” While GAAP provides a uniform, comprehensive basis of accounting, for the reasons described above, management believes that “Core Earnings” are an important additional tool for providing a more complete understanding of the Company’s results of operations. Nevertheless, “Core Earnings” are subject to certain general and specific limitations that investors should carefully consider. For example, as stated above, unlike financial accounting, there is no comprehensive, authoritative guidance for management reporting. Our “Core Earnings” are not defined terms within GAAP and may not be comparable to similarly titled measures reported by other companies. Unlike GAAP, “Core Earnings” reflect only current period adjustments to GAAP. Accordingly, the Company’s “Core Earnings” presentation does not represent a comprehensive basis of accounting. Investors, therefore, may not compare our Company’s performance with that of other financial services companies based upon “Core Earnings.” “Core Earnings” results are only meant to supplement GAAP results by providing additional information regarding the operational and performance indicators that are most closely used by management, the Company’s board of directors, rating agencies and lenders to assess performance. Other limitations arise from the specific adjustments that management makes to GAAP results to derive “Core Earnings” results. For example, in reversing the unrealized gains and losses that result from SFAS No. 133, “Accounting for Derivative Instruments and Hedging Activities,” on derivatives that do not qualify for “hedge treatment,” as well as on derivatives that do qualify but are in part ineffective because they are not perfect hedges, we focus on the long-term economic effectiveness of those instruments relative to the underlying hedged item and isolate the effects of interest rate volatility, changing credit spreads and changes in our stock price on the fair value of such instruments during the period. Under GAAP, the effects of these factors on the fair value of the derivative instruments (but not on the underlying hedged item) tend to show more volatility in the short term. While our presentation of our results on a “Core Earnings” basis provides important information regarding the performance of our Managed portfolio, a limitation of this presentation is that we are presenting the ongoing spread income on loans that have been sold to a trust managed by us. While we believe that our “Core Earnings” presentation presents the economic substance of our Managed loan portfolio, it understates earnings volatility from securitization gains. Our “Core Earnings” results exclude certain Floor Income, which is real cash income, from our reported results and therefore may understate earnings in certain periods. Management’s financial planning and valuation of operating results, however, does not take into account Floor Income because of its inherent uncertainty, except when it is economically hedged through Floor Income Contracts. Pre-Tax Differences between “Core Earnings” and GAAP Our “Core Earnings” are the primary financial performance measures used by management to evaluate performance and to allocate resources. Accordingly, financial information is reported to management on a “Core Earnings” basis by reportable segment, as these are the measures used regularly by our chief operating decision maker. Our “Core Earnings” are used in developing our financial plans and tracking results, and also in establishing corporate performance targets and determining incentive compensation. Management believes this information provides additional insight into the financial performance of the Company’s core business activities. “Core Earnings” net income reflects only current period adjustments to GAAP net income, as described in the more detailed discussion of the differences between “Core Earnings” and GAAP that follows, which includes further detail on each specific adjustment required to reconcile our “Core Earnings” segment presentation to our GAAP earnings. 1) Securitization Accounting: Under GAAP, certain securitization transactions in our Lending operating segment are accounted for as sales of assets. Under “Core Earnings” for the Lending operating segment, we present all securitization transactions on a “Core Earnings” basis as long-term non- recourse financings. The upfront “gains” on sale from securitization transactions as well as ongoing “servicing and securitization revenue” presented in accordance with GAAP are excluded from “Core 8
  • 9. Earnings” and are replaced by the interest income, provisions for loan losses, and interest expense as they are earned or incurred on the securitization loans. We also exclude transactions with our off- balance sheet trusts from “Core Earnings” as they are considered intercompany transactions on a “Core Earnings” basis. 2) Derivative Accounting: “Core Earnings” exclude periodic unrealized gains and losses arising primarily in our Lending operating segment, and to a lesser degree in our Corporate and Other reportable segment, that are caused primarily by the one-sided mark-to-market derivative valuations prescribed by SFAS No. 133 on derivatives that do not qualify for “hedge treatment” under GAAP. In our “Core Earnings” presentation, we recognize the economic effect of these hedges, which generally results in any cash paid or received being recognized ratably as an expense or revenue over the hedged item’s life. “Core Earnings” also exclude the gain or loss on equity forward contracts that under SFAS No. 133, are required to be accounted for as derivatives and are marked-to-market through earnings. 3) Floor Income: The timing and amount (if any) of Floor Income earned in our Lending operating segment is uncertain and in excess of expected spreads. Therefore, we exclude such income from “Core Earnings” when it is not economically hedged. We employ derivatives, primarily Floor Income Contracts and futures, to economically hedge Floor Income. As discussed above in “Derivative Accounting,” these derivatives do not qualify as effective accounting hedges, and therefore, under GAAP, they are marked-to-market through the “gains (losses) on derivative and hedging activities, net” line on the income statement with no offsetting gain or loss recorded for the economically hedged items. For “Core Earnings,” we reverse the fair value adjustments on the Floor Income Contracts and futures economically hedging Floor Income and include the amortization of net premiums received in income. 4) Acquired Intangibles: Our “Core Earnings” exclude goodwill and intangible impairment and the amortization of acquired intangibles. 9