Weitere ähnliche Inhalte
Ähnlich wie national oilwell varco Fourth Quarter 2008 Segmented Financial Data
Ähnlich wie national oilwell varco Fourth Quarter 2008 Segmented Financial Data (20)
Kürzlich hochgeladen (20)
national oilwell varco Fourth Quarter 2008 Segmented Financial Data
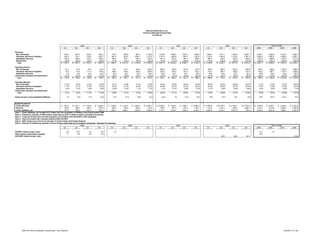
- 1. National Oilwell Varco, Inc.
Proforma Selected Financial Data
(In millions)
2005 2006 2007 2008 Year To Date
Q1 Q2 Q3 Q4 Q1 Q2 Q3 Q4 Q1 Q2 Q3 Q4 Q1 Q2 Q3 Q4 2005 2006 2007 2008
Revenues
Rig Technology 543.3 575.2 572.8 644.4 715.3 845.8 887.3 1,136.5 1,219.8 1,409.2 1,521.9 1,593.8 1,602.9 1,911.1 1,926.4 2,087.7 2,335.7 3,584.9 5,744.7 7,528.1
Petroleum Services & Supplies 640.2 703.1 755.0 829.7 881.4 945.5 1,006.1 1,122.2 1,147.9 1,206.6 1,292.1 1,323.0 1,313.0 1,244.3 1,310.5 1,387.3 2,928.0 3,955.2 4,969.6 5,255.1
Distribution Services 235.9 258.0 272.4 308.2 326.5 319.1 353.5 370.5 351.9 344.8 361.3 365.7 365.7 425.6 497.6 483.0 1,074.5 1,369.6 1,423.7 1,771.9
Eliminations (58.4) (69.0) (80.7) (88.4) (71.0) (97.4) (87.0) (98.3) (97.8) (115.2) (109.2) (118.2) (113.0) (136.3) (122.9) (147.8) (296.5) (353.7) (440.4) (520.0)
Total $ 1,361.0 $ 1,467.3 $ 1,519.5 $ 1,693.9 $ 1,852.2 $ 2,013.0 $ 2,159.9 $ 2,530.9 $ 2,621.8 $ 2,845.4 $ 3,066.1 $ 3,164.3 $ 3,168.6 $ 3,444.7 $ 3,611.6 $ 3,810.2 $ 6,041.7 $ 8,556.0 $ 11,697.6 $ 14,035.1
Operating Income
Rig Technology 61.3 51.9 70.4 80.5 93.7 134.1 155.2 225.5 268.8 340.8 373.5 410.5 406.0 506.4 500.5 556.6 264.1 608.5 1,393.6 1,969.5
Petroleum Services & Supplies 75.0 91.9 117.0 134.6 168.9 198.4 240.5 259.9 282.9 293.4 301.9 303.7 313.5 296.7 329.6 341.0 418.5 867.7 1,181.9 1,280.8
Distribution Services 7.6 9.6 14.5 14.9 20.4 20.2 25.0 28.4 24.9 23.1 25.1 20.9 18.8 24.8 43.7 42.4 46.6 94.0 94.0 129.7
Unallocated expenses and eliminations (33.3) (32.6) (32.0) (30.8) (44.6) (48.6) (43.4) (43.0) (53.5) (57.9) (58.8) (65.4) (71.8) (49.7) (55.5) (63.5) (128.7) (179.6) (235.6) (240.5)
Total $ 110.6 $ 120.8 $ 169.9 $ 199.2 $ 238.4 $ 304.1 $ 377.3 $ 470.8 $ 523.1 $ 599.4 $ 641.7 $ 669.7 $ 666.5 $ 778.2 $ 818.3 $ 876.5 $ 600.5 $ 1,390.6 $ 2,433.9 $ 3,139.5
Operating Margins
Rig Technology 11.3% 9.0% 12.3% 12.5% 13.1% 15.9% 17.5% 19.8% 22.0% 24.2% 24.5% 25.8% 25.3% 26.5% 26.0% 26.7% 11.3% 17.0% 24.3% 26.2%
Petroleum Services & Supplies 11.7% 13.1% 15.5% 16.2% 19.2% 21.0% 23.9% 23.2% 24.6% 24.3% 23.4% 23.0% 23.9% 23.8% 25.2% 24.6% 14.3% 21.9% 23.8% 24.4%
Distribution Services 3.2% 3.7% 5.3% 4.8% 6.2% 6.3% 7.1% 7.7% 7.1% 6.7% 6.9% 5.7% 5.1% 5.8% 8.8% 8.8% 4.3% 6.9% 6.6% 7.3%
Unallocated expenses and eliminations - - - - - - - - - - - - - - - - - - - -
Total 8.1% 8.2% 11.2% 11.8% 12.9% 15.1% 17.5% 18.6% 20.0% 21.1% 20.9% 21.2% 21.0% 22.6% 22.7% 23.0% 9.9% 16.3% 20.8% 22.4%
Equity Income in Unconsolidated Affiliates 6.7 14.9 17.9 24.4 27.3 37.3 26.6 34.3 44.6 30 24.3 25.4 15.8 23.5 20.1 15.8 63.9 125.5 124.3 75.2
Capital Equipment:
Ending Backlog $ 851.6 $ 1,191.1 $ 1,752.9 $ 2,298.5 $ 3,186.2 $ 4,149.4 $ 5,384.4 $ 6,005.7 $ 6,395.0 $ 7,202.4 $ 7,994.1 $ 9,003.5 $ 9,900.8 $ 10,779.5 $ 11,793.7 $ 11,051.8 $ 2,298.5 $ 6,005.7 $ 9,003.5 $ 11,051.8
Revenue 305.0 396.0 359.5 355.6 420.5 526.9 592.6 774.6 789.8 957.4 1,152.4 1,182.7 1,131.9 1,337.4 1,363.4 1,466.1 1,416.1 2,314.5 4,082.3 5,298.8
(1)
Order Additions, net 373.7 735.5 921.3 901.3 1,308.1 1,490.1 1,827.6 1,395.8 1,179.1 1,764.7 1,944.1 2,192.1 2,029.3 2,216.1 2,377.6 724.2 2,931.8 6,021.6 7,080.1 7,347.2
Note 1: Order Additions, net includes $133 million from the acquisition of Rolligon in the fourth quarter 2006.
Note 2: Preliminary estimate of GRP balance sheet step-up ($191.2 million annual) is included in all periods.
Note 3: These pro formas have not been prepared in accordance with US GAAP or SEC guidelines.
Note 4: Does not include inter-company between GRP and NOV.
Note 5: GRP results are pro forma for the sale of certain tubular technology divisions.
Note 6: Effective of preliminary estimate of Varco balance sheet step-up is included in all periods. Excludes the following
2005 2006 2007 2008 Year To Date
Q1 Q2 Q3 Q4 Q1 Q2 Q3 Q4 Q1 Q2 Q3 Q4 Q1 Q2 Q3 Q4 2005 2006 2007 2008
NOI/VRC related merger costs 9.8 10.5 2.8 8.6 7.9 - - - - - - - - - - - 31.7 7.9 - -
Stock based compensation expense 1.1 4.8 4.8 4.9 - - - - - - - - - - 15.6 - - -
NOV/GRP related merger costs - - - - - - - - - - - - - 62.5 28.0 20.1 - - - 110.6
2008 Q4 Proforma Selected Financial Data - Tear Sheet.xls 2/4/2009 8:11 AM