Avoidable Errors in Payroll Compliance for Payroll Services Providers - Globu...
Expeditors International of Washington 8-k_03-17-09
1. The following information is included in this document as a result of Expeditors' policy regarding public
disclosure of corporate information. Answers to additional inquiries, if any, that comply with this policy
are scheduled to become available on or about March 27, 2009.
SAFE HARBOR FOR FORWARD-LOOKING STATEMENTS UNDER SECURITIES LITIGATION
REFORM ACT OF 1995; CERTAIN CAUTIONARY STATEMENTS
Certain portions of this document including the answers to questions 1, 2, 3, 4, 5, 6, 7, 9, 10, 11, 12, 13, 14,
15, 16, 17, 18, 19, 21, 22, 23, 24, 25, 26, 27, 28, 29, 30, 31, 32, 33, 34, 35, 37, 38, 39, 40, 41, 42, 43, 44,
45, 47, 48, 50, 51, 52, 53, 54, 56, 57, 58, 59, 60 and 61 contain forward-looking statements which are based
on certain assumptions and expectations of future events that are subject to risks and uncertainties. Actual
future results and trends may differ materially from historical results or those projected in any forward-
looking statements depending on a variety of factors including, but not limited to, changes in customer
demand for Expeditors’ services caused by a general economic slow-down, inventory build-up, decreased
consumer confidence, volatility in equity markets, energy prices, political changes, or the unpredictable
acts of competitors.
SELECTED INQUIRIES RECEIVED THROUGH FEBRUARY 12, 2009
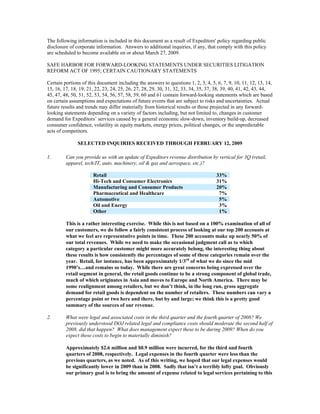
1. Can you provide us with an update of Expeditors revenue distribution by vertical for 3Q (retail,
apparel, tech/IT, auto, machinery, oil & gas and aerospace, etc.)?
Retail 33%
Hi-Tech and Consumer Electronics 31%
Manufacturing and Consumer Products 20%
Pharmaceutical and Healthcare 7%
Automotive 5%
Oil and Energy 3%
Other 1%
This is a rather interesting exercise. While this is not based on a 100% examination of all of
our customers, we do follow a fairly consistent process of looking at our top 200 accounts at
what we feel are representative points in time. These 200 accounts make up nearly 50% of
our total revenues. While we need to make the occasional judgment call as to which
category a particular customer might more accurately belong, the interesting thing about
these results is how consistently the percentages of some of these categories remain over the
year. Retail, for instance, has been approximately 1/3rd of what we do since the mid
1990’s…and remains so today. While there are great concerns being expressed over the
retail segment in general, the retail goods continue to be a strong component of global trade,
much of which originates in Asia and moves to Europe and North America. There may be
some realignment among retailers, but we don’t think, in the long run, gross aggregate
demand for retail goods is dependent on the number of retailers. These numbers can vary a
percentage point or two here and there, but by and large; we think this is a pretty good
summary of the sources of our revenue.
2. What were legal and associated costs in the third quarter and the fourth quarter of 2008? We
previously understood DOJ related legal and compliance costs should moderate the second half of
2008, did that happen? What does management expect these to be during 2009? When do you
expect these costs to begin to materially diminish?
Approximately $2.6 million and $0.9 million were incurred, for the third and fourth
quarters of 2008, respectively. Legal expenses in the fourth quarter were less than the
previous quarters, as we noted. As of this writing, we hoped that our legal expenses would
be significantly lower in 2009 than in 2008. Sadly that isn’t a terribly lofty goal. Obviously
our primary goal is to bring the amount of expense related to legal services pertaining to this
2. issue down to zero…not likely given that the DOJ and the EC investigations into allegations
of anti-competitive activities among forwarders remain open as do related civil litigation
issues. We don’t hold any of the cards in these matters, and accordingly, it is difficult for us
to make effective judgments or comments about the estimates of 2009 legal expenses. We
are in that unenviable position of one who is petting a lion. The fact that the lion hasn’t bit
anybody yet does nothing to reduce the anxiety that at any moment, despite the previous
pats on the head that were uneventful, you could find yourself missing an arm, a leg or, at a
minimum, a few fingers.
3. What trends in year-over-year airfreight tonnage and ocean container volume growth did you see
sequentially throughout the quarter from July through September 2008? What did those trends
look like in the 2008 fourth quarter January 2009?
Airfreight Tonnage Ocean Freight Container
Inc. (Dec.) Count Inc. (Dec.)
July 2% 2%
August (10)% (2)%
September (10)% (4)%
October (10)% (4)%
November (22)% (9)%
December (24)% (13)%
January 2009 (32)% (18)%
In looking at the trends during the fourth quarter of 2008, we experienced the beginnings of
what was promised to be a good October. This was confirming what we had anticipated as
being a rather moderate peak season for airfreight, but a peak season nonetheless. As the
results of the credit crises and stock market crash started to show up in the airfreight
numbers the last part of October and November, we re-evaluated our prognosis for the
quarter and pulled off our seasonal pricing. Fortunately, during the last part of the quarter,
a spot market in airfreight buying opportunities developed in reaction to the falling demand,
and we were able to increase overall airfreight yields.
4. Please directionally discuss your Gross Yield for the fourth quarter 2008 and your expectations
for the first quarter 2009 for Air, Ocean and Customs Brokerage.
Historically, airfreight yields have tightened during the fourth quarter as compared with
yields experienced during the third quarter. That said, the dynamics which played out in
the airfreight markets during the fourth quarter of 2008, and which are carrying over into
the first quarter of 2009, were and are anything but typical. We saw a record free-fall in
fuel prices during the last five or six months of 2008. Since the middle of December, oil
prices have been somewhat irregular, bouncing up and down and generally reflecting the
uncertainty in the global economy. It is interesting to note, however, that oil prices in the
second half of 2008 dropped nearly twice as fast as they rose during the first half of 2008.
With fuel surcharges still being topical, one cannot help but compare surcharge levels with
oil prices and attempt to draw some historical comparisons. Given the disarray that the
rapid drop in fuel prices created in the pricing arena, in our opinion, there is an increasing
inability to draw a hard and fast line between the actual fuel surcharge rates from the
underlying freight rates. The Asian markets have had a certain amount of disparity in the
amount of surcharges being levied for some time. One only has to look at the existing
disparity in fuel surcharges from differing Asian origins to show just how indistinguishable
the base rates and the surcharges have become when looking at overall freight rates being
charged.
A rather erratic spot market also developed as the drop in airfreight volumes gave a final
stir to an already convoluted pricing pot. Airfreight yields typically expand sequentially
3. during a routine first quarter from levels experienced during a routine fourth quarter. In
an attempt to keep pricing fresh, we are adjusting rates frequently to reflect movements in
market prices costs which are both sustainable and are not short-term spot rates, as spot
rates come and go when there is a vibrant spot market. January yields were up sequentially
from those experienced in December, but by a small amount.
Ocean freight volumes decreased from Asia to North America, and to the U.S. in particular.
The ocean markets have seen similar yield movements as those experienced by the airfreight
product, however, not at as great a level. In our opinion, this is due to the ocean freight
market being regulated. There also appears to be more capacity taken out of the ocean
freight markets relative to the comparable amount of relative capacity taken out of the
airfreight markets.
Customs, as we’ve commented before, isn’t something we think should even have a margin
since it is largely fee-based and the parts of anything that technically could have a margin
were historically considered to be incidental and immaterial. But, since we also have local
delivery, our domestic trucking product and our warehouse and distribution product, all
business that have a margin (direct revenue that has a direct cost associated with it), rolling
up into the “Customs brokerage and other” revenue line item in our externally-reported
financial statements, we do record a margin on these items, even though historically one
could have argued they were immaterial. As these other businesses have grown, since they
all have a yield and customs brokerage has only a fee (the ultimate 100% yield), a systematic
diminution of margin has occurred. While it has been a very small incremental decrease
measured on an annual basis, it has none the less been expected. In this case, the perceived
yield shrinkage is a good thing…it means these other businesses are growing and viable and
are making an increasingly larger contribution to our net revenue and operating income
numbers. As for the 2009 yield outlook, we have included our thoughts in other responses.
5. Why, if Air volumes are slowing globally year-over-year in the third and fourth quarters of 2008,
did Gross Yields contract year-over-year in the third quarter and expand in the fourth quarter?
Can you provide ocean and air Gross Yields net of fuel for the periods first quarter 2007 thru
third quarter2008?
The movement in gross yields is not limited solely to the movements in the underlying fuel
prices. We believe there are other things that affect our pricing on the airfreight side.
Certainly underlying capacity issues, fuel surcharge declines and a decline in market
volumes had marked impacts on gross yields.
4. As to the second part of your question, we don’t have the information for gross yields net of
fuel on hand, at least not in any meaningful aggregated format. It may be analyzed on a
very granular, lane-specific lane basis as the need may arise, but we don’t routinely produce
a specific report like this for managing our business. The reason is that we pass on the fuel
price surcharges we receive, and accordingly, the movement of the yields is largely irrelevant
to how we manage our business or measure our profitability.(1) Since we don’t use that
information to manage our business internally…and we think our record shows that we
actually understand how we should be managing this business…we would conclude that
information isn’t sufficiently relevant to be meaningful for someone externally attempting to
understand our business. In light of that, for us to produce and publish this information as a
purely academic exercise doesn’t make a lot of sense.
6. What drove the approximately $2.2M in Other Income during both the third and fourth quarters of
2008? Assuming this isn’t one-time in nature, does this represent a reasonable quarterly run rate
going forward?
The Other Income number of $2.2 million in the third quarter of 2008 was primarily a net
foreign exchange gain recognized during that quarter. The $2.2 million amount reported in
the fourth quarter of 2008 was primarily due to an annual business tax rebate which we
received as part of an economic development incentive program we qualify for in China.
With respect to the third quarter 2008 foreign exchange number, we wouldn’t anticipate this
number going forward and, accordingly, we don’t budget for foreign exchange gains and
losses. Despite the well-publicized problems of the U.S. economy (and the U.S. economy isn’t
a cult of one in the “well-publicized problems” department), the U.S. dollar, did see some
strength relative to a number of previously “high-flying” currencies. We are wise enough,
however, not to put on “The Great Carnac’s” turban (from the old Johnny Carson late night
television show) and pretend we can predict the future movements of foreign exchange
rates…and that is precisely what we’d have to do to answer the last part of your
question…besides, no one around here is anxious to play the Ed McMahon part.
As for the business tax refund reported in the fourth quarter of 2008, under the terms of the
program we are involved in, we are supposed to get more of those. Since these are
government programs, however, and governments globally are struggling with the impacts
of the credit crises and associated ripple effects, we will, prudently, recognize the refunds as
we receive them. That isn’t because we’re concerned that we might not receive them. It is
just that the amounts and the timing of these payments are dependent on so many variables
beyond our control that they do not yield themselves to terribly long range forecasting. In
keeping with our policy of “Don’t attempt to predict the unpredictable” (which is also a
corollary of our final 2009 Corporate Goal “Don’t do anything Stupid!”), we’ll revert to our
“It’s not real until its cash” policy.
_________
(1)
Note that we said quot;pass onquot; versus quot;pass through.quot; In the past, we probably have been somewhat inconsistent ourselves in how we have used these
words. Perhaps this is as good of time as any to make sure that we clarify the difference as we see it and draw a sharp distinction between the words
quot;pass through,quot; which we've never actually been able to do at a per shipment level, versus quot;pass onquot; which means trying to the recover the costs we incur
when we pay the carrier-imposed surcharges. The distinction is particularly relevant in light of how we manage fuel surcharges charged to us by the
airlines. Simply absorbing these surcharges is not an option, and would be, as our CEO once put it, quot;financial suicide.quot; The term quot;pass throughquot; could be
suggested to mean that the actual surcharges charged to us by airlines are passed through to the customer in exactly the amount the airlines charge us. In
fact, because we are consolidators, aggregating many different shipments representing a variety of commodities, all having varying freight characteristics,
using many different airlines and lanes, most of whom charge drastically different surcharges, it has never been possible to quot;pass throughquot; fuel surcharges
at the individual shipment level penny for penny. Another reason prohibiting us from passing through the surcharge on an actual cost basis is the
potential time lag between carrier notification and our customer's acceptance of an increase. We have absorbed the surcharges for periods of time period
between airline implementation and customer acceptance of our proposed increases. Typically, these costs we absorb during this period are not even
quot;passed on,quot; let alone quot;passed through.” Accordingly, we simply attempt to recover our costs by quot;passing onquot; surcharge increases based on a weighted
average blended rate, which is the actual amounts of airline surcharge costs that we expect to pay out based on the estimated tonnage we expect to
allocate to various airlines on specific lanes. Our yields during the times that airlines were raising surcharges are pretty much prima facie evidence that
our blended rate methodology may not have been as effective, in the aggregate, at recovering (or quot;passing onquot;) these costs as much as we would have
intended. Hence quot;pass onquot; means trying to recover cost increases in an environment where a penny per penny shipment by shipment recovery is not
possible.
5. 7. What was the impact from foreign exchange on earnings in the third and fourth quarters of 2008
and what would you expect the impact to be during the first quarter of 2009 assuming current
global exchange rates remain unchanged through the remainder of the quarter?
On its face, this seems like a straight-forward question, particularly given the response to
question 6. However, it is actually extremely complex. As noted above, the foreign exchange
gains reported as part of other income were, in the third quarter of 2008 at least, unusually
large, as net foreign exchange gains go. That said, the mathematical accounting of net
foreign exchange gains and losses that rolled through our Statement of Earnings during the
third and fourth quarters of 2008, for that matter, had a pretty immaterial impact on our
consolidated financial statements taken as a whole. This issue is complex because it is very
difficult to understand the impact currency movements have on customer buying patterns
and how they impact sourcing decisions is unquantifiable until the business actually shows
up. Ultimately, those indirect effects can be more meaningful than transaction gains and
losses rolling through our statement of earnings. As for 2009, it is anyone’s guess given the
roller-coaster ride that the global markets currently find themselves in (see our response to
question 6 above).
Finally, and something we have taken great comfort in, while we really have no idea what
the net foreign exchange gain or loss number will be next year, our focus on settling foreign
exchange transactions quickly (through our internal and proprietary clearing house process)
has historically helped us keep this number, whether it is a gain or a loss, within a “clearly
immaterial” range. That has proven to be the best and most cost-effective foreign exchange
management philosophy for us to adopt. We’re not currency traders and we’re not a bank.
We do know our business and what we try to do is to manage the unavoidable and collateral
risks of being a transaction intense global company in a manner that reduces the collateral
risk to as low a degree as possible and still be cost effective. In the aggregate, our way of
managing foreign exchange has served us well. Sure there have been times when we’ve felt
“the sting of the scorpion” that can sometimes come when there is a swift and unexpected
currency devaluation, but we’ve also benefited from these same swift and unexpected
changes in exchange rates. In many cases, done right, we end up in a position where what
we lose in one market we gain in another and it’s a net sum zero game. With our internal
clearing house settling transactions weekly among our branches, our exchange gains and
losses over time have typically broken even, at least at a material basis.
8. What was then FTE headcount for the third and fourth quarters of 2008?
30-Sep-08 30-Sep-07 Diff % Diff
North America 4,452 4,439 13 0.3%
Asia 3,600 3,315 285 8.6%
Europe and Africa 2,030 1,895 135 7.1%
Middle East 1,079 965 114 11.8%
South America 628 604 24 4.0%
Australasia 216 214 2 0.9%
Information Systems 583 548 35 6.4%
Corporate 184 171 13 7.6%
Total 12,772 12,151 621 5.1%
6. 31-Dec-08 31-Dec-07 Diff % Diff
North America 4,387 4,520 (133) -2.9%
Asia 3,520 3,364 156 4.6%
Europe and Africa 2,026 1,908 118 6.2%
Middle East 1,080 989 91 9.2%
South America 619 611 8 1.3%
Australasia 218 214 4 1.9%
Information Systems 579 546 33 6.0%
Corporate 187 169 18 10.7%
Total 12,616 12,321 295 2.4%
9. Expeditors seemingly made some opportunistic share repurchases in the third quarter of 2008,
likely as a result of the sharp pull back in the stock. Has Expeditors become more aggressive in its
share repurchases or should we view this as opportunistic? How many shares of stock did
Expeditors repurchase at what average price during the third quarter of 2008? If opportunistic,
what valuation or share price do you consider a threshold area where you think about getting
more aggressive in purchasing shares?
We did buy back some shares during the third quarter 2008 under our discretionary buy-
back plan, based on what we saw at the time as a buying opportunity …it was fulfilling that
last part of this buy back that we began to notice what would play out in subsequent weeks
on the world finance stage as the “Credit Crises” of 2008. Based on how we usually make
discretionary buy-backs, amounts that typically took two or three days to repurchase under
the buy back rules were being swallowed in several hours. Having experienced a couple of
transactions like this, rather than force feed the financial piranhas that were aggressively
swarming all over any overture of liquidity, we decided to reel in our fishing line and sit on
the banks of the river for a while….and other than continuing to keep our share-count flat,
we continue to sit on the bank and study the waters still today. As for announcing a
threshold, even if we had one, we’re trying to figure out how it would be in the interest of
our shareholders to broadcast that number…we haven’t come up with one yet, so we’ll just
leave that one alone, addressed but unanswered.
During the third quarter of 2008, we repurchased 2,103,907 shares of stock at an average
price of $35.81.
During the fourth quarter of 2008, we repurchased 277,819 shares of stock at an average
price of $33.33.
10. How much stock may Expeditors buy back under its current authorization?
We have two stock buy back plans, discretionary (which means if we want to) and non-
discretionary (which means we have to). What we buy back under the Non-Discretionary
(have to) Plan is enough shares to use up all the money our employees pay to exercise stock
options. What we buy back under the Discretionary (want to) Plan is two fold. While we
are authorized to buy back shares down to the level where we have only 200,000,000 shares
outstanding (that would be about 12 million shares or about $300 million at current prices),
for the past several years, we have been following a policy of maintaining our outstanding
share count by buying back only the amount of shares that are issued by the exercise of stock
options (after using the actual proceeds received from our employees to buy back the shares
required by the Non-Discretionary (have to) Plan). In addition to that, when we feel that
there is a particularly strong disconnect in the stock, we have, on several occasions,
repurchased large blocks (several million shares).
11. Can you provide any cap-ex guidance for 2009?
7. Our approved 2009 capital budget is mas o menos $70 million. But, as we’ve commented
before, Budget is Budget…and as of right now...given the current environment…we’d bet
for 2009’s capital expenditures to be more menos than more mas.
12. Please update us on your progress in developing the Aerospace and Oil/Gas verticals over the
past six months? How have Boeing’s strike and Panalpina’s exit in Nigeria impacted/aided your
progress in the development of those verticals?
We continue to invest in dedicated account teams and systems to develop these important
verticals. We are focusing on providing services to companies who are serious about
compliance and quality of service and who are looking for innovative solutions to solve
today’s increasingly complex logistics challenges. Boeing’s strike hasn’t affected us at
all…Boeing isn’t a customer...and never has been, despite our best efforts at having tried to
get a foot in the door. We’d love to handle any part of their business, but we’re a fairly
young company and Boeing is fiercely loyal to their suppliers. We’ve only been in business
for 30 years and that is a much shorter time period than the incumbents at Boeing. As for
Panalpina, their withdrawal from Nigeria hasn’t affected us at all either. If Panalpina won’t
do business in Nigeria, why would we? Someday, provided we’re convinced that we can do
it right, we might, but as for now, Nigeria is a market that we still don’t know enough about
to jump into with both feet. We provide pre-paid freight services to that country (meaning
the shipper at origin pays the bills) and our business stops upon goods reaching the port or
airport.
13. Which geographies or trade lanes seem to be growing the strongest (or shrinking the least) and
which are shrinking the most currently?
Asia origins show the largest year-over-year volume decreases, “not surprisingly” (to quote
President Obama). There is some modest strength in both the EMAIR and Latin America
regions, but in selective markets. We’ve had some bright spots here and there. A couple of
weeks ago, our preliminary container count out of China was higher than the same week a
year prior, a first for several months.
14. Please provide Expeditors' volume growth relative to the corresponding year-ago period for each
of airfreight in total and ocean freight in total; for the third quarter of 2008 in total, October
2008, and November 2008 (month-to-date). For China specifically, please provide Expeditors'
volume growth over the corresponding year-ago period for each of (i) airfreight import, (ii)
airfreight export, (iii) ocean freight import, and (iv) ocean freight export; the third and fourth
quarters of 2008..
We have provided tonnage information in our response to question 3 above. We’ve never
disclosed airfreight tonnage and ocean freight container information at the regional level or
by country. There are competitive ramifications to releasing that kind of information that
outweigh any benefits we could think of by releasing it.
15. Can you identify a business opportunity Expeditors has been able to take advantage of that relates
specifically to the credit crunch and these quot;tumultuous economic timesquot;? Aside from any impact
on Expeditors' volume growth from the weak macro economic environment, can you identify any
negative effects on Expeditors' business that relate specifically to the credit crunch?
We won’t name names, but we have been encouraged by calls and inquiries we’ve received
from customers and potential customers letting us know that they were performing rigorous
supplier financial viability assessments on us and on our competitors. To date, we’ve done
quite well in these assessments…and quite frankly we welcome them. We think that our
financial stability is a competitive advantage and we intend to use that advantage wherever
possible. Having done reasoned, prudent and measured things when times were really
booming, we think that we are very well positioned in this kind of an environment to expand
8. market share. While market share increases don’t show up immediately in slow times,
historically their cumulative impact has manifested itself as the economy moves into a
recovery phase.
16. Please discuss the unique customer, geographic, trade-lane, or other factors that allowed
Expeditors to post double-digit revenue (gross and net) growth in the September quarter , while
other global air and ocean freight forwarders posted revenue growth in the 5% to 6% range.
We’re not particularly sure how to effectively answer this question, as it requires us to
explain, in part, why our third quarter results were better than those of our competitors.
Not to be overly glib, but how our competitors are doing is not something that we’re
particularly concerned about. We’ve always believed that our most effective measuring
stick is to measure ourselves against our expectations. We’re not sure what drove their
growth…as we don’t spend much time studying what they do. Our exposure to our
competitors comes from our customers, feedback from people like you and the press releases
that they put out that make their way to us (usually from a customer or an analyst). So in
that sense, you likely know more about how they’ve done than we do.
From purely our own perspective, we thought we had a strong third quarter and a very good
fourth quarter, particularly in light of the things we observed going on around us. While
that is probably not the answer you’re looking for, we think it is an answer that is consistent
with how our culture reacts to the current events we’re dealing with. At Expeditors, because
of our culture and our compensation model, where profitability (and losses) are shared
throughout the organization, we believe we have a higher percentage of people with a more
direct interest in the success of our business model and in consistent, sustainable, responsible
financial and operational success for of our company and our operating units than do our
competitors. That makes a tremendous difference in the way we all feel about Expeditors,
about our customers and their service requirements, and, maybe most importantly, about
each other and about our prospects for the future. We don’t apologize for the fact that we
need to make a profit, but by the same token, we understand that we can only be profitable
to the extent that our customers see value in the services we provide. Despite the recent
trend to assume that government is the answer to everything that ails us, we’re very
comfortable with understanding that our greatest source of strength and security comes
from each other. We hold the key to our future more than outside factors.
17. We noticed that Expeditors posted a contribution margin (year-to-year change in operating profit
divided by year-to-year change in revenue) of 10.3% in the third quarter; this is higher than the
company's long-run average and is the best contribution Expeditors has produced since the third
quarter of 2007. Is this a result of the decline in fuel prices? Has Expeditors made structural
cost savings that contributed to the improved contribution? Should we expect Expeditors to be
able to repeat this type of contribution margin over the coming quarters?
This was a very good question. We had to spend some time thinking through our response,
as we don’t typically do what we consider to be an efficiency analysis (operating margin)
based on gross revenue. Internally, we calculate our operating efficiency by dividing
operating income by net revenue. The rational is that we think our way (based upon net
rather than gross revenue) is a much more stringent measure as it mitigates any “windfall”
factor on the upside and very forceful in driving productivity initiatives in the face of
changes in market pricing. Focusing on net revenue also provides a kind of common
denominator for us because of the different types of services that we provide and it removes
the elements of fuel surcharges…which to us is not truly relevant as to the degree we can just
try to pass them on. (Please refer to question 5, footnote 1 above.)
9. But, since you’ve asked about an operating margin calculation using gross revenue, we
would say that certainly when you use gross revenue to calculate this analysis, some part of
that improvement you noted is related to the fall in surcharges. Given how the same analysis
comes out using net revenue as opposed to gross revenue, (which would remove the impact
of fuel surcharges), from our perspective, the improvements in incremental operating
income over the periods that you mention, and also extending into the fourth quarter of
2008, reflects both seasonality and the efficiencies that come from our cost containment and
productivity management initiatives.
18. From Expeditors perspective, has the elimination of liner conferences led to any change in pricing
dynamics?
The dynamics of pricing remain pretty much the same, albeit they happen a little more
quickly than before, but all in all, we haven’t really noticed a tremendous change.
19. How would you characterize the development of the supply situation for airfreight and ocean
freight?
We’re not actually sure what this question is asking. If this is a question about capacity,
then we would note that there is excess capacity in both the ocean and the airfreight
markets, albeit in differing amounts. How the excess capacity is being handled also differs
depending on whether we’re talking about air or ocean carriers. Both the ocean and air
carriers are managing the excess capacity pretty effectively. From a practical standpoint,
there probably isn’t as much capacity as people are anecdotally speculating about. That
said, there have been a tremendous number of ships moored and shut down in anticipation
of being “off-line” for a long time. Many of the carriers have leases coming due and are
planning on taking on new ships that they will own outright as opposed to lease. Those ocean
carriers who have followed this strategy have made this change anticipating that owning
ships will be more profitable than leasing. Whether that is true or not, only time will tell.
There are also a lot of planes, particularly old, fuel-inefficient planes, being parked in the
desert. Much of these older fuel-inefficient planes, were parked when fuel prices
skyrocketed during the first part of 2008. As of late, the air carriers are even beginning to
park some of their most fuel-efficient aircraft as well, some with the expressed intention of
not bringing them back into the rotation anytime during 2009. The parking of planes,
dropping tonnage in airfreight markets and production delays of new, more fuel efficient
aircraft, have actually provided the airlines with a convenient way to manage capacity even
when the added dynamics of falling tonnage presented itself in the last half of 2008.
20. Could you compare the yield benefit (excluding fuel) from falling freight rates on the Asia to U.S.
trade lane verses the Asia to Europe trade lane? Could you comment on how the net revenue per
kilo trended throughout the third and fourth quarters for airfreight? Could you also comment on
how the net revenue per transaction trended through the quarter for ocean freight?
Because of the reductions in freight tonnage during the fourth quarter of 2008, and most
specifically in the last part of the fourth quarter, air carriers began to drop base rates to
attract more business. During that same period, the rapid drop in oil prices resulted in
lower fuel surcharges. The convergence of these two factors caused a rather unique
environment to develop during the last part of the fourth quarter where there were more
opportunities for spot pricing with airlines than there had been over the last several years.
While this didn’t change the surcharges per se, it did provide some targeted base price
buying opportunities that, while dynamic in nature, were also somewhat recurrent
depending on the market circumstances that were present in a particular week, day or
month. In this complicated pricing environment, where both surcharges and, later in the
fourth quarter, base rates were being adjusted downward, the pricing mechanisms in place
for adjusting customer rates, which could not be adjusted downward for irregular spot
10. pricing, resulted in higher yields during the last part of the fourth quarter of 2008. Our
yields also benefited from two market factors during the fourth quarter of 2008 that were
different from those experienced during the fourth quarter of 2007; 1) a superior freight mix
in 2008 than was influenced in part by the second factor; 2) the absence in of very low-
margin cargo in the fourth quarter of 2008 which had been a drag on overall profitability
during the fourth quarter of 2007. These yield increases, however, were remarkably close,
in the aggregate, to the amounts by which yields were depressed during the first half of the
year...and for the year 2007. During that time, fuel surcharges and pricing increases
occurred more quickly than they could be absorbed by our customers. Accordingly, we
were forced to absorb these increases during the time between airline announcement and
customer agreement.
Net airfreight revenue per kilo for the third quarter 2008, as discussed in our third quarter
2008 10-Q, was up 11%. Net airfreight revenue per kilo for the fourth quarter 2008 was up
over 30%, largely due to a very favorable spot market. Net revenue per kilo for the year
2008 was up 12% as compared with the year 2007.
Ocean freight net revenue per TEU was up 15% in the third quarter of 2008 and 18%
during the fourth quarter of 2008. Net revenue per TEU was up 11% for the year 2008 over
2007.
21. What would you describe as your structural advantages that your business has over your
competitors?
Once again, we’ll defer the comparisons to competitors…not because we are offering a
quarter to any of our competitors…but because we’re more concerned about what we need
to provide to our customers than we are concerned about an analysis of competitive
advantages relative to competitors’ positioning.
Things that we have that we think enable us to offer up competitive solutions that work for
our customers are: a common system stretching across six continents; our compensation
system; and our commitment to training and to creating an environment of unlimited
opportunity for our employees. These things create a culture where everyone who works at
Expeditors has both a vision of the path forward and a support team that keeps them
focused on that objective. That kind of harnessed and focused energy creates the drive and
commitment for excellence in providing the kind of customer service that grows market
share in good and in slow times.
22. How would you describe your organization’s degree of integration (functional, process &
technological) with your customer? Can you provide any examples to elaborate?
Our degree of integration with the customer is entirely dependent on the customer’s needs.
Some customers require a very high degree of technological integration provided by very
complex EDI (Electronic Data Interchange) applications. Others require very precise
process integration, that isn’t as dependent upon technological integration as it is dependent
on communication and monitoring capabilities reinforced by customer specific SOP’s
(Standard Operating Procedures). The SOP may or may not be technologically focused,
depending on the customer’s needs.
In this day and age, technology, in some form, is a critical part of any customer alignment
and functional integration. Since technology emerged as a key differentiator in the late
1980’s, we have pursued a philosophy of working with our customers to provide tailored IS
solutions.
11. 23. Can you share any examples where customers have logistics contracts with you purely based on
your brand strength & reputation?
We believe, based on direct feedback, that there are many customers who use our services to
one degree or another because of our reputation for financial stability, willingness to adapt
systems and the reach of our global network. The financial stability factor is another reason
that we have been told by both existing and potential customers that they desire to expand
their business with us.
24. Please discuss any major industry awards/accolades you have achieved over the past 5 years.
These would exclude industry certification & standards awards/accreditations.
The most significant and meaningful awards that we receive come from our
customers…and that would be in the form of more business opportunities. We also receive
supplier recognition awards from time to time…and we value those greatly…having them on
display in our corporate office. Aside from customer and supplier recognition, we’re not as
concerned about what industry recognition we may receive. While we appreciate them when
they occur, we certainly do not spend time or devote resources to chase them…that would
deflect us away from the greater needs our customers.
25. Do you have a track-and-trace solution? If so, how well is it integrated with the customer?
No one in our business today could exist without a robust track-and-trace solution, so, yes,
we have one, and we’re told it’s a very good one. Our solution is called exp.o and it is
available on-line to our customers. It is configurable to our customers’ unique needs. They
determine to what degree exp.o is integrated into their monitoring processes. For many
customers, this is the only real support they require from us. For others, much more
specially-tailored EDI solutions are required. For these solutions, we devote a considerable
amount of time and resources meeting these customer’s needs.
26. Can you provide any guidance on your IT capex per year? (As a percentage of total capex?)
That depends on the year obviously, as some years we spend more than others. In 2008 we
spent about $20 million of total non-real estate capital expenditures of approximately $35
million---or about 57%. Total capital expenditures, including real estate were just over $60
million.
27. Are you able to share any operational reliability KPI's that you have, and how have you
performed against your targets? Examples include inventory accuracy, order-to-dispatch on-time
reliability, etc.
There are two types of relevant KPI’s that we focus on at Expeditors. The first are those
benchmarks that we use to gauge progress and productivity for internal process
improvement purposes. These KPI’s are core to the delivery of our services. The second are
the KPI’s that our customers require us to perform according to their direction. The kinds
of things that are important to us for our internal KPI measurements concern productivity
per activity, cost and revenue per activity, etc. Very basic, but very fundamental. We don’t
publish our internal KPI’s externally for two reasons: the first is obvious, because we
consider them to be proprietary, and the second, because they are ever changing. We
continue to raise our level of performance expectations as we make and achieve our goals.
The KPI’s for our customers are their KPI’s, and we wouldn’t publish those either…for the
same reason we wouldn’t publish ours. We do report on these KPI’s quarterly to our
customers, or more often as they require.
12. 28. Can you share examples of how your customer pricing model is developed? E.g. activity-based-
costing, modular cost-to-serve, etc.?
We don’t have “customer pricing models” in the sense that we think you’re asking this
question…and the pricing methodologies that we do employ are neither rigid nor formula
driven. Pricing is much more fluid and directed based on specific customer needs and
circumstances in the market (i.e. carrier pricing strategies).
29. Does your organization have subject matter teams or experts that you can deploy to your
customers organizations (on a temp/contract/etc. basis) to help define and solve their supply chain
needs? Are you able to provide examples?
We do. We deploy these experts very strategically to assist customers in analyzing and
meeting specific supply chain challenges. Some typical examples are: alternative network
configurations; optimizing supply alternatives; reviewing sourcing locations for optimal
effectiveness; and monitoring customers’ purchase orders from factory location to delivery
at the ports.
30. Are you a 4PL organization? Or do you have a 4PL division?
When asked this question, our CEO is fond of replying that we are actually a 5PL because
that is as least one better than a 4PL. He is only being half facetious. In the general sense of
this word, we do have 4PL capability…among the many capabilities that we have. The
various monikers being thrown around in the industry today to describe specific
capabilities, when it gets down to what exactly is included in a 4PL offering, are often not
very consistent among customers, competitors and service providers. That said, 4PL
capability, as some customers define it, would limit someone like us from both managing the
business and participating in that business as a preferred provider (the 3PL part). We try to
avoid those kinds of situations, opting for a model where transparency and customer
involvement resolve any potential conflict issues. We actually maintain that a model such as
this allows us to assist our customers to an even greater degree than does a segregated 4PL
model. Addressing your follow-on second question, we do not have a 4PL division, per se,
but where we do 4PL work, so far we have been able to accommodate it as a product just
like our other product service offerings. We also offer to our customers some proprietary
4PL tools that reside in a separate division and are delivered under a separate brand,
Tradeflow. Tradeflow solutions are also available to Expeditors’ operating offices if they,
like our customers, want to pay for them.
31. Are there any specific natural/asset/regulatory restraints that support your company, but deter
your competitors from entering your market? Examples of restraints include highly capital
intensive &/or regulatory blocked infrastructure (e.g. rail tracks), regressive regulatory regime
allowing monopoly/duopoly markets, etc.
There are significant barriers in entry to this business, and the uninitiated might tend to
under estimate just how significant these barriers are. Systems (particularly common
systems that work) that are globally deployed are one of those areas we think are drastically
underestimated and are a tremendous barrier to entry in today’s markets. Regulatory
constraints also exist, since this is such a highly regulated business (customs, cargo security,
ocean freight moving to and from the United States, multiple licensing requirements, and
complex reporting requirements) that having the necessary infrastructure is definitely a
barrier to entry.
32. There has been a lot of industry coverage about the tightening in trade financing, with an inability
to secure letters of credit cited as severely restricting maritime trade out of the Asia region. Is
Expeditors seeing a negative impact in its ocean forwarding business as a result? Is there an
13. opportunity for the company to use the strength of its balance sheet to capitalize on the current
credit crunch to facilitate customer transactions and take share longer-term?
Customers unable to get credit in order to place orders are, of course, a concern. It would
be our impression, however, that at a very general and very macro level, there is more
concern about overall global consumer demand (or lack thereof) than there is deep
consternation over there not being enough money around for our customers to finance their
purchases. Certainly there are challenges, but most of our customers seem to be dealing
with the ability to purchase…they are being more cautious about speculating whether they’ll
be able to sell what they buy, but the lack of credit seems secondary to the lack of consumer
confidence.
As to the second part of your question, we do understand what we are…and as a global
logistics company providing a broad-range of supply chain services, what we are does not
include being a bank. As we’ve said many times before, in a non-asset based model where
we don’t buy planes, trains and automobiles, it doesn’t make a lot of sense to us to buy the
customer’s freight in order to move it just to earn a freight profit and, if we’re lucky, a
financing fee. Even in the good times, there was not adequate capital available for us to
“front” the commercial purchase value of all the freight we move for our customers.
Customers who would be reliant on their logistics providers for financing might not have
that same need for the long-term, and there isn’t a lot of assurance that even if we tried to
dabble in this for the next couple of years, that we’d be able to retain any of the market
share we picked up solely by “banking” the customer. If a bank won’t bank someone, that’s
a pretty good sign that we might not want to either.
33. Have you observed any changes in the shipment of air cargo since the U.S. government's October
deadline to implement 100% scanning of narrow-body aircraft? Is this a domestic issue or are
their implications for your international business?
The quot;scanningquot; you referenced, quot;100% scanning of narrow-body aircraftquot;, is only a part of
a bigger screening law that is in effect. We have not observed any noticeable changes in the
shipment of air cargo since the U.S. Government's October deadline to implement 100%
scanning of narrow-body aircraft.
However, to your question about whether there are international implications, again, this
narrow body aircraft screening is only a part of the TSA's efforts to achieve the 100%
screening mandate detailed in the Implementing Recommendations of the 9/11 Commission
Act of 2007, 29 U.S. C. 44901 (2007) (the “9/11 Act”). This legislation mandates 100%
screening by August 2010 and requires the TSA to establish a system to “screen” 100% of
cargo transported on passenger aircraft taking off in the United States, to provide a level of
security commensurate with that of passenger baggage, and to meet inspection benchmarks
as they are been defined by Congress. These benchmarks are:
• 100% scanning of narrow-bodied aircraft (that benchmark occurred
October 1, 2008);
• 50% of cargo must be screened not later than 18 months after date of
enactment (that benchmark date occurred February 3, 2009); and
• 100% of cargo must be screened not later than 3 years after date of
enactment (that benchmark date is August 2010)
As you will note, the 50% benchmark date has just passed. Expeditors has been an active
participant in preparing for this deadline to ensure that our customers’ cargo would move
without interruption, and at minimal increased cost. We are screening to the benchmark
requirement in our gateway stations, as well as several other key locations, and will continue
to integrate our other branches in order to achieve the 100% screening benchmark date set
for August 2010.
14. To date Expeditors, as a quot;Certified Cargo Screening Facilityquot;, has not experienced any
interruptions or impact associated with this legislation, other than increased cost. We can
not speak for the industry as a whole, or for others who may not have become quot;certifiedquot; to
screen for their customers.
34. Should we expect Expeditors to participate in the Certified Cargo Screening Program, and should
we think of screening as another pass-through cost similar to fuel surcharges, or a potential profit
center given services provided to the shipping customer?
Yes, Expeditors is an active participant in the Certified Cargo Screening Program (CCSP).
This is a very new activity for us and we are still trying to fully understand that costs we are
absorbing. That may sound like kind of a strange thing to say, but it really isn’t such a
strange idea when framed in a question like “How much does it cost to do something that has
never been done before?”
Finally, to completely answer your question, the CCSP is not a profit center right now. We
are not charging any of our customers a fee for this screening, so these costs are not
currently being passed on. As soon as we fully understand the processes and all their
associated incremental costs, we will be able to have a more well-informed conversation with
our customers. Increased security costs all of us in some way, and because of that, it is
something that we have to educate our customers and our employees about constantly.
35. Longer term, do you expect shippers, forwarders, or airlines to handle the bulk of screening? Is
this an opportunity for Expeditors to take share if smaller forwarders are unable to comply due to
cost?
“Longer term” can be a long time. We think that the carriers will always have to maintain
screening capability. Forwarders will continue to be deeply involved, and in fact, it seems to
us that the forwarder role will expand. As for shippers, while it is possible for shippers to do
their own screening, there are a lot of associated issues that forwarders and airlines don’t
have to deal with…at least not to the same degree. When a shipper does their own
screening, they have to also maintain a secure “chain of custody” over their freight from
factory door to our facility or to the airlines’ facility. Having an outside party (such as
ourselves) handle the screening and security from door to door alleviates the “chain of
custody” issues for them, as when we do it, it is a much more natural function for us to
integrate the security requirements into what we already do, than it is for shippers to create
and monitor a procedure for something that in many cases they do not do.
36. Since when are CEO and CFO and their particular antecessors in office? (How many years are
CEO and CFO as well as the parent CEO+CFO in their position and when did they change?)
Our CEO, Peter Rose, is a founder and has worked for Expeditors since July 1981, and has
been the CEO since 1987. Our current COO, Jordan Gates, started with the Company in
February of 1991 and was our CFO from September 1994 through September 2008. Our
current CFO, Brad Powell, started with the Company in October of 2008.
37. How much revenue (approximately) did the company takeover from the fiscal year 1995
until today and are there bigger positions of acquired sales in the past?
We’re not sure we understand what this question is asking, but we’ll try to answer it as if we
did. We think you want to know how much revenue we had in 1995. The answer to that
question is just less than $584.7 million. We don’t know what “acquired sales” are, but if
you’re asking us if we “bought” any of those revenues by buying other companies, the
answer to that is no. The only companies we acquired were agents with whom we had a long
history of doing business through their representation of our interests in specified
15. geographic areas. In 2008, our revenues were just over $5.6 billion, so we’re roughly 10
times bigger than we were fourteen years ago. We give up though, what’s so significant
about 1995?
38. Expeditors had nearly $750 million in cash on the balance sheet at the end of second quarter
2008. What are your plans for uses of cash in 2009?
We are fond of the old saying “Cash is King” and as our CEO likes to remind
people…having some cash saved up for a rainy day is a smart move…and being in Seattle,
we have a lot of rainy days to reflect upon just what a smart move it is. As for now, our
plans for our cash are the same that they’ve always been: first, look for opportunities to
invest in our business; second, pay a dividend; and last buy back stock as options are
exercised and where market changes in the stock price present buying opportunities that
look favorable given long-term trends. So, for the time being, in this market and the current
conditions, we have no radical “other” uses for our cash. It’s nice to have it. A lot of other
people who overleveraged themselves too much during the past periods of prosperity are a
little concerned at this stage and wish that they had been a little more conservative with their
cash and kept some.
39. Fourth quarter 2008 was the first quarter in several quarters during which Expeditors did not
open any new offices -- be they full service or satellite locations. Why were no office openings this
quarter? Do you expect to open new offices during first quarter 2009 and/or the remainder of the
year considering the economic environment? Are there lucrative new office locations or satellite
offices that can be purchased at a discount, given the difficult financing environment that weaker
hands face?
There were no offices opened in the fourth quarter of 2008 because there weren’t any. Not
because there were any perceived problems of any sort, there just weren’t any offices
scheduled to open.
Yes, in fact we have already opened a couple of offices in 2009…and we will close an office as
well…in Mauritius. Closing Mauritius isn’t something that is a result of the slow economic
times. In retrospect, we should have closed Mauritius down as soon as the U.S. government
abandoned the quota system for imports from various other countries. Mauritius had
developed a great retail factory presence that was largely dependent on taking cloth and
even cut fabric from other locations (like China), doing enough work in Mauritius for the
goods to be qualified to be labeled “Made in Mauritius” for U.S. Customs origin
determination purposes. We’ve spent several years trying to adapt to the local market
“sans” the opportunities available to us in the quota days and determined that we just
couldn’t make Mauritius work like an Expeditors office should work. We were fortunate to
have good management in our Africa region that negotiated an agreement with a local
company to represent our interests in Mauritius and also take our employees on…so we
didn’t have people losing their livelihood and things appear to have turned out to be a
“win/win” for us there.
40. In your fourth quarter 2008 earnings release, you mentioned that new products (like Sea-Air) and
new market vertical opportunities helped drive market share gains. Will you please elaborate with
a few key examples?
Sea-air is a combined service whereby the first leg of a routing goes via ship, even though the
shipment has been treated as an air shipment and moved on a House Airway Bill for
Contract of Carriage purposes. When the vessel reaches the interim gateway port, the
container is off-loaded and the goods in transit are restuffed into or onto an airline ULD’s
(Unit Load Device) depending on space requirements. A ULD is a physical device available
16. from the airlines which forwarders use to build consolidations that take advantage of weight
volume rates and in some instances, cargo is tendered loose in some instances. The goods are
then moved by airfreight to their final destination. This is a very popular service offering, as
it provides a lower cost service that, when working well, is just slightly slower, a couple of
days maybe, than a good deferred airfreight service at a much smaller amount than the
airfreight cost.
We have made very strong progress into the pharmaceutical/healthcare and oil/energy
verticals. We are also gaining solid footholds in the aviation and defense verticals.
41. In the fourth quarter 2008 earnings release you said quot;We increased productivity through on-going
process improvement initiatives; we reduced our exposure where we struggled to make money.quot;
Can you give some examples of both?
Sure, we have ongoing process improvement initiatives designed to drive costs out of our
service delivery processes and create efficiencies for us and our customers. In many ways, it
is kind of our own scaled down version of the famous LEAN system invented and
implemented by Toyota. We like to think of it as six Sigma without all the bovine residue
that can creep in and get spread around when you indiscriminately adopt someone else’s
system and try to fabricate martial art distinctions for non-martial art applications. Our
initiatives are created, measured, monitored and modified where needs be, by our own
people focusing on our own needs in our own way. We do this by borrowing from proven
concepts that we understand, adapting them in a way that they can be effective to our own
unique circumstances. We also cultivate this effort at the “grass roots” level throughout the
Company. We don’t have squads of designated teenage mutant ninja turtle six sigma
experts rolling in and out of offices conducting group gropes for relevancy. Instead we have
people in each of our branches, right down to our most basic functions, who understand the
needs of their branch being schooled in techniques that allow them to work on improving
processes. We feel, and it is consistent with Expeditors culture, that as an organization,
we’re a lot further ahead having every person take one step forward…and understanding
what that step means, than having a group of elite specialists pushing a few people taking
multiple steps into areas they don’t understand, while taking “productivity ground” they
don’t know how to hold once the “specialists” leave. Our field organization continues to
create process improvement benchmarks to challenge our branches, in the spirit of
competition, to improve our efficiency. This works well for us, and we’re sticking it to it.
42. You are armed with a lot of cash and everything seems to be on sale these days. Are there any
long term opportunities that you can take advantage of in this environment? For instance is there
an increased effort to purchase any office buildings, land, or warehouses in key markets if the
price is right?
As we noted in our response to question 38, at this time, “Cash is King”. We have three
priorities with our cash: (1) we find responsible ways to invest it in our business, and we will
continue to do that. If lower costs of capital and lower asset values present buying
opportunities in key markets where we can hold facilities for a long time, we could
potentially do something like that, again, only when it make sense and only where it fits the
operational and financial criteria for a company owned building; (2) we pay a dividend that
we have a history of increasing each year based on the increase in profits; and (3) we buy
back stock.
Having a lot of cash, however, doesn’t mean that we can do foolish things…whatever we
do…our objective is to maximize operating efficiency in order to maximize operating income
without compromising customer service. The interesting thing we have noted is that
productivity improvements benefit our customers as well.
17. 43. Would you please provide a little more color on freight volume trends and the pricing environment
for both air and ocean freight during the fourth quarter? Were there any particular end-markets
that showed areas of strength/weakness during the quarter?
We’ve covered this somewhat in our responses to questions 4 and 5. During the last part of
the fourth quarter, we had a situation where we had both falling airfreight tonnage and
ocean container counts, but had expanding yields as we focused on buying as efficiently as
we could, and taking advantage of spot market opportunities as they presented themselves.
The emergence of an airfreight spot market resulted in our being able to back off our usual
seasonal pricing to customers. However, the spot market buying opportunities, in the latter
part of the quarter, continued to provide yield improvements on a year over year
comparison basis. The one benefit of a dropping market, however, is if you can provide
volume to carriers, they will reward the consistency. The Asian markets perhaps showed the
greatest declines…but in looking at the volume growths over the past couple of years, we
had a pretty strong 2007 to compare with, so we’re not disappointed at all with how we
executed during the 2008 fourth quarter given general market conditions.
44. How would you characterize the relationship between demand and supply currently for both air
and ocean freight? What were the pricing dynamics in the fourth quarter? How did that benefit
air and ocean gross profit margins during the quarter?
We would say that there is less equilibrium from an idle capacity standpoint than we would
have noticed in the first half of 2008. As our financial statements show, the existence of spot
markets on the buy side provided opportunities to drop customer pricing and at the same
time expand our margins somewhat, by being selective in how and from where we purchased
freight space.
45. What are you hearing from the air and ocean carriers regarding capacity reductions in 2009?
From what we hear keeping our proverbial ear to the ground, there will be some continued
capacity reductions, but in a very controlled manner as ocean and air carriers deal with the
new ships coming on-line and the delays in aircraft deliveries. It isn’t to the carriers’
advantage to allow capacity to get too far ahead of demand for freight. As things pick up
seasonally, historically, capacity tightens.
46. Please provide some color on fourth quarter net revenue growth and operating profit margin
dynamics on each of your three key regions (Far East, U.S., and Europe)?
We always try to point out when answering these comparative regional operating questions
about how symbiotic we really are, how no region can stand alone and while we comply with
the SEC’s requirements for segment reporting, it is also important to understand our
internal accounting when looking at any one regional segment in isolation. That said, Asia
had good net revenue growth, nearly 17% with nearly 21% growth in operating income over
the fourth quarter 2007. This was a combination of better buying opportunities, more
favorable freight mix and less intra-office profit share expense being paid to destination
offices as a result of declining freight rates. Yield expansion also resulted from spot market
buying opportunities that developed in the latter half of the 2008 fourth quarter. The U.S.
net revenues were down approximately 3% as inbound profit-share amounts declined based
on the decline in airfreight rates upon which inter-office profit splits are calculated. Europe
was pretty much flat from a net revenue standpoint, largely due to currency translation
issues, while operating income was also flat. We’ve also addressed this in question 56.
47. Could you please describe what opportunities Expeditors’ is seeing across the various freight
lanes (e.g., intra-Asia, Asia-Europe, Asia-U.S.)?
18. Intra-Asia has actually been fairly strong as has Asia to LATAM. Asia-Europe and Asia-
U.S. are both down tonnage from both an airfreight and ocean freight TEU standpoint, but
yields remain strong as well. There have been some bright spots here and there but we’re
really waiting a little longer, at least through the first quarter, before we attempt to take a
meaningful “pulse” as to the strength of the market in general. We remain confident that
there are opportunities out there; we just have to work harder to find them and convert
them.
48. Are you beginning to see any natural attrition of your sales force due to the economic conditions
and slower pace of operating profit growth?
And they would go where? We’re not like Wall Street; no one here has a “Bear Market”
profession to fall back on until the market turns around. Our people are selling harder. We
ask a lot out of our sales force…and it probably wouldn’t surprise you to hear us say that we
think they are collectively the most effective, most business-savvy, most customer-focused
sales group in our industry. Why do we say that? We are very committed to doing business
in a very specific way concerning terms and conditions of trade, payment terms and unitary
profitability over the long-term. We believe that there is a price that comes from great
customer service and system advantages. Our sales people “sell” Expeditors’ way of doing
business as well as Expeditors’ capabilities. They sell those services and capabilities that we
feel set us apart, they aren’t mere “order takers,” they are logistics professionals…and after
they’ve successfully closed the business, they remain actively involved with the account
manager and operations staff to monitor customer service and field queries.
49. You never posted a Q&A 8k filing for third quarter 2008. Do you plan on posting that in the near
future?
We’ve incorporated those answers into this 8-K.
50. If you indeed “cut back on discretionary overhead expenses, like travel and entertainment” then
why did SG&A increase ~5% while revenues declined 10%?
Because, as we’ve noted time and time again in this forum and in our SEC filings, we focus
on net revenue growth as opposed to gross revenue. At the end of the day, net revenue is
what we have to generate to cover our overhead expenses. If you have been reading the 8-
K’s and our other SEC filings, you would have understood this and that would have lead you
to understand the significance of SG&A only being up 5% when net revenue was up 6%...we
can do just fine on that kind of a “∆” (delta—which in algebraic terms means change)
between SG&A expense growth and net revenue growth.
51. Given the overcapacity in ocean freight, were you able to take advantage of low prices? Please
elaborate.
There is not as much overcapacity as one might intuitively think. Carriers, particularly
ocean carriers, have been reducing capacity and while there are more spot market buying
opportunities that always emerge in a slower market, they are not “regular” spot markets
and the carriers are being very careful not to panic and create a price war situation.
52. You mentioned you are focused on new customers. How has your customer mix changed since
people more frequently started using the R-word (last ~12-18months)?
No, not measurably…see the response to question 1 above. Those mixes have been
amazingly consistent over time, albeit we are doing more in ocean.
53. Do your marine insurance products cover piracy?
19. Generally yes, if a customer secures insurance through one of the insurance programs
managed by Expeditors, coverage for piracy is included.
54. Can you elaborate how you managed to have the “best trained employees?” How rigorous is
their training? Are they given performance enhancing-drugs?
We require 52 hours of training annually for each employee. We track that training, we
determine and develop the curriculum, we monitor and give feedback and we perpetuate a
culture of continuing improvement. Employees who aren’t trained can’t keep up with the
requirements of the company, of our customers and of their peers. And NO, they aren’t
given performance enhancing drugs…they don’t actually need them...this is about employee
training, not a baseball homerun contest.
55. Given Expeditors excellent operating results during this difficult period, and despite the fact that
Pete Rose played hockey, do we have to worry about Pete Rose’s name being on any list of people
that tested positive for performance-enhancing drugs?
No, obviously not, but we’re pretty sure that if you and Peter ever had the opportunity to
face off against each other out on the ice it would be more interesting to watch what happens
with the hockey stick than what happens with the puck. We would also observe that from
what appears to be your Freudian fixation on the topic of “performance-enhancing drugs”,
our read is that you might well be the kind of person who would have more than a little
anxiety if your boss were to approach you with a cup and point you to the nearest bathroom.
56. Has the air or ocean yield expansion been greater in January/February than it was in the fourth
quarter? Did either of these trends differ materially on the Asia-to-US lane versus the Asia-to-
Europe lane?
We’re not quite sure about February yet, but January yields were slightly higher than those
experienced in the fourth quarter of 2008. Asia-to-U.S. lanes appear to be much stronger
right now than do the Asia-to-Europe lanes and LATAM from Asia trade continues to show
good growth.
57. Are the capacity reductions among the air and ocean carriers noticeable yet on any of the lanes?
Which trade lanes is the supply/demand most in balance?
Yes, they are evident. Intra-Asia lanes seem to be fairly strong right now and selected lanes
out of India, the Middle East and Latin America are also strong.
58. Were the plant shut downs surrounding the Chinese New Year any longer than normal (i.e., did
the plants shut down before or start up later than is usual)? Any indications from your customers
that factory activity will be picking back up in late February as would typically be expected
following a late-January Chinese New Year?
Chinese New Year came somewhat early this year and because of the way the weekend
fell…actually lasted a little longer…to the point that we essentially had a 3 week January.
We typically wait until we have two full months of activity in January and February before
making any kind of a real assessment as to how Chinese New Year impacted things.
59. What drove the year-over-year contraction in the North America region operating income? Were
there any unusual items that pressured the operating income growth in North America? Similarly,
what drove Far East operating income growth and were there any unusual items that aided Far
East operating income growth?
Inter-office airfreight commissions are reflected as a component of each area’s net revenue.
The inter-office commission is shown as income to the destination offices, and as an expense
20. to the origin offices, but reflected in net revenue all the same, as recorded under their
respective area titles (i.e. United States, Other North America, Asia, etc.) in our business
segment information that is filed in our 10-Q’s and 10-K’s. These inter-office amounts are
backed out in the “Eliminations” column so as to not be included in the consolidated
numbers. Airfreight calculates this commission on what we call “airport to airport” that
includes gross revenue. A flat percentage, usually 5% of this “airport to airport” gross
revenue amount, is accrued as a cost at origin and booked as revenue at destination when the
origin destination services are performed. Because fuel surcharges are considered part of
the overall “airport to airport” gross revenue rates, which 5% commission is calculated on
gross airfreight rates INCLUDING fuel surcharges. As the fuel surcharges came down,
there was less relative expense being recorded at origin and less commission revenue being
accrued at destination on a unitary basis. Since Asia is still very heavily outbound oriented
and North America is very inbound oriented, as surcharges dropped, there was less expense
being accrued in Asia (which increased net revenue) and less revenue being accrued in the
United States and other North American countries, basically Canada and Mexico, (which
decreased net revenue).
60. I just finished reading Warren Buffet’s 2008 letter to the Berkshire Hathaway shareholders. In
that letter he attacked the shortcomings of the Black-Scholes model as an appropriate proxy for
pricing long-term equity put options Having been a major voice urging that the accounting rules
be changed to require a mathematically derived value for employee stock options it struck me that
Mr. Buffet only complains when his ox is being gored. I was also reminded of something I believe
was written in one of your 8-K’s where you took issue with the Black-Scholes model in general
and its application to expensing stock options expense in particular. All of this is long way of
getting to my question. At current stock market valuations, Expeditors must be recording
compensation expense for the value of out of the money employee stock options. I would like to
know how much of the value of employee stock option expense Expeditors recorded during 2008
related to options where the strike price (or grant price if you will) on the options is above the
current trading value of Expeditors’ stock as of the end of the year (2008)? Any other insights you
want to share might also be interesting.
There are several responses in the past where we have pointed out the shortcomings of
expensing stock options and also highlighted flaws we see in the machinations one has to go
through to get there. Possibly the response you remember was the one where we referred to
the Black-Scholes model in its appropriate (our opinion) double-entendre barnyard
vernacular abbreviation “BS” model. We seem to at last have some common ground with
Mr. Buffet on this topic.
Last year, 2008, Expeditors recorded $44.9 million in compensation expense for the value of
outstanding and unvested employee stock options. Of that amount, $24.9 million (or about
55%) related to stock options which were granted but for which the grant price was more
than the current stock price. For the fourth quarter of 2008, we recorded $10.8 million in
total stock option related compensation expense, of which $6.6 million was for options that
were “under water”…that was just over 61%. There are still 7 years to go before these
options expire. All options granted before May 2006 are still in the money but this may be
unique to Expeditors, since the market in general is trading at 10 to 12 year lows. To answer
your original question, many companies are likely amortizing stock options which will expire
having no value…after all that expense. We have no desire to be one of these companies.
Back in the days when Mr. Buffet was leading the charge for the expensing of stock options
he wrote such things as “…it is both silly and cynical to say that an important item of cost
should not be recognized simply because it can’t be quantified with pinpoint precision.
Right now accounting abounds with imprecision” and “Does this mean that these important
items of cost should be ignored simply because they can’t be quantified with absolute
accuracy? Of course not. Rather these costs should be estimated by honest and experienced
people and then recorded.” He sounds a different note when the shoe is on the other foot.
21. Mr. Buffet’s main axe to grind with stock options came from a distaste at having his position
as a stockholder being diluted by grants of options to employees in the days when the stock
market was seemingly going up and up, almost effortlessly. Mr. Buffet felt that employees
were being overly rewarded and sought to have this reward recorded not on the books of the
shareholders but of the companies. He was more than willing to accept the BS model
together with its flaws in furtherance of his aims.
Granted there were more than a few egregious option granting practices going on, but not
by everyone, and not to the point where everyone who owns an option should be ashamed of
what they received. Perhaps our shareholders did not understand what they were doing as
they voted for our option grants, but we prefer to think that they made very shrewd
investments in the future prosperity of their investment. We also believe that that is why our
shareholders continue to support and ratify our annual employee option plans. In any event,
this battle is over and perhaps we should all just move on. The alternative is certainly
unbecoming – that much is clear.
61. Associated Press picked up a XXX analyst’s downgrade of Expeditors back in mid December.
Management was faulted by the analyst “for striking” a “business-as- usual” tone and “failing to
lower expectations” ‘in the face of an obvious economic meltdown.’” Did you see this report and
will you comment on his comments? We assume the “business-as-usual” comments refer to
management’s decision to ban the “R” word. Does management feel that they should
acknowledge that we are in tough economic times by allowing people to say the “R” word?
Yes, someone did call our attention to the report you reference. Since we never actually saw
the analyst’s report, we want to make sure that everyone understands that our comments
are directed at the AP report of what the analyst said and not what the analyst may have
actually written. We don’t recall too much fact finding interaction with this analyst and
believe that it would be a cheap shot to say that given recent publicity regarding XXX we are
reminded of the story about rocks and glass houses. We have been in a dust up with a big
brokerage house before and, although that firm is no longer functional, we probably took as
many shots as we delivered. Therefore, let us repeat that we have no problem with analyst’s
opinions even when they are just plain wrong. Once anyone forms an opinion and publishes
it, what are we supposed to do? We don’t give guidance unless almost everybody (the
consensus) is really off the mark. Every analyst who really follows us knows this. When we
saw this AP report, our internal operating results were broadly tracking with consensus
expectations. We are not going to react to a lone voice and tell everyone we were tracking
consensus. One person cannot declare “an obvious economic meltdown” and get a comment
one way or the other from us. That incorrect opinion is just averaged into the developing
consensus estimate. We appropriately said nothing, and still stick by that being the best
course of action.
As for banning the “R” word, our rebuttal to that is simple. So much of what is going on
now is psychological. Our banning the “R” word was always an internal directive meant to
inspire us to work harder at that micro-economic model level that we can control. It was
never meant to be reflected outward in the form of a macro-economic statement of our
opinion on market conditions in general. We are confident that nobody cares what we may
think about macro economic conditions. That said, it might be easier for those of us not on
Wall Street to be more optimistic than those who are on Wall Street. After all, Bernie
quot;Made-off with your money,quot; never made off with any of ours.
In the 1920’s, there was a great Finnish long-distance runner named Paavo Nurmi, a.k.a
“The Flying Finn.” Nurmi won nine Olympic Gold Medals and was the premier runner of
his day. He was such a dominant competitor in his day that his training methods were
scrutinized and officially investigated on allegations made by jealous competitors. He was
exonerated, of course, but he did have a unique training method. He explained that he
22. trained his mind to believe that he was running each successive lap around the track at a
faster rate of speed than he had run the lap before. By learning how to train his mind, he
actually elevated the performance of his body…setting world record after world record (as
well as winning the nine Gold medals) and being called by some “the greatest runner of all
time.” Nurmi’s famous quote is:
“Mind is everything; muscles, mere pieces of rubber. All that I am, I am because of my mind.quot;
.
We agree and that is why we don’t use the ‘R’ word around here.