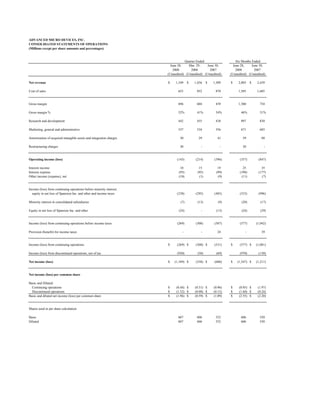
1. ADVANCED MICRO DEVICES, INC.
CONSOLIDATED STATEMENTS OF OPERATIONS
(Millions except per share amounts and percentages)
Quarter Ended Six Months Ended
June 28, Mar. 29, June 30, June 28, June 30,
2008 2008 2007 2008 2007
(Unaudited) (Unaudited) (Unaudited) (Unaudited) (Unaudited)
Net revenue $ 1,349 $ 1,456 $ 1,309 $ 2,805 $ 2,439
Cost of sales 653 852 870 1,505 1,685
Gross margin 696 604 439 1,300 754
Gross margin % 52% 41% 34% 46% 31%
Research and development 442 455 438 897 830
Marketing, general and administrative 337 334 356 671 683
Amortization of acquired intangible assets and integration charges 30 29 41 59 88
Restructuring charges 30 - - 30 -
Operating income (loss) (143) (214) (396) (357) (847)
Interest income 10 15 19 25 35
Interest expense (95) (95) (99) (190) (177)
Other income (expense), net (10) (1) (9) (11) (7)
Income (loss) from continuing operations before minority interest,
equity in net loss of Spansion Inc. and other and income taxes (238) (295) (485) (533) (996)
Minority interest in consolidated subsidiaries (7) (13) (9) (20) (17)
Equity in net loss of Spansion Inc. and other (24) - (13) (24) (29)
Income (loss) from continuing operations before income taxes (269) (308) (507) (577) (1,042)
Provision (benefit) for income taxes - - 24 - 39
Income (loss) from continuing operations $ (269) $ (308) $ (531) $ (577) $ (1,081)
Income (loss) from discontinued operations, net of tax (920) (50) (69) (970) (130)
Net income (loss) $ (1,189) $ (358) $ (600) $ (1,547) $ (1,211)
Net income (loss) per common share
Basic and Diluted:
Continuing operations $ (0.44) $ (0.51) $ (0.96) $ (0.95) $ (1.97)
Discontinued operations $ (1.52) $ (0.08) $ (0.13) $ (1.60) $ (0.24)
Basic and diluted net income (loss) per common share $ (1.96) $ (0.59) $ (1.09) $ (2.55) $ (2.20)
Shares used in per share calculation
Basic 607 606 552 606 550
Diluted 607 606 552 606 550
2. ADVANCED MICRO DEVICES, INC.
CONSOLIDATED BALANCE SHEETS
(Millions)
June 28, Dec. 29,
2008 2007*
(Unaudited)
Assets
Current assets:
Cash, cash equivalents and marketable securities $ 1,567 $ 1,889
Accounts receivable, net 437 588
Inventories 791 802
Prepaid expenses and other current assets 244 395
Deferred income taxes 20 64
Assets of discontinued operations 372 1,323
Total current assets 3,431 5,061
Property, plant and equipment, net 4,599 4,708
Goodwill 945 950
Acquisition related intangible assets, net 253 311
Other assets 556 520
Total Assets $ 9,784 $ 11,550
Liabilities and Stockholders' Equity
Current liabilities:
Accounts payable $ 800 $ 982
Accrued compensation and benefits 160 180
Accrued liabilities 730 814
Deferred income on shipments to distributors 80 98
Current portion of long-term debt and capital lease obligations 246 238
Other short-term obligations 60 -
Other current liabilities 369 270
Liabilities of discontinued operations 23 43
Total current liabilities 2,468 2,625
Deferred income taxes 3 6
Long-term debt and capital lease obligations, less current portion 4,955 5,031
Other long-term liabilities 695 633
Minority interest in consolidated subsidiaries 189 265
Stockholders' equity:
Capital stock:
Common stock, par value 6 6
Capital in excess of par value 5,962 5,921
Retained earnings (deficit) (4,647) (3,100)
Accumulated other comprehensive income 153 163
Total stockholders' equity 1,474 2,990
Total Liabilities and Stockholders' Equity $ 9,784 $ 11,550
* Amounts for the year ended December 29, 2007 were derived from the December 29, 2007 audited financial statements adjusted for discontinued
operations.
3. ADVANCED MICRO DEVICES, INC.
SELECTED CORPORATE DATA (1)
(Unaudited)
(Millions except headcount and percentages)
Quarter Ended Six Months Ended
June 28, Mar. 29, June 30, June 28, June 30,
Segment Information from Continuing Operations 2008 2008 2007 2008 2007
Computing Solutions (2)
Net revenue $ 1,101 $ 1,194 $ 1,098 $ 2,295 $ 2,017
Operating income (loss) $ (9) $ (164) $ (269) $ (173) $ (600)
Graphics (3)
Net revenue 248 262 211 510 422
Operating income (loss) (38) 13 (39) (25) (65)
All Other (4)
Net revenue - - - - -
Operating income (loss) (96) (63) (88) (159) (182)
Total from Continuing Operations
Net revenue $ 1,349 $ 1,456 $ 1,309 $ 2,805 $ 2,439
Operating income (loss) $ (143) $ (214) $ (396) $ (357) $ (847)
Revenue Reconciliation
Revenue from continuing operations $ 1,349 $ 1,456 $ 1,309 $ 2,805 $ 2,439
Revenue from discontinued operations 37 49 69 86 172
Total revenue $ 1,386 $ 1,505 $ 1,378 $ 2,891 $ 2,611
Components of Discontinued Operations
Operating loss $ (42) $ (50) $ (69) $ (92) $ (130)
Impairment of goodwill and acquired intangible assets (876) - - (876) -
Restructuring charges (2) - - (2) -
Total loss from discontinued operations $ (920) $ (50) $ (69) $ (970) $ (130)
Other Data
Depreciation & amortization
(excluding amortization of acquired intangible assets) $ 263 $ 265 $ 253 $ 528 $ 494
Capital additions $ 104 $ 322 $ 414 $ 426 $ 1,000
Adjusted EBITDA (5) $ 119 $ 81 $ (121) $ 200 $ (303)
Headcount 15,653 16,398 16,719 15,653 16,719
(1) Comparative amounts adjusted for discontinued operations except for headcount data.
(2) Computing Solutions segment includes microprocessors, chipsets and embedded processors. For the quarter ended and six months ended June 28, 2008, the operating loss includes a $193M gain on the sale of 200 mm equipment.
(3) Graphics segment includes graphics, video and multimedia products developed for use in desktop and notebook computers, including home media PCs, professional workstations and servers. Starting in the quarter ended June 28, 2008 this segment also includes
royalties received in connection with the sale of game console systems that incorporate the Company’s graphics technology. Prior periods have been recast.
(4) All Other category includes employee stock-based compensation expense and certain operating expenses and credits that are not allocated to the operating segments. Also included in this category are the restructuring, severance and ATI acquisition-related
charges. Details of the restructuring, severance and ATI acquisition-related charges and employee stock-based compensation expense are shown below.
Restructuring, severance, and ATI acquisition-related charges: Employee stock-based compensation expense:
Quarter Ended Six Months Ended Quarter Ended Six Months Ended
Q208 Q108 Q207 Q208 Q207 Q208 Q108 Q207 Q208 Q207
Restructuring charges Cost of sales
$ 30 $ - $ - $ 30 $ - $ 3$ 3$ 2 $ 6$ 5
Severance charges - - 16 - 16 Research and development 8 15 13 23 26
Subtotal $ 30 $ - $ 16 $ 30 $ 16 Marketing, general and administrative 6 2 14 8 25
$ 17 $ 20 $ 29 $ 37 $ 56
Amortization of acquired intangible assets 30 29 34 59 68
Integration charges - - 7 - 20
Total amortization of aquired intangibles and integration charges $ 30 $ 29 $ 41 $ 59 $ 88
Cost of fair value adjustment of acquired inventory - - - - 18
ATI acquisition-related charges $ 30 $ 29 $ 41 $ 59 $ 106
Restructuring, severance, and ATI acquisition-related charges $ 60 $ 29 $ 57 $ 89 $ 122
(5) Reconciliation of income (loss) from continuing operations to Adjusted EBITDA*
Quarter Ended Six Months Ended
Q208 Q108 Q207 Q208 Q207
Income (loss) from continuing operations $ (269) $ (308) $ (531) $ (577) $ (1,081)
Depreciation and amortization 263 265 253 528 494
Amortization of acquired intangible assets 30 29 34 59 68
Interest expense 95 95 99 190 177
Provision (benefit) for income taxes - - 24 - 39
Adjusted EBITDA $ 119 $ 81 $ (121) $ 200 $ (303)
*
The Company defines Adjusted EBITDA as income (loss) from continuing operations adjusted for depreciation and amortization, amortization of acquired intangible assets, interest expense and taxes. The Company calculates and communicates Adjusted EBITDA because management
believes it is of interest to investors and lenders in relation to its overall capital structure and its ability to borrow additional funds. The Company’s calculation of Adjusted EBITDA may or may not be consistent with the calculation of this measure by other companies in the same industry.
Investors should not view Adjusted EBITDA as an alternative to the U.S. GAAP operating measure of net income or U.S. GAAP liquidity measures of cash flows from operating, investing and financing activities. In addition, Adjusted EBITDA does not take into account changes in certain
assets and liabilities as well as interest and income taxes that can affect cash flows.