Weitere ähnliche Inhalte
Ähnlich wie MGM MIRAGE ProForma
Ähnlich wie MGM MIRAGE ProForma (20)
Kürzlich hochgeladen (20)
MGM MIRAGE ProForma
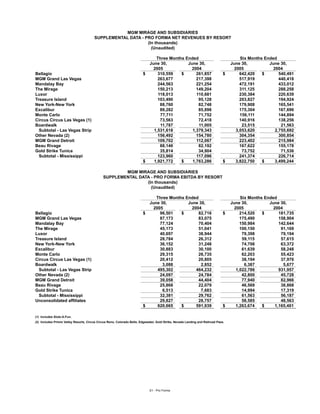
- 1. MGM MIRAGE AND SUBSIDIARIES
SUPPLEMENTAL DATA - PRO FORMA NET REVENUES BY RESORT
(In thousands)
(Unaudited)
Three Months Ended Six Months Ended
June 30, June 30, June 30, June 30,
2005 2004 2005 2004
Bellagio $ 310,559 $ 261,857 $ 642,420 $ 540,491
MGM Grand Las Vegas 263,677 217,398 517,919 440,418
Mandalay Bay 244,563 221,254 472,191 433,012
The Mirage 150,213 149,204 311,125 288,258
Luxor 118,013 110,681 230,384 220,639
Treasure Island 103,490 95,128 203,827 194,924
New York-New York 88,760 82,748 179,908 165,541
Excalibur 89,282 85,898 175,304 167,696
Monte Carlo 77,711 71,752 156,111 144,894
Circus Circus Las Vegas (1) 73,563 72,418 140,916 138,256
Boardwalk 11,787 11,005 23,515 21,563
Subtotal - Las Vegas Strip 1,531,618 1,379,343 3,053,620 2,755,692
Other Nevada (2) 156,492 154,780 304,354 300,854
MGM Grand Detroit 109,702 112,067 223,402 215,984
Beau Rivage 88,146 82,192 167,622 155,178
Gold Strike Tunica 35,814 34,904 73,752 71,536
Subtotal - Mississippi 123,960 117,096 241,374 226,714
$ 1,921,772 $ 1,763,286 $ 3,822,750 $ 3,499,244
MGM MIRAGE AND SUBSIDIARIES
SUPPLEMENTAL DATA - PRO FORMA EBITDA BY RESORT
(In thousands)
(Unaudited)
Three Months Ended Six Months Ended
June 30, June 30, June 30, June 30,
2005 2004 2005 2004
Bellagio $ 96,501 $ 82,716 $ 214,520 $ 181,735
MGM Grand Las Vegas 87,173 83,075 175,490 158,904
Mandalay Bay 77,124 70,404 150,984 142,644
The Mirage 45,173 51,041 100,150 91,169
Luxor 40,697 38,944 79,398 79,194
Treasure Island 28,784 26,312 59,115 57,615
New York-New York 36,152 31,248 74,706 63,372
Excalibur 30,883 30,100 61,639 58,248
Monte Carlo 29,315 26,735 62,203 55,423
Circus Circus Las Vegas (1) 20,412 20,805 38,194 37,976
Boardwalk 3,088 2,852 6,387 5,677
Subtotal - Las Vegas Strip 495,302 464,232 1,022,786 931,957
Other Nevada (2) 24,097 24,784 42,800 45,728
MGM Grand Detroit 39,058 44,404 77,940 82,966
Beau Rivage 25,868 22,079 46,569 38,868
Gold Strike Tunica 6,513 7,683 14,994 17,319
Subtotal - Mississippi 32,381 29,762 61,563 56,187
Unconsolidated affiliates 29,827 28,757 58,585 48,563
$ 620,665 $ 591,939 $ 1,263,674 $ 1,165,401
(1) Includes Slots-A-Fun.
(2) Includes Primm Valley Resorts, Circus Circus Reno, Colorado Belle, Edgewater, Gold Strike, Nevada Landing and Railroad Pass.
S1 - Pro Forma
- 2. MGM MIRAGE AND SUBSIDIARIES
SUPPLEMENTAL DATA - PRO FORMA RECONCILIATION OF OPERATING INCOME TO EBITDA
(In thousands)
(Unaudited)
Three Months Ended June 30, 2005
Depreciation Preopening and
Operating and start-up Restructuring Property
income amortization expenses costs (credit) transactions, net EBITDA
Bellagio $ 61,321 $ 35,175 $ - $ - $ 5 $ 96,501
MGM Grand Las Vegas 58,470 27,143 500 - 1,060 87,173
Mandalay Bay 57,078 20,053 - (7) - 77,124
The Mirage 32,435 11,965 83 - 690 45,173
Luxor 32,697 7,852 - - 148 40,697
Treasure Island 20,974 7,810 - - - 28,784
New York-New York 27,573 8,579 - - - 36,152
Excalibur 26,822 4,058 - 2 1 30,883
Monte Carlo 24,985 4,410 - (5) (75) 29,315
Circus Circus Las Vegas (1) 15,461 4,965 - - (14) 20,412
Boardwalk 2,427 661 - - - 3,088
Subtotal - Las Vegas Strip 360,243 132,671 583 (10) 1,815 495,302
Other Nevada (2) 13,764 10,332 - - 1 24,097
MGM Grand Detroit 32,359 6,397 - - 302 39,058
Beau Rivage 20,339 5,491 62 - (24) 25,868
Gold Strike Tunica 4,065 2,475 - (24) (3) 6,513
Subtotal - Mississippi 24,404 7,966 62 (24) (27) 32,381
Unconsolidated affiliates 27,489 - 2,338 - - 29,827
$ 458,259 $ 157,366 $ 2,983 $ (34) $ 2,091 $ 620,665
Three Months Ended June 30, 2004
Depreciation Preopening and
Operating and start-up Restructuring Property
income amortization expenses costs transactions, net EBITDA
Bellagio $ 58,232 $ 22,004 $ - $ 3,000 $ (520) $ 82,716
MGM Grand Las Vegas 55,752 22,170 1,501 900 2,752 83,075
Mandalay Bay 52,057 18,311 - - 36 70,404
The Mirage 38,149 12,903 - - (11) 51,041
Luxor 31,241 7,752 - - (49) 38,944
Treasure Island 17,312 8,886 118 - (4) 26,312
New York-New York 23,192 8,011 - - 45 31,248
Excalibur 25,963 4,114 - - 23 30,100
Monte Carlo 23,090 3,645 - - - 26,735
Circus Circus Las Vegas (1) 15,981 4,880 - - (56) 20,805
Boardwalk 2,683 169 - - - 2,852
Subtotal - Las Vegas Strip 343,652 112,845 1,619 3,900 2,216 464,232
Other Nevada (2) 13,944 10,314 - - 526 24,784
MGM Grand Detroit 37,074 7,373 - - (43) 44,404
Beau Rivage 16,669 5,242 - - 168 22,079
Gold Strike Tunica 5,436 2,247 - - - 7,683
Subtotal - Mississippi 22,105 7,489 - - 168 29,762
Unconsolidated affiliates 28,757 - - - - 28,757
$ 445,532 $ 138,021 $ 1,619 $ 3,900 $ 2,867 $ 591,939
(1) Includes Slots-A-Fun.
(2) Includes Primm Valley Resorts, Circus Circus Reno, Colorado Belle, Edgewater, Gold Strike, Nevada Landing and Railroad Pass.
S2 - Pro Forma
- 3. MGM MIRAGE AND SUBSIDIARIES
SUPPLEMENTAL DATA - PRO FORMA RECONCILIATION OF OPERATING INCOME TO EBITDA
(In thousands)
(Unaudited)
Six Months Ended June 30, 2005
Depreciation Preopening and
Operating and start-up Restructuring Property
income amortization expenses costs (credit) transactions, net EBITDA
Bellagio $ 146,496 $ 66,618 $ 665 $ - $ 741 $ 214,520
MGM Grand Las Vegas 118,652 52,339 2,109 - 2,390 175,490
Mandalay Bay 109,043 41,074 - (7) 874 150,984
The Mirage 73,108 24,498 145 - 2,399 100,150
Luxor 63,546 15,318 - - 534 79,398
Treasure Island 43,306 15,810 - - (1) 59,115
New York-New York 57,518 17,188 - - - 74,706
Excalibur 53,750 7,891 - 2 (4) 61,639
Monte Carlo 53,629 8,654 - (5) (75) 62,203
Circus Circus Las Vegas (1) 28,557 9,651 - - (14) 38,194
Boardwalk 5,355 1,032 - - - 6,387
Subtotal - Las Vegas Strip 752,960 260,073 2,919 (10) 6,844 1,022,786
Other Nevada (2) 22,241 20,612 - - (53) 42,800
MGM Grand Detroit 64,224 13,412 - - 304 77,940
Beau Rivage 35,647 10,804 75 - 43 46,569
Gold Strike Tunica 10,188 4,833 - (24) (3) 14,994
Subtotal - Mississippi 45,835 15,637 75 (24) 40 61,563
Unconsolidated affiliates 56,178 - 2,407 - - 58,585
$ 941,438 $ 309,734 $ 5,401 $ (34) $ 7,135 $ 1,263,674
Six Months Ended June 30, 2004
Depreciation Preopening and
Operating and start-up Restructuring Property
income amortization expenses costs transactions, net EBITDA
Bellagio $ 135,323 $ 42,356 $ - $ 3,000 $ 1,056 $ 181,735
MGM Grand Las Vegas 107,729 45,688 1,839 900 2,748 158,904
Mandalay Bay 100,541 41,770 142 - 191 142,644
The Mirage 65,560 25,560 - - 49 91,169
Luxor 63,945 15,323 - - (74) 79,194
Treasure Island 39,963 17,546 118 - (12) 57,615
New York-New York 47,949 15,464 (86) - 45 63,372
Excalibur 49,887 8,294 - - 67 58,248
Monte Carlo 48,413 7,010 - - - 55,423
Circus Circus Las Vegas (1) 28,143 9,706 - - 127 37,976
Boardwalk 5,339 338 - - - 5,677
Subtotal - Las Vegas Strip 692,792 229,055 2,013 3,900 4,197 931,957
Other Nevada (2) 25,962 19,356 - - 410 45,728
MGM Grand Detroit 67,773 14,847 - - 346 82,966
Beau Rivage 28,343 10,546 - - (21) 38,868
Gold Strike Tunica 12,881 4,449 - - (11) 17,319
Subtotal - Mississippi 41,224 14,995 - - (32) 56,187
Unconsolidated affiliates 48,563 - - - - 48,563
$ 876,314 $ 278,253 $ 2,013 $ 3,900 $ 4,921 $ 1,165,401
(1) Includes Slots-A-Fun.
(2) Includes Primm Valley Resorts, Circus Circus Reno, Colorado Belle, Edgewater, Gold Strike, Nevada Landing and Railroad Pass.
S3 - Pro Forma
- 4. MGM MIRAGE AND SUBSIDIARIES
SUPPLEMENTAL DATA - PRO FORMA HOTEL STATISTICS
(Unaudited)
Three Months Ended Six Months Ended
June 30, June 30, June 30, June 30,
2005 2004 2005 2004
Bellagio
Occupancy % 96.7% 96.4% 96.4% 95.9%
Average daily rate (ADR) $245 $240 $246 $247
Revenue per available room (REVPAR) $237 $231 $237 $237
MGM Grand Las Vegas
Occupancy % 95.3% 95.0% 95.2% 93.6%
ADR $155 $131 $157 $135
REVPAR $148 $124 $150 $126
Mandalay Bay
Occupancy % 90.9% 88.9% 88.3% 86.9%
ADR $221 $206 $228 $210
REVPAR $201 $183 $201 $182
The Mirage
Occupancy % 98.8% 98.6% 98.4% 96.4%
ADR $168 $150 $169 $153
REVPAR $166 $148 $167 $148
Luxor
Occupancy % 96.5% 92.9% 93.8% 91.7%
ADR $120 $112 $125 $117
REVPAR $116 $104 $117 $107
Treasure Island
Occupancy % 99.0% 99.0% 98.6% 97.8%
ADR $131 $115 $134 $119
REVPAR $130 $113 $132 $116
New York-New York
Occupancy % 99.4% 98.6% 99.3% 98.0%
ADR $135 $116 $137 $118
REVPAR $134 $115 $136 $115
Excalibur
Occupancy % 97.2% 96.6% 93.7% 93.9%
ADR $93 $85 $97 $87
REVPAR $90 $82 $91 $82
Monte Carlo
Occupancy % 97.4% 96.1% 95.9% 94.8%
ADR $131 $122 $134 $123
REVPAR $127 $118 $129 $117
Circus Circus Las Vegas (1)
Occupancy % 96.6% 93.0% 92.8% 91.4%
ADR $66 $62 $67 $62
REVPAR $64 $58 $63 $57
Boardwalk
Occupancy % 98.8% 96.1% 95.2% 91.3%
ADR $79 $67 $82 $71
REVPAR $78 $64 $78 $65
Other Nevada (2)
Occupancy % 70.5% 76.1% 70.6% 75.3%
ADR $42 $40 $40 $37
REVPAR $30 $30 $28 $28
Beau Rivage
Occupancy % 93.5% 94.9% 91.4% 90.5%
ADR $108 $98 $103 $95
REVPAR $101 $93 $95 $86
Gold Strike Tunica
Occupancy % 80.1% 84.0% 81.4% 83.9%
ADR $55 $49 $54 $49
REVPAR $44 $42 $44 $41
(1) Includes Slots-A-Fun.
(2) Includes Primm Valley Resorts, Circus Circus Reno, Colorado Belle, Edgewater, Gold Strike, Nevada Landing and Railroad Pass.
S4 - Pro Forma