SlideShare ist ein Scribd-Unternehmen logo
1 von 4
Downloaden Sie, um offline zu lesen
Danaher Corporation
Summary of Selling, General and Administrative Costs (SG&A)
and Operating Profit Excluding the Impact of Special Credits
31-Dec-03
(in $ 000's)
(Unaudited)

                                                                          Quarter Ended                         Year Ended
                                                                       31-Dec-03      31-Dec-02             31-Dec-03      31-Dec-02
Total Company:

Total Company Revenue                                                 1,488,778         1,274,978           5,293,876         4,577,232

SG&A Before Special Credits                                             364,670           305,872           1,316,357         1,097,365
Special Credits:
(Gain) Loss on Sales of Real Estate                                          83              (952)               (785)           (6,157)
SG&A as Reported under GAAP                                             364,753           304,920           1,315,572         1,091,208

SG&A Before Special Credits as a % of Revenue                              24.5%            24.0%                24.9%              24.0%
SG&A as Reported under GAAP as a % of Revenue                              24.5%            23.9%                24.9%              23.8%

Operating Profit Before Special Credits                                 239,609           199,671             822,710             688,692
Special Credits:
Gain (Loss) on Sales of Real Estate                                         (83)              952                 785               6,157
Adjustment of Restructuring Accruals                                        -               6,273                 -                 6,273
Pension Curtailment Gain                                                 22,500               -                22,500                 -
Operating Profit as Reported under GAAP                                 262,026           206,896             845,995             701,122

Operating Profit Before Special Credits as a % of Revenue                  16.1%            15.7%                15.5%              15.0%
Operating Profit as Reported under GAAP as a % of Revenue                  17.6%            16.2%                16.0%              15.3%

Process/Environmental Controls Segment:

Segment Revenue                                                       1,149,957           967,176           4,096,686         3,385,154

Operating Profit Before Special Credits                                 199,469           157,196             674,333             529,595
Special Credits:
Gain (Loss) on Sales of Real Estate                                         (83)              952                   10              6,157
Adjustment of Restructuring Accruals                                        -               4,705                 -                 4,705
Operating Profit as Reported under GAAP                                 199,386           162,853             674,343             540,457

Operating Profit Before Special Credits as a % of Revenue                  17.3%            16.3%                16.5%              15.6%
Operating Profit as Reported under GAAP as a % of Revenue                  17.3%            16.8%                16.5%              16.0%

Tools and Components Segment:

Segment Revenue                                                         338,821           307,802           1,197,190         1,192,078

Operating Profit Before Special Credits                                   47,017           47,837             173,046             179,791
Special Credits:
Gain (Loss) on Sales of Real Estate                                          -                -                   775                 -
Adjustment of Restructuring Accruals                                         -              1,568                 -                 1,568
Operating Profit as Reported under GAAP                                   47,017           49,405             173,821             181,359

Operating Profit Before Special Credits as a % of Revenue                  13.9%            15.5%                14.5%              15.1%
Operating Profit as Reported under GAAP as a % of Revenue                  13.9%            16.1%                14.5%              15.2%


   Note: The Company believes the above measures of SG&A and Operating Profit before the effect of special credits give the
   reader of the financial statements additional information about the cost structure of the business and results of operations
   without the benefit from these non-recurring items. The reader should also evaluate the Company's performance as reported
   under traditional measures presented under Generally Accepted Accounting Principals (GAAP) including operating profit and
   net income.
Danaher Corporation
Supplemental Financial Information
31-Dec-03


                                          Quarter Ended                Quarter Ended                  Quarter Ended                  Quarter Ended
Free Cash Flows ($ in 000's):                                                                                                                                          Year Ended                   Year Ended
                                       28-Mar-03    29-Mar-02       27-Jun-03      28-Jun-02       26-Sep-03      27-Sep-02       31-Dec-03    31-Dec-02           31-Dec-03      31-Dec-02   31-Dec-01     31-Dec-00

Operating Cash Flows               $    214,336 $    263,247    $    234,912 $      130,199    $    170,111 $      171,983    $    242,185 $     144,918       $    861,544 $      710,347    $ 608,471 $    512,245

Payments for Property, Plant &
Equipment (Capital Expenditures)   $    (15,617) $   (12,923)   $    (22,004) $     (15,318)   $    (16,439) $     (16,712)   $    (26,283) $    (20,477)      $    (80,343) $     (65,430)     (84,457)    (103,718)

Free Cash Flow                     $    198,719 $    250,324    $    212,908 $      114,881    $    153,672 $      155,271    $    215,902 $     124,441       $    781,201 $      644,917    $ 524,014 $    408,527


              NOTE: Free cash flow is defined as operating cash flow less purchases of                                        Ratio of Free Cash Flow to Net Earnings:
              property, plant and equipment. Management believes that free cash flow
              provides useful information to investors regarding the Company's ability to                                     Free Cash Flow from Above        $    781,201
              generate cash without external financings. Management uses free cash flow to
              help gauge the resources available for strategic opportunities such as making                                   Net Earnings                          536,834
              acquisitions, investing in the business and strengthening the Company's
              balance sheet, and uses this measure in making operating decisions, allocating                                  Free Cash Flow to Net Earnings             146%
              financial resources and for budget planning purposes. Free cash flow does not,
              however, take into account the Company's debt service requirements and other
              non-discretionary expenditures and therefore is not necessarily indicative of
              amounts of cash that may be available for discretionary uses. Free cash flow
              should be considered in addition to, and not in lieu of, cash flow from
              operations, net earnings and other measures of financial performance prepared
              in accordance with GAAP.
Danaher Corporation
Supplemental Financial Information
31-Dec-03


                                                                                                              Pro forma    Pro Forma 12-
                                                                                                            Adjustmemt to     31-2003
                                                                                                                Reflect    Adjusted for the
                                                                                                             Purchase of    Purchase of
Debt to Total Capital and Net Debt                                                                          Radiometer and Radiometer and
                                                                                                             Gendex (A)        Gendex
to Total Capital Ratios ($ in 000's):                                        Actual Balance As Of:
                                                                             31-Dec-03       31-Dec-02

Notes Payable and Current Portion of
Long-term Debt                                                         $       14,385 $        112,542      $          -     $      14,385
Long-term Debt                                                              1,284,498        1,197,422                 -     $   1,284,498
   Total debt                                                               1,298,883        1,309,964                 -     $   1,298,883
Total Stockholders' Equity                                                  3,646,709        3,009,599                 -     $   3,646,709
   Total Capital                                                       $    4,945,592 $      4,319,563      $          -     $   4,945,592

Debt to Total Capital Ratio                                                      26.3%           30.3%                               26.3%

Total Debt                                                             $     1,298,883 $     1,309,964      $          -     $   1,298,883
Less: Cash and Cash Equivalents                                             (1,230,156)       (810,463)            875,000   $    (355,156)
Net Debt                                                                        68,727         499,501                 -     $     943,727
Total Capital                                                          $     4,945,592 $     4,319,563      $          -     $   4,945,592

Net Debt to Total Capital Ratio                                                   1.4%           11.6%                               19.1%


             NOTE: Debt to Total Capital is defined as the ratio of Total Debt (including notes
             payable, current portion of long-term debt and long-term debt) to Total Capital
             (the sum of Total Debt and Stockholders’ Equity). Net Debt to Total Capital is
             defined as the ratio of Total Debt less Cash and Cash Equivalents to Total
             Capital. Management believes these ratios provide useful information to
             investors regarding the Company's debt leverage in relation to the size of its
             available capital base and existing cash resources. Management uses these
             ratios to evaluate the Company’s leverage over time to help determine the ability
             of the Company to access additional borrowing capacity. These ratios do not
             however necessarily indicate the ability of the Company to satisfy the debt
             service requirements in existing or future debt agreements. These ratios should
             be considered in addition to, and not in lieu of, other measures of liquidity
             including working capital prepared in accordance with GAAP.

(A) Reflects the use subsequent to December 31, 2003 of approximately $875 million for the purchase of Radiometer Medical
S/A and the purchase of the assets and certain liabilities of the Gendex division of Dentsply.
DANAHER CORPORATION AND SUBSIDIARIES
   SUPPLEMENTAL INCOME STATEMENT DATA
   (in thousands, except per share amounts)

                                                                   Quarter Ended              Year Ended

                                                             12/31/03        12/31/02       12/31/03         12/31/02

Net earnings before unusual items                           $ 155,377        $ 124,443      $ 521,675       $ 426,061
   Pension curtailment gain, net of tax                        14,625                --        14,625               --
   Gains (losses) on sale of real estate, net of tax             (56)              609            534           3,940
   Effect of lower tax rate on prior quarters (A)                   --           2,520              --              --
   After-tax impact of restructuring charge                         --           4,140              --          4,140
   Reduction of tax reserves related to previously
   discontinued operation                                               --      30,000                 --      30,000
   Effect of accounting change, net of tax, SFAS 142                    --           --                --    (173,750)

Net earnings                                                $ 169,946        $ 161,712      $ 536,834       $ 290,391


Diluted net earnings per share before unusual items               $0.97            $0.79         $3.28          $2.74
    Pension curtailment gain, net of tax                           0.09                --         0.09              --
    Gains on sale of real estate, net of tax                          --               --            --          0.02
    Effect of lower tax rate on prior quarters (A)                    --            0.02             --             --
    After-tax impact of restructuring charge                          --            0.03             --          0.03
    Reduction of tax reserves related to previously
    discontinued operation                                              --          0.19               --         0.19
    Effect of accounting change, net of tax, SFAS 142                   --             --              --        (1.10)


Diluted net earnings per share                                    $1.06            $1.03         $3.37          $1.88


   (A) Represents the effect on the fourth quarter of 2002 of lowering the full year effective income tax
      rate to 34% from 34.5% used during the first three quarters of 2002.


            This reconciliation is presented to quantify the financial impact of unusual items on net
   earnings and net earnings per share. Since these unusual items have the impact of increasing reported
   net earnings (with the exception of the change in accounting principle), we believe it is important to
   quantify the impact these items have on reported results to enable the reader a better understanding of
   the earnings trends excluding these items. These measures should be read in combination with the
   overall financial results presented in the Statement of Earnings for the periods presented.

Weitere Àhnliche Inhalte

Was ist angesagt?

Week 9: David rudofsky%27s presentation 051117 handout (1)
Week 9: David rudofsky%27s presentation 051117   handout (1)Week 9: David rudofsky%27s presentation 051117   handout (1)
Week 9: David rudofsky%27s presentation 051117 handout (1)
Talou Diallo
 
Earning Presentation of General Motors: Q1 2007
Earning Presentation of General Motors: Q1 2007Earning Presentation of General Motors: Q1 2007
Earning Presentation of General Motors: Q1 2007
investorrelation
 
celanese 1q06_earnings_slides_-_final
celanese 1q06_earnings_slides_-_finalcelanese 1q06_earnings_slides_-_final
celanese 1q06_earnings_slides_-_final
finance44
 
4Q2007adjusted-opincome-eps
4Q2007adjusted-opincome-eps4Q2007adjusted-opincome-eps
4Q2007adjusted-opincome-eps
finance50
 
2016 wells fargo no appendix
2016 wells fargo no appendix2016 wells fargo no appendix
2016 wells fargo no appendix
ir_styronllc
 
celanese q4_2005_ir_slides
celanese q4_2005_ir_slidescelanese q4_2005_ir_slides
celanese q4_2005_ir_slides
finance44
 
spectra energy RegGCombinedQ12008
spectra energy RegGCombinedQ12008spectra energy RegGCombinedQ12008
spectra energy RegGCombinedQ12008
finance49
 
occidental petroleum Supplementals
occidental petroleum Supplementalsoccidental petroleum Supplementals
occidental petroleum Supplementals
finance13
 
EPElPasoCorporation1Q06WebcastFinal
EPElPasoCorporation1Q06WebcastFinalEPElPasoCorporation1Q06WebcastFinal
EPElPasoCorporation1Q06WebcastFinal
finance49
 
air products & chemicals fy 08 q2 earnings
air products & chemicals fy 08 q2 earningsair products & chemicals fy 08 q2 earnings
air products & chemicals fy 08 q2 earnings
finance26
 

Was ist angesagt? (13)

Week 9: David rudofsky%27s presentation 051117 handout (1)
Week 9: David rudofsky%27s presentation 051117   handout (1)Week 9: David rudofsky%27s presentation 051117   handout (1)
Week 9: David rudofsky%27s presentation 051117 handout (1)
 
Q318 earnings presentation final
Q318 earnings presentation finalQ318 earnings presentation final
Q318 earnings presentation final
 
Uct investor-presentation-may-2017
Uct investor-presentation-may-2017Uct investor-presentation-may-2017
Uct investor-presentation-may-2017
 
Earning Presentation of General Motors: Q1 2007
Earning Presentation of General Motors: Q1 2007Earning Presentation of General Motors: Q1 2007
Earning Presentation of General Motors: Q1 2007
 
Mtw second quarter 2018 earnings call ppt vf
Mtw second quarter 2018 earnings call ppt vfMtw second quarter 2018 earnings call ppt vf
Mtw second quarter 2018 earnings call ppt vf
 
celanese 1q06_earnings_slides_-_final
celanese 1q06_earnings_slides_-_finalcelanese 1q06_earnings_slides_-_final
celanese 1q06_earnings_slides_-_final
 
4Q2007adjusted-opincome-eps
4Q2007adjusted-opincome-eps4Q2007adjusted-opincome-eps
4Q2007adjusted-opincome-eps
 
2016 wells fargo no appendix
2016 wells fargo no appendix2016 wells fargo no appendix
2016 wells fargo no appendix
 
celanese q4_2005_ir_slides
celanese q4_2005_ir_slidescelanese q4_2005_ir_slides
celanese q4_2005_ir_slides
 
spectra energy RegGCombinedQ12008
spectra energy RegGCombinedQ12008spectra energy RegGCombinedQ12008
spectra energy RegGCombinedQ12008
 
occidental petroleum Supplementals
occidental petroleum Supplementalsoccidental petroleum Supplementals
occidental petroleum Supplementals
 
EPElPasoCorporation1Q06WebcastFinal
EPElPasoCorporation1Q06WebcastFinalEPElPasoCorporation1Q06WebcastFinal
EPElPasoCorporation1Q06WebcastFinal
 
air products & chemicals fy 08 q2 earnings
air products & chemicals fy 08 q2 earningsair products & chemicals fy 08 q2 earnings
air products & chemicals fy 08 q2 earnings
 

Andere mochten auch

GNW Q307_slides
GNW Q307_slidesGNW Q307_slides
GNW Q307_slides
finance24
 
eastman kodak 01/30_4Q/07_Financial_Discussion
eastman kodak 01/30_4Q/07_Financial_Discussioneastman kodak 01/30_4Q/07_Financial_Discussion
eastman kodak 01/30_4Q/07_Financial_Discussion
finance24
 
sempra energy 2002 Financial Report
sempra energy 2002 Financial Reportsempra energy 2002 Financial Report
sempra energy 2002 Financial Report
finance24
 
baxter international Q207PRSchedules
baxter international Q207PRSchedulesbaxter international Q207PRSchedules
baxter international Q207PRSchedules
finance24
 
sempra energy 2005 Financial Report
sempra energy 2005 Financial Reportsempra energy 2005 Financial Report
sempra energy 2005 Financial Report
finance24
 
sempra energy 2003 Annual Report
sempra energy 2003 Annual Reportsempra energy 2003 Annual Report
sempra energy 2003 Annual Report
finance24
 
eastman kodak q2 06 non gaap1
eastman kodak q2 06 non gaap1eastman kodak q2 06 non gaap1
eastman kodak q2 06 non gaap1
finance24
 

Andere mochten auch (7)

GNW Q307_slides
GNW Q307_slidesGNW Q307_slides
GNW Q307_slides
 
eastman kodak 01/30_4Q/07_Financial_Discussion
eastman kodak 01/30_4Q/07_Financial_Discussioneastman kodak 01/30_4Q/07_Financial_Discussion
eastman kodak 01/30_4Q/07_Financial_Discussion
 
sempra energy 2002 Financial Report
sempra energy 2002 Financial Reportsempra energy 2002 Financial Report
sempra energy 2002 Financial Report
 
baxter international Q207PRSchedules
baxter international Q207PRSchedulesbaxter international Q207PRSchedules
baxter international Q207PRSchedules
 
sempra energy 2005 Financial Report
sempra energy 2005 Financial Reportsempra energy 2005 Financial Report
sempra energy 2005 Financial Report
 
sempra energy 2003 Annual Report
sempra energy 2003 Annual Reportsempra energy 2003 Annual Report
sempra energy 2003 Annual Report
 
eastman kodak q2 06 non gaap1
eastman kodak q2 06 non gaap1eastman kodak q2 06 non gaap1
eastman kodak q2 06 non gaap1
 

Ähnlich wie danaher 03-4Qsupp

dover Release_3Q07_18442
dover Release_3Q07_18442dover Release_3Q07_18442
dover Release_3Q07_18442
finance30
 
qwest communications 020807_Non-GAAP_Measures_Reconciliation_excel
qwest communications 020807_Non-GAAP_Measures_Reconciliation_excelqwest communications 020807_Non-GAAP_Measures_Reconciliation_excel
qwest communications 020807_Non-GAAP_Measures_Reconciliation_excel
finance19
 
P&LAdoreU Children Fashion Ltd STATEMENTS OF COMPREHENSIVE INCOMEF.docx
P&LAdoreU Children Fashion Ltd STATEMENTS OF COMPREHENSIVE INCOMEF.docxP&LAdoreU Children Fashion Ltd STATEMENTS OF COMPREHENSIVE INCOMEF.docx
P&LAdoreU Children Fashion Ltd STATEMENTS OF COMPREHENSIVE INCOMEF.docx
karlhennesey
 
danaher 05-2q-rel
danaher 05-2q-reldanaher 05-2q-rel
danaher 05-2q-rel
finance24
 
el paso 02_274Q2006Earnings_FINAL_FINAL_bb
el paso  02_274Q2006Earnings_FINAL_FINAL_bbel paso  02_274Q2006Earnings_FINAL_FINAL_bb
el paso 02_274Q2006Earnings_FINAL_FINAL_bb
finance49
 
danaher 06-3Q-REL
danaher 06-3Q-RELdanaher 06-3Q-REL
danaher 06-3Q-REL
finance24
 
ameriprise 1Q07_Release
ameriprise 1Q07_Releaseameriprise 1Q07_Release
ameriprise 1Q07_Release
finance43
 
Flextronics International Ltd. earning presentation
Flextronics International Ltd. earning presentationFlextronics International Ltd. earning presentation
Flextronics International Ltd. earning presentation
investorrelation
 
Window dressing
Window dressingWindow dressing
Window dressing
vikasvadakara
 
Cteep presentation 3_q11
Cteep presentation 3_q11Cteep presentation 3_q11
Cteep presentation 3_q11
Cteep
 

Ähnlich wie danaher 03-4Qsupp (20)

Q218 earnings presentation final
Q218 earnings presentation finalQ218 earnings presentation final
Q218 earnings presentation final
 
Capital Product Partners Fourth Quarter 2008 Earnings
Capital Product Partners Fourth Quarter 2008 EarningsCapital Product Partners Fourth Quarter 2008 Earnings
Capital Product Partners Fourth Quarter 2008 Earnings
 
Q118 earnings presentation final
Q118 earnings presentation finalQ118 earnings presentation final
Q118 earnings presentation final
 
Q118 earnings presentation final 2
Q118 earnings presentation final 2Q118 earnings presentation final 2
Q118 earnings presentation final 2
 
dover Release_3Q07_18442
dover Release_3Q07_18442dover Release_3Q07_18442
dover Release_3Q07_18442
 
qwest communications 020807_Non-GAAP_Measures_Reconciliation_excel
qwest communications 020807_Non-GAAP_Measures_Reconciliation_excelqwest communications 020807_Non-GAAP_Measures_Reconciliation_excel
qwest communications 020807_Non-GAAP_Measures_Reconciliation_excel
 
Fy17 q1 supplemental web presentation
Fy17 q1 supplemental web presentationFy17 q1 supplemental web presentation
Fy17 q1 supplemental web presentation
 
Comair - Interim Report Dec 2009 Final
Comair - Interim Report Dec 2009 FinalComair - Interim Report Dec 2009 Final
Comair - Interim Report Dec 2009 Final
 
P&LAdoreU Children Fashion Ltd STATEMENTS OF COMPREHENSIVE INCOMEF.docx
P&LAdoreU Children Fashion Ltd STATEMENTS OF COMPREHENSIVE INCOMEF.docxP&LAdoreU Children Fashion Ltd STATEMENTS OF COMPREHENSIVE INCOMEF.docx
P&LAdoreU Children Fashion Ltd STATEMENTS OF COMPREHENSIVE INCOMEF.docx
 
Pirooz Pourdad - Valuation and Exit Strategies for Family Enterprise
Pirooz Pourdad - Valuation and Exit Strategies for Family EnterprisePirooz Pourdad - Valuation and Exit Strategies for Family Enterprise
Pirooz Pourdad - Valuation and Exit Strategies for Family Enterprise
 
danaher 05-2q-rel
danaher 05-2q-reldanaher 05-2q-rel
danaher 05-2q-rel
 
el paso 02_274Q2006Earnings_FINAL_FINAL_bb
el paso  02_274Q2006Earnings_FINAL_FINAL_bbel paso  02_274Q2006Earnings_FINAL_FINAL_bb
el paso 02_274Q2006Earnings_FINAL_FINAL_bb
 
danaher 06-3Q-REL
danaher 06-3Q-RELdanaher 06-3Q-REL
danaher 06-3Q-REL
 
ameriprise 1Q07_Release
ameriprise 1Q07_Releaseameriprise 1Q07_Release
ameriprise 1Q07_Release
 
Q318 earnings presentation final
Q318 earnings presentation finalQ318 earnings presentation final
Q318 earnings presentation final
 
Phoenix Technologies 1st Quarter 2009 Earnings Call
Phoenix Technologies 1st Quarter 2009 Earnings CallPhoenix Technologies 1st Quarter 2009 Earnings Call
Phoenix Technologies 1st Quarter 2009 Earnings Call
 
Flextronics International Ltd. earning presentation
Flextronics International Ltd. earning presentationFlextronics International Ltd. earning presentation
Flextronics International Ltd. earning presentation
 
Window dressing
Window dressingWindow dressing
Window dressing
 
Cteep presentation 3_q11
Cteep presentation 3_q11Cteep presentation 3_q11
Cteep presentation 3_q11
 
Quanta Services Investor Deck Aug/Sept 2019
Quanta Services Investor Deck Aug/Sept 2019Quanta Services Investor Deck Aug/Sept 2019
Quanta Services Investor Deck Aug/Sept 2019
 

Mehr von finance24

dish network annual reports 1999
dish network annual reports 1999dish network annual reports 1999
dish network annual reports 1999
finance24
 
dish network annual reports 2000
dish network annual reports 2000dish network annual reports 2000
dish network annual reports 2000
finance24
 
dish network annual reports 2001
dish network annual reports 2001dish network annual reports 2001
dish network annual reports 2001
finance24
 
dish network annual reports 2002
dish network annual reports 2002dish network annual reports 2002
dish network annual reports 2002
finance24
 
dish network annual reports 2003
dish network annual reports 2003dish network annual reports 2003
dish network annual reports 2003
finance24
 
dish network annual reports 2004
dish network annual reports 2004dish network annual reports 2004
dish network annual reports 2004
finance24
 
dish network annual reports 2005
dish network annual reports 2005dish network annual reports 2005
dish network annual reports 2005
finance24
 
dish network 2007 Notice and Proxy Statement
dish network  2007 Notice and Proxy Statementdish network  2007 Notice and Proxy Statement
dish network 2007 Notice and Proxy Statement
finance24
 
danaher 01-4qsupp
danaher 01-4qsuppdanaher 01-4qsupp
danaher 01-4qsupp
finance24
 
danaher 01-4qrel
danaher 01-4qreldanaher 01-4qrel
danaher 01-4qrel
finance24
 
danaher 01-3qrel
danaher 01-3qreldanaher 01-3qrel
danaher 01-3qrel
finance24
 
danaher 01-2qrel
danaher 01-2qreldanaher 01-2qrel
danaher 01-2qrel
finance24
 
danaher 01-1qrel
danaher 01-1qreldanaher 01-1qrel
danaher 01-1qrel
finance24
 
danaher 02-4qrel
danaher 02-4qreldanaher 02-4qrel
danaher 02-4qrel
finance24
 
danaher 02-3qrel
danaher 02-3qreldanaher 02-3qrel
danaher 02-3qrel
finance24
 
danaher 02-2qrel
danaher 02-2qreldanaher 02-2qrel
danaher 02-2qrel
finance24
 
danaher 02-1qrel
danaher 02-1qreldanaher 02-1qrel
danaher 02-1qrel
finance24
 
danaher 03-4QREL
danaher 03-4QRELdanaher 03-4QREL
danaher 03-4QREL
finance24
 
danaher 03-3Qsupp
danaher 03-3Qsuppdanaher 03-3Qsupp
danaher 03-3Qsupp
finance24
 
danaher 03-3QREL
danaher 03-3QRELdanaher 03-3QREL
danaher 03-3QREL
finance24
 

Mehr von finance24 (20)

dish network annual reports 1999
dish network annual reports 1999dish network annual reports 1999
dish network annual reports 1999
 
dish network annual reports 2000
dish network annual reports 2000dish network annual reports 2000
dish network annual reports 2000
 
dish network annual reports 2001
dish network annual reports 2001dish network annual reports 2001
dish network annual reports 2001
 
dish network annual reports 2002
dish network annual reports 2002dish network annual reports 2002
dish network annual reports 2002
 
dish network annual reports 2003
dish network annual reports 2003dish network annual reports 2003
dish network annual reports 2003
 
dish network annual reports 2004
dish network annual reports 2004dish network annual reports 2004
dish network annual reports 2004
 
dish network annual reports 2005
dish network annual reports 2005dish network annual reports 2005
dish network annual reports 2005
 
dish network 2007 Notice and Proxy Statement
dish network  2007 Notice and Proxy Statementdish network  2007 Notice and Proxy Statement
dish network 2007 Notice and Proxy Statement
 
danaher 01-4qsupp
danaher 01-4qsuppdanaher 01-4qsupp
danaher 01-4qsupp
 
danaher 01-4qrel
danaher 01-4qreldanaher 01-4qrel
danaher 01-4qrel
 
danaher 01-3qrel
danaher 01-3qreldanaher 01-3qrel
danaher 01-3qrel
 
danaher 01-2qrel
danaher 01-2qreldanaher 01-2qrel
danaher 01-2qrel
 
danaher 01-1qrel
danaher 01-1qreldanaher 01-1qrel
danaher 01-1qrel
 
danaher 02-4qrel
danaher 02-4qreldanaher 02-4qrel
danaher 02-4qrel
 
danaher 02-3qrel
danaher 02-3qreldanaher 02-3qrel
danaher 02-3qrel
 
danaher 02-2qrel
danaher 02-2qreldanaher 02-2qrel
danaher 02-2qrel
 
danaher 02-1qrel
danaher 02-1qreldanaher 02-1qrel
danaher 02-1qrel
 
danaher 03-4QREL
danaher 03-4QRELdanaher 03-4QREL
danaher 03-4QREL
 
danaher 03-3Qsupp
danaher 03-3Qsuppdanaher 03-3Qsupp
danaher 03-3Qsupp
 
danaher 03-3QREL
danaher 03-3QRELdanaher 03-3QREL
danaher 03-3QREL
 

KĂŒrzlich hochgeladen

In Sharjah àŻ”(+971)558539980 *_àŻ”abortion pills now available.
In Sharjah àŻ”(+971)558539980 *_àŻ”abortion pills now available.In Sharjah àŻ”(+971)558539980 *_àŻ”abortion pills now available.
In Sharjah àŻ”(+971)558539980 *_àŻ”abortion pills now available.
hyt3577
 
Call Girls in Tilak Nagar (delhi) call me [🔝9953056974🔝] escort service 24X7
Call Girls in Tilak Nagar (delhi) call me [🔝9953056974🔝] escort service 24X7Call Girls in Tilak Nagar (delhi) call me [🔝9953056974🔝] escort service 24X7
Call Girls in Tilak Nagar (delhi) call me [🔝9953056974🔝] escort service 24X7
9953056974 Low Rate Call Girls In Saket, Delhi NCR
 

KĂŒrzlich hochgeladen (20)

Kopar Khairane Cheapest Call Girls✔✔✔9833754194 Nerul Premium Call Girls-Navi...
Kopar Khairane Cheapest Call Girls✔✔✔9833754194 Nerul Premium Call Girls-Navi...Kopar Khairane Cheapest Call Girls✔✔✔9833754194 Nerul Premium Call Girls-Navi...
Kopar Khairane Cheapest Call Girls✔✔✔9833754194 Nerul Premium Call Girls-Navi...
 
W.D. Gann Theory Complete Information.pdf
W.D. Gann Theory Complete Information.pdfW.D. Gann Theory Complete Information.pdf
W.D. Gann Theory Complete Information.pdf
 
7 steps to achieve financial freedom.pdf
7 steps to achieve financial freedom.pdf7 steps to achieve financial freedom.pdf
7 steps to achieve financial freedom.pdf
 
Vip Call Girls Rasulgada😉 Bhubaneswar 9777949614 Housewife Call Girls Servic...
Vip Call Girls Rasulgada😉  Bhubaneswar 9777949614 Housewife Call Girls Servic...Vip Call Girls Rasulgada😉  Bhubaneswar 9777949614 Housewife Call Girls Servic...
Vip Call Girls Rasulgada😉 Bhubaneswar 9777949614 Housewife Call Girls Servic...
 
CBD Belapur((Thane)) Charming Call GirlsđŸ“žâ€9833754194 Kamothe Beautiful Call G...
CBD Belapur((Thane)) Charming Call GirlsđŸ“žâ€9833754194 Kamothe Beautiful Call G...CBD Belapur((Thane)) Charming Call GirlsđŸ“žâ€9833754194 Kamothe Beautiful Call G...
CBD Belapur((Thane)) Charming Call GirlsđŸ“žâ€9833754194 Kamothe Beautiful Call G...
 
Mahendragarh Escorts đŸ„° 8617370543 Call Girls Offer VIP Hot Girls
Mahendragarh Escorts đŸ„° 8617370543 Call Girls Offer VIP Hot GirlsMahendragarh Escorts đŸ„° 8617370543 Call Girls Offer VIP Hot Girls
Mahendragarh Escorts đŸ„° 8617370543 Call Girls Offer VIP Hot Girls
 
Benefits & Risk Of Stock Loans
Benefits & Risk Of Stock LoansBenefits & Risk Of Stock Loans
Benefits & Risk Of Stock Loans
 
Q1 2024 Conference Call Presentation vF.pdf
Q1 2024 Conference Call Presentation vF.pdfQ1 2024 Conference Call Presentation vF.pdf
Q1 2024 Conference Call Presentation vF.pdf
 
Test bank for advanced assessment interpreting findings and formulating diffe...
Test bank for advanced assessment interpreting findings and formulating diffe...Test bank for advanced assessment interpreting findings and formulating diffe...
Test bank for advanced assessment interpreting findings and formulating diffe...
 
In Sharjah àŻ”(+971)558539980 *_àŻ”abortion pills now available.
In Sharjah àŻ”(+971)558539980 *_àŻ”abortion pills now available.In Sharjah àŻ”(+971)558539980 *_àŻ”abortion pills now available.
In Sharjah àŻ”(+971)558539980 *_àŻ”abortion pills now available.
 
Kurla Capable Call Girls ,07506202331, Sion Affordable Call Girls
Kurla Capable Call Girls ,07506202331, Sion Affordable Call GirlsKurla Capable Call Girls ,07506202331, Sion Affordable Call Girls
Kurla Capable Call Girls ,07506202331, Sion Affordable Call Girls
 
Female Russian Escorts Mumbai Call Girls-((ANdheri))9833754194-Jogeshawri Fre...
Female Russian Escorts Mumbai Call Girls-((ANdheri))9833754194-Jogeshawri Fre...Female Russian Escorts Mumbai Call Girls-((ANdheri))9833754194-Jogeshawri Fre...
Female Russian Escorts Mumbai Call Girls-((ANdheri))9833754194-Jogeshawri Fre...
 
Collecting banker, Capacity of collecting Banker, conditions under section 13...
Collecting banker, Capacity of collecting Banker, conditions under section 13...Collecting banker, Capacity of collecting Banker, conditions under section 13...
Collecting banker, Capacity of collecting Banker, conditions under section 13...
 
20240419-SMC-submission-Annual-Superannuation-Performance-Test-–-design-optio...
20240419-SMC-submission-Annual-Superannuation-Performance-Test-–-design-optio...20240419-SMC-submission-Annual-Superannuation-Performance-Test-–-design-optio...
20240419-SMC-submission-Annual-Superannuation-Performance-Test-–-design-optio...
 
Call Girls in Tilak Nagar (delhi) call me [🔝9953056974🔝] escort service 24X7
Call Girls in Tilak Nagar (delhi) call me [🔝9953056974🔝] escort service 24X7Call Girls in Tilak Nagar (delhi) call me [🔝9953056974🔝] escort service 24X7
Call Girls in Tilak Nagar (delhi) call me [🔝9953056974🔝] escort service 24X7
 
Call Girls in Benson Town / 8250092165 Genuine Call girls with real Photos an...
Call Girls in Benson Town / 8250092165 Genuine Call girls with real Photos an...Call Girls in Benson Town / 8250092165 Genuine Call girls with real Photos an...
Call Girls in Benson Town / 8250092165 Genuine Call girls with real Photos an...
 
Lion One Corporate Presentation May 2024
Lion One Corporate Presentation May 2024Lion One Corporate Presentation May 2024
Lion One Corporate Presentation May 2024
 
Business Principles, Tools, and Techniques in Participating in Various Types...
Business Principles, Tools, and Techniques  in Participating in Various Types...Business Principles, Tools, and Techniques  in Participating in Various Types...
Business Principles, Tools, and Techniques in Participating in Various Types...
 
Technology industry / Finnish economic outlook
Technology industry / Finnish economic outlookTechnology industry / Finnish economic outlook
Technology industry / Finnish economic outlook
 
BhubaneswarđŸŒčRavi Tailkes ❀CALL GIRLS 9777949614 💟 CALL GIRLS IN bhubaneswar ...
BhubaneswarđŸŒčRavi Tailkes  ❀CALL GIRLS 9777949614 💟 CALL GIRLS IN bhubaneswar ...BhubaneswarđŸŒčRavi Tailkes  ❀CALL GIRLS 9777949614 💟 CALL GIRLS IN bhubaneswar ...
BhubaneswarđŸŒčRavi Tailkes ❀CALL GIRLS 9777949614 💟 CALL GIRLS IN bhubaneswar ...
 

danaher 03-4Qsupp

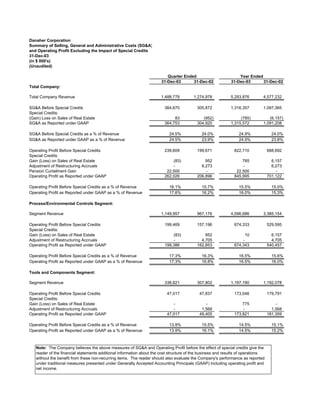
  • 1. Danaher Corporation Summary of Selling, General and Administrative Costs (SG&A) and Operating Profit Excluding the Impact of Special Credits 31-Dec-03 (in $ 000's) (Unaudited) Quarter Ended Year Ended 31-Dec-03 31-Dec-02 31-Dec-03 31-Dec-02 Total Company: Total Company Revenue 1,488,778 1,274,978 5,293,876 4,577,232 SG&A Before Special Credits 364,670 305,872 1,316,357 1,097,365 Special Credits: (Gain) Loss on Sales of Real Estate 83 (952) (785) (6,157) SG&A as Reported under GAAP 364,753 304,920 1,315,572 1,091,208 SG&A Before Special Credits as a % of Revenue 24.5% 24.0% 24.9% 24.0% SG&A as Reported under GAAP as a % of Revenue 24.5% 23.9% 24.9% 23.8% Operating Profit Before Special Credits 239,609 199,671 822,710 688,692 Special Credits: Gain (Loss) on Sales of Real Estate (83) 952 785 6,157 Adjustment of Restructuring Accruals - 6,273 - 6,273 Pension Curtailment Gain 22,500 - 22,500 - Operating Profit as Reported under GAAP 262,026 206,896 845,995 701,122 Operating Profit Before Special Credits as a % of Revenue 16.1% 15.7% 15.5% 15.0% Operating Profit as Reported under GAAP as a % of Revenue 17.6% 16.2% 16.0% 15.3% Process/Environmental Controls Segment: Segment Revenue 1,149,957 967,176 4,096,686 3,385,154 Operating Profit Before Special Credits 199,469 157,196 674,333 529,595 Special Credits: Gain (Loss) on Sales of Real Estate (83) 952 10 6,157 Adjustment of Restructuring Accruals - 4,705 - 4,705 Operating Profit as Reported under GAAP 199,386 162,853 674,343 540,457 Operating Profit Before Special Credits as a % of Revenue 17.3% 16.3% 16.5% 15.6% Operating Profit as Reported under GAAP as a % of Revenue 17.3% 16.8% 16.5% 16.0% Tools and Components Segment: Segment Revenue 338,821 307,802 1,197,190 1,192,078 Operating Profit Before Special Credits 47,017 47,837 173,046 179,791 Special Credits: Gain (Loss) on Sales of Real Estate - - 775 - Adjustment of Restructuring Accruals - 1,568 - 1,568 Operating Profit as Reported under GAAP 47,017 49,405 173,821 181,359 Operating Profit Before Special Credits as a % of Revenue 13.9% 15.5% 14.5% 15.1% Operating Profit as Reported under GAAP as a % of Revenue 13.9% 16.1% 14.5% 15.2% Note: The Company believes the above measures of SG&A and Operating Profit before the effect of special credits give the reader of the financial statements additional information about the cost structure of the business and results of operations without the benefit from these non-recurring items. The reader should also evaluate the Company's performance as reported under traditional measures presented under Generally Accepted Accounting Principals (GAAP) including operating profit and net income.
  • 2. Danaher Corporation Supplemental Financial Information 31-Dec-03 Quarter Ended Quarter Ended Quarter Ended Quarter Ended Free Cash Flows ($ in 000's): Year Ended Year Ended 28-Mar-03 29-Mar-02 27-Jun-03 28-Jun-02 26-Sep-03 27-Sep-02 31-Dec-03 31-Dec-02 31-Dec-03 31-Dec-02 31-Dec-01 31-Dec-00 Operating Cash Flows $ 214,336 $ 263,247 $ 234,912 $ 130,199 $ 170,111 $ 171,983 $ 242,185 $ 144,918 $ 861,544 $ 710,347 $ 608,471 $ 512,245 Payments for Property, Plant & Equipment (Capital Expenditures) $ (15,617) $ (12,923) $ (22,004) $ (15,318) $ (16,439) $ (16,712) $ (26,283) $ (20,477) $ (80,343) $ (65,430) (84,457) (103,718) Free Cash Flow $ 198,719 $ 250,324 $ 212,908 $ 114,881 $ 153,672 $ 155,271 $ 215,902 $ 124,441 $ 781,201 $ 644,917 $ 524,014 $ 408,527 NOTE: Free cash flow is defined as operating cash flow less purchases of Ratio of Free Cash Flow to Net Earnings: property, plant and equipment. Management believes that free cash flow provides useful information to investors regarding the Company's ability to Free Cash Flow from Above $ 781,201 generate cash without external financings. Management uses free cash flow to help gauge the resources available for strategic opportunities such as making Net Earnings 536,834 acquisitions, investing in the business and strengthening the Company's balance sheet, and uses this measure in making operating decisions, allocating Free Cash Flow to Net Earnings 146% financial resources and for budget planning purposes. Free cash flow does not, however, take into account the Company's debt service requirements and other non-discretionary expenditures and therefore is not necessarily indicative of amounts of cash that may be available for discretionary uses. Free cash flow should be considered in addition to, and not in lieu of, cash flow from operations, net earnings and other measures of financial performance prepared in accordance with GAAP.
  • 3. Danaher Corporation Supplemental Financial Information 31-Dec-03 Pro forma Pro Forma 12- Adjustmemt to 31-2003 Reflect Adjusted for the Purchase of Purchase of Debt to Total Capital and Net Debt Radiometer and Radiometer and Gendex (A) Gendex to Total Capital Ratios ($ in 000's): Actual Balance As Of: 31-Dec-03 31-Dec-02 Notes Payable and Current Portion of Long-term Debt $ 14,385 $ 112,542 $ - $ 14,385 Long-term Debt 1,284,498 1,197,422 - $ 1,284,498 Total debt 1,298,883 1,309,964 - $ 1,298,883 Total Stockholders' Equity 3,646,709 3,009,599 - $ 3,646,709 Total Capital $ 4,945,592 $ 4,319,563 $ - $ 4,945,592 Debt to Total Capital Ratio 26.3% 30.3% 26.3% Total Debt $ 1,298,883 $ 1,309,964 $ - $ 1,298,883 Less: Cash and Cash Equivalents (1,230,156) (810,463) 875,000 $ (355,156) Net Debt 68,727 499,501 - $ 943,727 Total Capital $ 4,945,592 $ 4,319,563 $ - $ 4,945,592 Net Debt to Total Capital Ratio 1.4% 11.6% 19.1% NOTE: Debt to Total Capital is defined as the ratio of Total Debt (including notes payable, current portion of long-term debt and long-term debt) to Total Capital (the sum of Total Debt and Stockholders’ Equity). Net Debt to Total Capital is defined as the ratio of Total Debt less Cash and Cash Equivalents to Total Capital. Management believes these ratios provide useful information to investors regarding the Company's debt leverage in relation to the size of its available capital base and existing cash resources. Management uses these ratios to evaluate the Company’s leverage over time to help determine the ability of the Company to access additional borrowing capacity. These ratios do not however necessarily indicate the ability of the Company to satisfy the debt service requirements in existing or future debt agreements. These ratios should be considered in addition to, and not in lieu of, other measures of liquidity including working capital prepared in accordance with GAAP. (A) Reflects the use subsequent to December 31, 2003 of approximately $875 million for the purchase of Radiometer Medical S/A and the purchase of the assets and certain liabilities of the Gendex division of Dentsply.
  • 4. DANAHER CORPORATION AND SUBSIDIARIES SUPPLEMENTAL INCOME STATEMENT DATA (in thousands, except per share amounts) Quarter Ended Year Ended 12/31/03 12/31/02 12/31/03 12/31/02 Net earnings before unusual items $ 155,377 $ 124,443 $ 521,675 $ 426,061 Pension curtailment gain, net of tax 14,625 -- 14,625 -- Gains (losses) on sale of real estate, net of tax (56) 609 534 3,940 Effect of lower tax rate on prior quarters (A) -- 2,520 -- -- After-tax impact of restructuring charge -- 4,140 -- 4,140 Reduction of tax reserves related to previously discontinued operation -- 30,000 -- 30,000 Effect of accounting change, net of tax, SFAS 142 -- -- -- (173,750) Net earnings $ 169,946 $ 161,712 $ 536,834 $ 290,391 Diluted net earnings per share before unusual items $0.97 $0.79 $3.28 $2.74 Pension curtailment gain, net of tax 0.09 -- 0.09 -- Gains on sale of real estate, net of tax -- -- -- 0.02 Effect of lower tax rate on prior quarters (A) -- 0.02 -- -- After-tax impact of restructuring charge -- 0.03 -- 0.03 Reduction of tax reserves related to previously discontinued operation -- 0.19 -- 0.19 Effect of accounting change, net of tax, SFAS 142 -- -- -- (1.10) Diluted net earnings per share $1.06 $1.03 $3.37 $1.88 (A) Represents the effect on the fourth quarter of 2002 of lowering the full year effective income tax rate to 34% from 34.5% used during the first three quarters of 2002. This reconciliation is presented to quantify the financial impact of unusual items on net earnings and net earnings per share. Since these unusual items have the impact of increasing reported net earnings (with the exception of the change in accounting principle), we believe it is important to quantify the impact these items have on reported results to enable the reader a better understanding of the earnings trends excluding these items. These measures should be read in combination with the overall financial results presented in the Statement of Earnings for the periods presented.