1. Consolidated Report to the Financial Community
Third Quarter 2008
(Released November 4, 2008) (Unaudited)
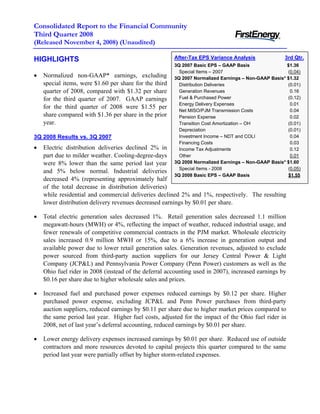
After-Tax EPS Variance Analysis 3rd Qtr.
HIGHLIGHTS
3Q 2007 Basic EPS – GAAP Basis $1.36
Special Items – 2007 (0.04)
• Normalized non-GAAP* earnings, excluding 3Q 2007 Normalized Earnings – Non-GAAP Basis* $1.32
special items, were $1.60 per share for the third Distribution Deliveries (0.01)
quarter of 2008, compared with $1.32 per share Generation Revenues 0.16
Fuel & Purchased Power (0.12)
for the third quarter of 2007. GAAP earnings
Energy Delivery Expenses 0.01
for the third quarter of 2008 were $1.55 per
Net MISO/PJM Transmission Costs 0.04
share compared with $1.36 per share in the prior Pension Expense 0.02
year. Transition Cost Amortization – OH (0.01)
Depreciation (0.01)
Investment Income – NDT and COLI 0.04
3Q 2008 Results vs. 3Q 2007
Financing Costs 0.03
• Electric distribution deliveries declined 2% in Income Tax Adjustments 0.12
part due to milder weather. Cooling-degree-days Other 0.01
3Q 2008 Normalized Earnings – Non-GAAP Basis* $1.60
were 8% lower than the same period last year
Special Items - 2008 (0.05)
and 5% below normal. Industrial deliveries
3Q 2008 Basic EPS – GAAP Basis $1.55
decreased 4% (representing approximately half
of the total decrease in distribution deliveries)
while residential and commercial deliveries declined 2% and 1%, respectively. The resulting
lower distribution delivery revenues decreased earnings by $0.01 per share.
• Total electric generation sales decreased 1%. Retail generation sales decreased 1.1 million
megawatt-hours (MWH) or 4%, reflecting the impact of weather, reduced industrial usage, and
fewer renewals of competitive commercial contracts in the PJM market. Wholesale electricity
sales increased 0.9 million MWH or 15%, due to a 6% increase in generation output and
available power due to lower retail generation sales. Generation revenues, adjusted to exclude
power sourced from third-party auction suppliers for our Jersey Central Power & Light
Company (JCP&L) and Pennsylvania Power Company (Penn Power) customers as well as the
Ohio fuel rider in 2008 (instead of the deferral accounting used in 2007), increased earnings by
$0.16 per share due to higher wholesale sales and prices.
• Increased fuel and purchased power expenses reduced earnings by $0.12 per share. Higher
purchased power expense, excluding JCP&L and Penn Power purchases from third-party
auction suppliers, reduced earnings by $0.11 per share due to higher market prices compared to
the same period last year. Higher fuel costs, adjusted for the impact of the Ohio fuel rider in
2008, net of last year’s deferral accounting, reduced earnings by $0.01 per share.
• Lower energy delivery expenses increased earnings by $0.01 per share. Reduced use of outside
contractors and more resources devoted to capital projects this quarter compared to the same
period last year were partially offset by higher storm-related expenses.
2. • Net MISO/PJM transmission costs increased earnings by $0.04 per share, primarily due to
increased revenues from the additional allocation of auction revenue rights in PJM in the third
quarter of 2008 compared to the same period last year.
• Reduced pension expense increased earnings by $0.02 per share, primarily due to an increase in
the discount rate used to determine benefit obligations as of December 31, 2007.
• Higher Ohio transition cost amortization reduced earnings by $0.01 per share.
• Incremental property additions increased depreciation expense by $0.01 per share.
• Higher nuclear decommissioning trust income of $0.08 per share, as a result of the decision
earlier in the year to reduce the equity exposure within the nuclear decommissioning investment
portfolio, was partially offset by lower income from corporate-owned life insurance which
decreased earnings by $0.04 per share.
• Lower financing costs increased earnings by $0.03 per share. The decrease in net financing
costs reflects lower interest rates on variable rate long-term debt and short-term borrowings, as
well as higher capitalized interest related to our construction program.
• Earnings in the third quarter of 2008 included tax adjustments that increased earnings by $0.12
per share. The favorable settlement of tax positions taken on federal income tax returns in prior
years increased earnings by $0.08 per share and lower taxes payable upon the filing of the 2007
federal income tax return in September 2008 compared to the amount initially estimated last
year increased earnings by $0.04 per share.
• During the quarter, a $0.05 per share reduction in earnings was recognized from the impairment
of securities held in trust for future nuclear decommissioning activities.
2008 Earnings Guidance
• Normalized non-GAAP* earnings guidance for 2008, excluding special items, has been
increased to $4.30 to $4.40 per share from our previous non-GAAP guidance of $4.25 to $4.35
per share provided in August 2008. Year-to-date normalized non-GAAP earnings through
September now stand at $3.35 per share.
* The 2008 GAAP to non-GAAP reconciliation statements can be found on page 10 of this report
and all GAAP to non-GAAP reconciliation statements are available on the Investor Information
section of FirstEnergy Corp.'s Web site at www.firstenergycorp.com/ir.
For additional information, please contact:
Ronald E. Seeholzer Rey Y. Jimenez Irene M. Prezelj
Vice President, Investor Relations Manager, Investor Relations Manager, Investor Relations
(330) 384-5415 (330) 761-4239 (330) 384-3859
Consolidated Report to the Financial Community – 3rd Quarter 2008 2
3. FirstEnergy Corp.
Consolidated Statements of Income
(Unaudited)
(In millions, except for per share amounts)
Three Months Ended Sept. 30 Nine Months Ended Sept. 30
2008 2007 Change 2008 2007 Change
Revenues
(1) Electric sales $ 3,649 $ 3,394 $ 255 $ 9,703 $ 9,063 $ 640
(2) Other 255 247 8 723 660 63
(3) Total Revenues 3,904 3,641 263 10,426 9,723 703
Expenses
(4) Fuel 356 327 29 1,000 887 113
(5) Purchased power 1,306 1,168 138 3,376 2,914 462
(6) Other operating expenses 794 756 38 2,375 2,255 120
(7) Provision for depreciation 168 162 6 500 477 23
(8) Amortization of regulatory assets 291 288 3 795 785 10
(9) Deferral of new regulatory assets (58) (107) 49 (261) (399) 138
(10) General taxes 201 197 4 596 589 7
(11) Total Expenses 3,058 2,791 267 8,381 7,508 873
(12) Operating Income 846 850 (4) 2,045 2,215 (170)
Other Income (Expense)
(13) Investment income 40 30 10 73 93 (20)
(14) Interest expense (192) (203) 11 (559) (593) 34
(15) Capitalized interest 15 9 6 36 21 15
(16) (137) (164) 27 (450) (479) 29
Total Other Expense
(17) Income Before Income Taxes 709 686 23 1,595 1,736 (141)
(18) Income taxes 238 273 (35) 585 695 (110)
(19) Net Income $ 471 $ 413 $ 58 $ 1,010 $ 1,041 $ (31)
(20) Earnings Per Share of Common Stock
(21) Basic $ 1.55 $ 1.36 $ 0.19 $ 3.32 $ 3.39 $ (0.07)
(22) Diluted $ 1.54 $ 1.34 $ 0.20 $ 3.29 $ 3.35 $ (0.06)
(23) Weighted Average Number of
Common Shares Outstanding
(24) Basic 304 304 - 304 307 (3)
(25) Diluted 307 307 - 307 311 (4)
______________________________________________________________________________________________________
Consolidated Report to the Financial Community – 3rd Quarter 2008 3
4. FirstEnergy Corp.
Consolidated Income Segments
(Unaudited)
(In millions)
Three Months Ended September 30, 2008
Ohio
Energy Competitive Transitional Other &
Delivery Energy Generation Reconciling
Services (a) Services (b) Services (c) Adjustments (d) Consolidated
Revenues
Electric sales $ 2,487 $ 381 $ 781 $ - $ 3,649
(1)
Other 170 79 32 (26) 255
(2)
Internal revenues - 786 - (786) -
(3)
2,657 1,246 813 (812) 3,904
Total Revenues
(4)
Expenses
Fuel - 356 - - 356
(5)
Purchased power 1,248 221 623 (786) 1,306
(6)
Other operating expenses 430 285 110 (31) 794
(7)
Provision for depreciation 99 67 - 2 168
(8)
Amortization of regulatory assets 263 - 28 - 291
(9)
Deferral of new regulatory assets (76) - 18 - (58)
(10)
General taxes 169 26 1 5 201
(11)
Total Expenses 2,133 955 780 (810) 3,058
(12)
Operating Income 524 291 33 (2) 846
(13)
Other Income (Expense)
Investment income 48 13 1 (22) 40
(14)
Interest expense (102) (44) (1) (45) (192)
(15)
Capitalized interest 1 13 - 1 15
(16)
(53) (18) - (66) (137)
Total Other Expense
(17)
471 273 33 (68) 709
Income Before Income Taxes
(18)
188 109 14 (73) 238
Income taxes
(19)
Net Income $ 283 $ 164 $ 19 $ 5 $ 471
(20)
(a) Consists of regulated transmission and distribution operations, including transition cost recovery, and provider of last resort
generation service for FirstEnergy's Pennsylvania and New Jersey electric utility subsidiaries.
(b) Consists of unregulated generation and commodity operations, including competitive electric sales, and generation sales to
affiliated electric utilities.
(c) Represents provider of last resort generation service by FirstEnergy's Ohio electric utility subsidiaries and MISO transmission
revenues and expenses related to the delivery of generation load.
(d) Consists primarily of interest expense related to holding company debt, corporate support services revenues and expenses
and elimination of intersegment transactions.
______________________________________________________________________________________________________
Consolidated Report to the Financial Community – 3rd Quarter 2008 4
5. FirstEnergy Corp.
Consolidated Income Segments
(Unaudited)
(In millions)
Three Months Ended September 30, 2007
Ohio
Energy Competitive Transitional Other &
Delivery Energy Generation Reconciling
Services (a) Services (b) Services (c) Adjustments (d) Consolidated
Revenues
Electric sales $ 2,340 $ 338 $ 716 $ - $ 3,394
(1)
Other 180 32 7 28 247
(2)
Internal revenues - 806 - (806) -
(3)
Total Revenues 2,520 1,176 723 (778) 3,641
(4)
Expenses
Fuel 2 325 - - 327
(5)
Purchased power 1,114 229 631 (806) 1,168
(6)
Other operating expenses 436 264 80 (24) 756
(7)
Provision for depreciation 102 51 - 9 162
(8)
Amortization of regulatory assets 279 - 9 - 288
(9)
Deferral of new regulatory assets (82) - (25) - (107)
(10)
General taxes 166 26 1 4 197
(11)
Total Expenses 2,017 895 696 (817) 2,791
(12)
Operating Income 503 281 27 39 850
(13)
Other Income (Expense)
Investment income 58 5 - (33) 30
(14)
Interest expense (120) (44) - (39) (203)
(15)
Capitalized interest 3 5 - 1 9
(16)
(59) (34) - (71) (164)
Total Other Expense
(17)
Income Before Income Taxes 444 247 27 (32) 686
(18)
175 99 11 (12) 273
Income taxes
(19)
Net Income $ 269 $ 148 $ 16 $ (20) $ 413
(20)
(a) Consists of regulated transmission and distribution operations, including transition cost recovery, and provider of last resort
generation service for FirstEnergy's Pennsylvania and New Jersey electric utility subsidiaries.
(b) Consists of unregulated generation and commodity operations, including competitive electric sales, and generation sales to
affiliated electric utilities.
(c) Represents provider of last resort generation service by FirstEnergy's Ohio electric utility subsidiaries and MISO transmission
revenues and expenses related to the delivery of generation load.
(d) Consists primarily of interest expense related to holding company debt, corporate support services revenues and expenses
and elimination of intersegment transactions.
______________________________________________________________________________________________________
Consolidated Report to the Financial Community – 3rd Quarter 2008 5
6. FirstEnergy Corp.
Consolidated Income Segments
(Unaudited)
(In millions)
Three Months Ended Sept. 30, 2008 vs. Three Months Ended Sept. 30, 2007
Ohio
Energy Competitive Transitional Other &
Delivery Energy Generation Reconciling
Services (a) Services (b) Services (c) Adjustments (d) Consolidated
Revenues
Electric sales $ 147 $ 43 $ 65 $ - $ 255
(1)
Other (10) 47 25 (54) 8
(2)
Internal revenues - (20) - 20 -
(3)
Total Revenues 137 70 90 (34) 263
(4)
Expenses
Fuel (2) 31 - - 29
(5)
Purchased power 134 (8) (8) 20 138
(6)
Other operating expenses (6) 21 30 (7) 38
(7)
Provision for depreciation (3) 16 - (7) 6
(8)
Amortization of regulatory assets (16) - 19 - 3
(9)
Deferral of new regulatory assets 6 - 43 - 49
(10)
General taxes 3 - - 1 4
(11)
Total Expenses 116 60 84 7 267
(12)
Operating Income 21 10 6 (41) (4)
(13)
Other Income (Expense)
Investment income (10) 8 1 11 10
(14)
Interest expense 18 - (1) (6) 11
(15)
Capitalized interest (2) 8 - - 6
(16)
6 16 - 5 27
Total Other Expense
(17)
Income Before Income Taxes 27 26 6 (36) 23
(18)
13 10 3 (61) (35)
Income taxes
(19)
Net Income $ 14 $ 16 $ 3 $ 25 $ 58
(20)
(a) Consists of regulated transmission and distribution operations, including transition cost recovery, and provider of last resort
generation service for FirstEnergy's Pennsylvania and New Jersey electric utility subsidiaries.
(b) Consists of unregulated generation and commodity operations, including competitive electric sales, and generation sales to
affiliated electric utilities.
(c) Represents provider of last resort generation service by FirstEnergy's Ohio electric utility subsidiaries and MISO transmission
revenues and expenses related to the delivery of generation load.
(d) Consists primarily of interest expense related to holding company debt, corporate support services revenues and expenses
and elimination of intersegment transactions.
______________________________________________________________________________________________________
Consolidated Report to the Financial Community – 3rd Quarter 2008 6
7. FirstEnergy Corp.
Financial Statements
(Unaudited)
(In millions)
Condensed Consolidated Balance Sheets
As of As of
Assets Sept. 30, 2008 Dec 31, 2007
Current Assets:
Cash and cash equivalents $ 181 $ 129
Receivables 1,531 1,421
Other 1,092 680
Total Current Assets 2,804 2,230
Property, Plant and Equipment 17,157 15,383
Investments 3,267 3,598
Deferred Charges and Other Assets 10,334 10,857
Total Assets $ 33,562 $ 32,068
Liabilities and Capitalization
Current Liabilities:
Currently payable long-term debt $ 2,509 $ 2,014
Short-term borrowings 2,392 903
Accounts payable 744 777
Other 1,402 1,454
Total Current Liabilities 7,047 5,148
Capitalization:
Common stockholders' equity 9,301 8,977
Long-term debt and other long-term obligations 8,674 8,869
Total Capitalization 17,975 17,846
Noncurrent Liabilities 8,540 9,074
Total Liabilities and Capitalization $ 33,562 $ 32,068
General Information
Three Months Ended Sept. 30 Nine Months Ended Sept. 30
2008 2007 2008 2007
Debt and equity securities redemptions $ (13) $ (176) $ (733) $ (1,565)
New long-term debt issues $ 82 $ 300 $ 631 $ 1,100
Short-term borrowings, net $ (216) $ (1,843) $ 1,489 $ (535)
Capital expenditures (a) $ (560) $ (430) $ (2,177) $ (1,127)
(a) Includes purchase of lessor equity interests in Beaver Valley Unit 2 and Perry in the nine months ended
September 30, 2008.
Adjusted Capitalization
As of September 30
2008 % Total 2007 % Total
Total common equity $ 9,301 39% $ 8,768 42%
Long-term debt and other long-term obligations 8,674 36% 8,617 38%
Currently payable long-term debt 2,509 10% 2,265 10%
Short-term borrowings 2,392 10% 573 3%
Adjustments:
Sale-leaseback net debt equivalents 1,452 7% 2,032 9%
JCP&L securitization debt (378) -2% (404) -2%
$ 23,950 100% $ 21,851 100%
Total
______________________________________________________________________________________________________
Consolidated Report to the Financial Community – 3rd Quarter 2008 7
8. FirstEnergy Corp.
Financial Statements
(Unaudited)
(In millions)
Condensed Consolidated Statements of Cash Flows
Three Months Ended Sept. 30 Nine Months Ended Sept. 30
2008 2007 2008 2007
Cash flows from operating activities
Net income $ 471 $ 413 $ 1,010 $ 1,041
Adjustments to reconcile net income to net cash from operating activities:
Depreciation, amortization, and deferral of regulatory assets 401 343 1,034 863
Deferred purchased power and other costs (44) (80) (163) (265)
Deferred income taxes and investment tax credits 149 (243) 278 (158)
Deferred rents and lease market valuation liability 39 51 (62) (41)
Pension trust contribution - - - (300)
Cash collateral, net (46) (31) 21 (50)
Electric service prepayment programs (19) (16) (58) (52)
Change in working capital and other 161 603 (632) 172
Cash flows provided from operating activities 1,112 1,040 1,428 1,210
Cash flows provided from (used for) financing activities (316) (1,896) 914 (1,442)
Cash flows provided from (used for) investing activities (685) 849 (2,290) 172
Net increase (decrease) in cash and cash equivalents $ 111 $ (7) $ 52 $ (60)
Deferrals and Amortizations
Three Months Ended Sept. 30 Nine Months Ended Sept. 30
2008 2007 Change 2008 2007 Change
Ohio Rate Plans and Transmission Deferrals
$ 1,746 $ 1,851 $ 1,847 $ 1,863
Regulatory Assets - Beginning
Interest on shopping incentives 7 9 $ (2) 24 28 $ (4)
MISO costs and interest (10) 7 (17) (8) 45 (53)
RCP distribution reliability costs and interest 46 52 (6) 129 143 (14)
RCP fuel costs and interest (15) 21 (36) (7) 62 (69)
Other (9) 6 (15) 24 17 7
$ 19 $ 95 $ (76) $ 162 $ 295 $ (133)
Current period deferrals
Amortization
Ohio transition costs $ (86) $ (83) $ (3) $ (231) $ (222) $ (9)
Shopping incentives (33) (34) 1 (92) (94) 2
MISO costs (17) (9) (8) (35) (20) (15)
Other (7) (3) (4) (29) (5) (24)
$ (143) $ (129) $ (14) $ (387) $ (341) $ (46)
Current period amortization
$ 1,622 $ 1,817 $ 1,622 $ 1,817
Regulatory Assets - Ending
Pennsylvania Deferred PJM Costs
$ 323 $ 218 $ 255 $ 157
Beginning balance
Deferrals 15 13 $ 2 86 79 $ 7
Interest 4 1 3 9 4 5
Amortizations (4) (4) - (12) (12) -
$ 5 $ 12
$ 338 $ 228 $ 338 $ 228
Ending balance
New Jersey Deferred Energy Costs
$ 293 $ 392 $ 322 $ 369
Beginning balance
Net recovery of energy costs (83) (62) $ (21) (112) (39) $ (73)
$ 210 $ 330 $ 210 $ 330
Ending balance
______________________________________________________________________________________________________
Consolidated Report to the Financial Community – 3rd Quarter 2008 8
9. FirstEnergy Corp.
Statistical Summary
(Unaudited)
Electric Sales Statistics (kWh in millions)
Three Months Ended Sept. 30 Nine Months Ended Sept. 30
2008 2007 Change 2008 2007 Change
Electric Distribution Deliveries
Ohio - Residential 4,508 4,676 -3.6% 13,114 13,342 -1.7%
- Commercial 3,974 4,028 -1.3% 11,383 11,497 -1.0%
- Industrial 5,782 6,073 -4.8% 17,193 17,661 -2.6%
- Other 93 93 - 277 278 -0.4%
Total Ohio 14,357 14,870 -3.4% 41,967 42,778 -1.9%
Pennsylvania - Residential 2,867 2,987 -4.0% 8,797 8,855 -0.7%
- Commercial 2,973 2,997 -0.8% 8,588 8,499 1.0%
- Industrial 2,548 2,622 -2.8% 7,723 7,730 -0.1%
- Other 20 20 - 61 61 -
Total Pennsylvania 8,408 8,626 -2.5% 25,169 25,145 0.1%
New Jersey - Residential 2,971 2,878 3.2% 7,523 7,617 -1.2%
- Commercial 2,699 2,732 -1.2% 7,343 7,444 -1.4%
- Industrial 717 739 -3.0% 2,133 2,166 -1.5%
- Other 22 23 -4.3% 66 66 -
Total New Jersey 6,409 6,372 0.6% 17,065 17,293 -1.3%
Total Residential 10,346 10,541 -1.8% 29,434 29,814 -1.3%
Total Commercial 9,646 9,757 -1.1% 27,314 27,440 -0.5%
Total Industrial 9,047 9,434 -4.1% 27,049 27,557 -1.8%
Total Other 135 136 -0.7% 404 405 -0.2%
Total Distribution Deliveries 29,174 29,868 -2.3% 84,201 85,216 -1.2%
Electric Sales Shopped
Ohio - Residential 596 635 -6.1% 1,616 1,687 -4.2%
- Commercial 896 957 -6.4% 2,545 2,712 -6.2%
- Industrial 686 719 -4.6% 1,976 2,048 -3.5%
Total Ohio 2,178 2,311 -5.8% 6,137 6,447 -4.8%
Pennsylvania - Residential 31 33 -6.1% 92 44 109.1%
- Commercial 187 182 2.7% 568 446 27.4%
- Industrial 526 513 2.5% 1,599 1,389 15.1%
Total Pennsylvania 744 728 2.2% 2,259 1,879 20.2%
New Jersey - Commercial 676 603 12.1% 1,849 1,596 15.9%
- Industrial 552 567 -2.6% 1,644 1,641 0.2%
Total New Jersey 1,228 1,170 5.0% 3,493 3,237 7.9%
Total Electric Sales Shopped 4,150 4,209 -1.4% 11,889 11,563 2.8%
Electric Generation Sales
Retail - Regulated 25,024 25,659 -2.5% 72,312 73,653 -1.8%
Retail - Competitive 2,961 3,449 -14.1% 8,623 9,940 -13.2%
Total Retail 27,985 29,108 -3.9% 80,935 83,593 -3.2%
Wholesale 7,074 6,148 15.1% 18,336 17,571 4.4%
Total Electric Generation Sales 35,059 35,256 -0.6% 99,271 101,164 -1.9%
Operating Statistics
Three Months Ended Sept. 30 Nine Months Ended Sept. 30
2008 2007 2008 2007
Capacity Factors:
Nuclear 99% 89% 91% 89%
Fossil - Baseload 92% 85% 84% 80%
Fossil - Load Following 65% 71% 65% 72%
Generation Output:
Nuclear 39% 36% 38% 37%
Fossil - Baseload 40% 40% 40% 38%
Fossil - Load Following 19% 22% 20% 23%
Peaking 2% 2% 2% 2%
Three Months Ended Sept. 30 Nine Months Ended Sept. 30
Weather 2008 2007 Normal 2008 2007 Normal
Composite Heating-Degree-Days 46 57 87 3,526 3,619 3,555
Composite Cooling-Degree-Days 628 683 659 882 969 909
______________________________________________________________________________________________________
Consolidated Report to the Financial Community – 3rd Quarter 2008 9
10. FirstEnergy Corp.
Special Items, EPS Reconciliations and Liquidity
(Unaudited)
(In millions, except for per share amounts)
Special Items
Three Months Ended Sept. 30 Nine Months Ended Sept. 30
2008 2007 2008 2007
Pre-tax Items - Income Increase (Decrease)
Gain on sale of non-core assets (a) $ - $ 21 $ 32 $ 21
Saxton decommissioning costs regulatory assets (b) - - - 27
Trust securities impairment (c) (25) (4) (63) (16)
Litigation settlement (a) - - 15 -
$ (25) $ 17 $ (16) $ 32
Total-Pretax Items
EPS Effect $ (0.05) $ 0.04 $ (0.03) $ 0.06
(a) Included in quot;Revenues - Otherquot;
(b) Included in quot;Deferral of new regulatory assetsquot;
(c) Included in quot;Investment incomequot;
2008 Earnings Per Share (EPS)
(Reconciliation of GAAP to Non-GAAP)
ACTUAL ACTUAL REVISED
Three Months Nine Months Guidance For
Ended Sept. 30 Ended Sept. 30 Year 2008
$ 1.55 $ 3.32 $4.27 - $4.37
Basic EPS (GAAP basis)*
Excluding Special Items*:
Gain on sale of non-core assets - (0.06) (0.06)
Litigation settlement - (0.03) (0.03)
Trust securities impairment 0.05 0.12 0.12
$ 1.60 $ 3.35 $4.30 - $4.40
Basic EPS (Non-GAAP basis)
* Excludes possible write-off of $485 million of CEI's estimated unrecoverable transition costs under the proposed
ESP, which if recognized, would be categorized as a Special Item ($1.01 per share).
Liquidity position as of October 31, 2008
Company Type Maturity Amount (M) Available (M)
(1)
Revolving Aug. 2012 $2,750 $404
FirstEnergy
FirstEnergy & FirstEnergy Solutions Revolving May 2009 300 300
Various(2)
FirstEnergy Bank Lines 120 20
(3)
FirstEnergy Generation Corp. Term Loan 300 300
Oct. 2009
Various(4)
OH & PA Utilities A/R Fin. 550 445
(1)
FirstEnergy Corp. and subsidiary borrowers Subtotal: $4,020 $1,469
(2) 456
$100M matures November 30, 2009; $20M uncommitted Cash: -
line of credit with no maturity date Total: $4,020 $1,925
(3)
Drawn amounts are payable within 30 days and may not
be reborrowed
(4)
$370M matures March 21, 2009; $180M matures December 19, 2008
with an extension requested pending state regulatory approval
of replacement facility
______________________________________________________________________________________________________
Consolidated Report to the Financial Community – 3rd Quarter 2008 10
11. RECENT DEVELOPMENTS
Record Generation Output
FirstEnergy Corp. (FirstEnergy) set a new generation output record of 22.2 million megawatt-hours during the
third quarter of 2008, a 3.2% increase over the previous record established in the third quarter of 2006. This
generation record reflects a quarterly all-time high for the nuclear fleet.
September Windstorm
On September 14, 2008, the remnants of Hurricane Ike swept through Ohio and western Pennsylvania and
produced unexpectedly high winds, reaching nearly 80 mph. More than one million customers of Ohio Edison
Company (OE), The Cleveland Electric Illuminating Company (CEI), Pennsylvania Power Company (Penn
Power), and Pennsylvania Electric Company (Penelec) were affected by the severe windstorm, which produced
the largest storm-related outage in the history of those companies. FirstEnergy crews from all of its seven utility
operating subsidiaries, along with assistance from crews of other utilities, restored service to more than 70% of the
affected customers within two days, and service to all customers was restored by September 23, 2008. Storm
expenses totaled approximately $30 million, of which $19 million was recognized as capital and $11 million as
O&M expense.
Rating Agency Action
On August 1, 2008, Standard & Poor’s rating agency, citing the Ohio Electric Security Plan (ESP) filing described
below, revised the outlook of FirstEnergy and its subsidiaries FirstEnergy Solutions Corp. (FES), OE, CEI, Toledo
Edison Company (TE), Penn Power, Jersey Central Power & Light Company (JCP&L), Metropolitan Edison
Company (Met-Ed), and Penelec to stable from negative.
Financing Activities
On October 8, 2008, FirstEnergy and its subsidiaries FES and FirstEnergy Generation Corp. (FGCO) entered into
a $300 million secured term loan facility with Credit Suisse. Each borrowing under this facility matures 30 days
from the date of the borrowing, or, if earlier, the credit facility maturity date, subject to extensions for the release
of quarterly financial results. The facility maturity date is October 7, 2009. This facility contains a minimum
borrowing amount of $100 million with FGCO as the borrower and FES and FirstEnergy as guarantors. Each
borrowing may not be re-borrowed once repaid.
On October 20, 2008, OE issued $300 million of first mortgage bonds, comprised of $275 million 8.25% series
due 2038 and $25 million 8.25% series due 2018. The net proceeds from this offering will be used to fund capital
expenditures and for other general corporate purposes of OE.
Letter to the Investment Community
On October 9, 2008, FirstEnergy issued a Letter to the Investment Community to provide a comprehensive
overview of its consolidated liquidity position and the status of ongoing financing activities. The Letter is
available at www.firstenergycorp.com/ir.
Ohio Fuel Case
On August 8, 2008, the Ohio Companies submitted a filing to suspend the procedural schedule in their application
to recover their 2006-2007 deferred fuel costs and associated carrying charges ($220 million balance as of
December 31, 2007), because the ESP filing contains a proposal addressing the recovery of these deferred fuel
costs. On August 25, 2008, the PUCO ordered that the September 29, 2008 evidentiary hearing would be held at a
future date. A revised case schedule has yet to be issued.
Consolidated Report to the Financial Community – 3rd Quarter 2008 11
12. Ohio Regulatory Update
On July 31, 2008, OE, CEI, and TE (collectively, Ohio Companies) filed both an ESP and Market Rate Offer
(MRO) with the Public Utilities Commission of Ohio (PUCO). A PUCO decision on the MRO was required by
statute within 90 days of the filing and is required on the ESP within 150 days. Under the ESP, new rates would
be effective for customers on January 1, 2009. Evidentiary hearings concluded on October 31, 2008 and no further
hearings are scheduled. The parties are required to submit initial briefs by November 21, 2008, with all reply
briefs due by December 12, 2008. The Ohio Companies also included an interim pricing proposal as part of their
ESP filing, if additional time is necessary for final approval of either the ESP or MRO. The Ohio Companies
requested PUCO approval of the interim pricing proposal by November 14, 2008.
Under the MRO alternative, the Ohio Companies propose to procure generation supply through a competitive
bidding process (CBP). If approved, the MRO would be implemented if the ESP is not approved by the PUCO or
is changed and not accepted by the Ohio Companies. On September 16, 2008, PUCO Staff testimony was filed
and five days of evidentiary hearings began. Briefs in the case were filed October 6, 2008, with Reply Briefs filed
on October 14, 2008. The PUCO failed to act on October 29, 2008 as required under the statute. The Ohio
Companies are unable to predict the outcome of this proceeding.
On July 2, 2008, July 23, 2008, and August 20, 2008, the PUCO staff issued three sets of proposed rules for
comment to implement portions of Amended Substitute Senate Bill 221 (SB221):
• Written comments and reply comments on the first set of proposed rules (related to standard service offer,
transmission cost recovery, corporate separation, and reasonable arrangements) were filed on July 22,
2008 and August 6, 2008, respectively. Final rules were adopted by the PUCO on September 17, 2008,
and presently the PUCO is scheduled to issue an Entry on Rehearing on November 5, 2008. These rules
have not yet been submitted to the Joint Committee on Agency Rule Review (JCAAR).
• Written comments and reply comments on the second set of proposed rules (related to electric service and
safety standards, competitive retail electric service, interconnection service, electric liability, customer
service, and safety and market monitoring) were filed on August 12, 2008 and August 29, 2008,
respectively. The PUCO is scheduled to consider for decision these rules on November 5, 2008.
• Written comments and reply comments on the third set of proposed rules (covering alternative energy,
emission reporting, energy efficiency, and demand reduction) were filed on September 9, 2008 and
September 26, 2008, respectively.
Following the comment period, the PUCO considers the input from stakeholders before adopting the final rules.
The final rules are then subject to change through the application for rehearing process. Once the application for
rehearing process before the PUCO is finalized, the rules are then subject to review by JCARR, which conducts up
to a 65-day review. The rules become effective 10 days following JCARR’s review.
Amendments to Market-Based Rate Tariffs
On October 24, 2008, FES, FGCO, FirstEnergy Nuclear Generation Corporation, and FirstEnergy Generation
Mansfield Unit 1 Corp. (the Applicants) filed proposed amendments to their market-based rate tariffs with the
Federal Energy Regulatory Commission (FERC). In preparation for serving Ohio customers beginning January
2009 under either the ESP or MRO described above, the Applicants are requesting a determination that FERC
requirements to obtain prior approvals for affiliate sales do not apply to the Applicants’ power sales to CEI, OE,
and TE.
Pennsylvania Legislative Update
October 15, 2008, Pennsylvania Governor Edward Rendell signed House Bill 2200 (HB 2200) into law. The bill
addresses issues such as: energy efficiency and peak load reduction, generation procurement, time-of-use rates,
smart meters, and alternative energy. Major provisions of the legislation include:
• Power acquired by utilities to serve customers after rate caps expire will be procured through a
competitive procurement process approved by the Pennsylvania Public Utility Commission (PPUC) and
will include auctions, request for proposals, and/or bilateral agreements;
• Utilities must file a plan by August 14, 2009, that provides for the installation of smart meter technology;
• A minimum reduction in peak demand of 4.5% by May 31, 2013;
Consolidated Report to the Financial Community – 3rd Quarter 2008 12
13. • Utilities must file a plan by July 1, 2009, regarding plans to meet the energy efficiency and conservation
requirements;
• Minimum reductions in energy consumption of 1% and 3% by May 31, 2011 and May 31, 2013,
respectively; and
• An expanded definition of alternative energy to include additional types of hydroelectric and biomass
facilities.
Penn Power Interim Default Service Supply Plan
On October 21, 2008, Penn Power held its third Request for Proposal (RFP) to procure default service for
residential customers for the period June 2009 through May 2010. The fourth RFP for the remainder of residential
customers’ load for the period June 2009 through May 2010 is scheduled for January 2009. The results of the four
RFPs will be averaged and adjusted for line losses, administrative fees and gross receipts tax, and will be reflected
in Penn Power’s new default service rates.
Met-Ed and Penelec File Customer Prepayment Plan
On September 25, 2008, Met-Ed and Penelec filed a voluntary prepayment plan with the PPUC. The plan offers
qualified residential and small business customers the option to gradually phase-in future generation price
increases by making modest prepayments during the next two years, before rate caps expire at the end of 2010.
Each month, customers who elect to participate would prepay an amount equal to approximately 9.6% of their
electric bill. Prepayments would earn 7.5% interest, and the prepayments plus accrued interest will be credited to
customers to offset the customer’s electric bills in 2011 and 2012. Met-Ed and Penelec requested that the PPUC
approve the plan by December 2008.
Met-Ed and Penelec Rate Cases
Several parties to the Met-Ed and Penelec 2006 rate case proceeding filed Petitions for Review with the
Commonwealth Court of Pennsylvania in 2007, asking the court to review the PPUC’s determination on several
issues including: the recovery of transmission (including congestion); the transmission deferral; consolidated tax
savings; the requested generation increase; and recovery of universal service costs from only the residential rate
class. Oral arguments were held on September 10, 2008. The Court’s decision is pending.
Solar Renewable Energy Proposal
On September 30, 2008, JCP&L filed a proposal responsive to the New Jersey Board of Public Utilities (NJBPU)
initiative addressing solar project development in the State of New Jersey. Under the proposal, JCP&L would
enter into long-term agreements to buy and sell Solar Renewable Energy Certificates (SREC) to provide a stable
basis for financing solar generation projects. An SREC represents the solar energy attributes of one megawatt-
hour of generation from a solar generation facility that has been certified by the NJBPU Office of Clean Energy.
Under this proposal, JCP&L would solicit SRECs to satisfy approximately 60%, 50%, and 40% of the incremental
SREC purchases needed in its service territory to meet the New Jersey Renewable Portfolio Standards through
2010, 2011, and 2012, respectively.
New Jersey Energy Master Plan
On October 22, 2008, the Governor of New Jersey released the details of New Jersey’s Energy Master Plan
(EMP), which includes goals to reduce energy consumption by a minimum of 20% by 2020, reduce peak
demand by 5,700 MW by 2020, meet 30% of the state's electricity needs with renewable energy by 2020, and
examine smart grid technology. The EMP outlines a series of goals and action items to meet set targets,
while also continuing to develop the clean energy industry in New Jersey. The Governor will establish a
State Energy Council to implement the recommendations outlined in the plan.
Consolidated Report to the Financial Community – 3rd Quarter 2008 13
14. Forward-looking Statements: This Consolidated Report to the Financial Community includes forward-looking
statements based on information currently available to management. Such statements are subject to certain risks and
uncertainties. These statements include declarations regarding management’s intents, beliefs and current expectations.
These statements typically contain, but are not limited to, the terms “anticipate,” “potential,” “expect,” “believe,” “estimate”
and similar words. Forward-looking statements involve estimates, assumptions, known and unknown risks, uncertainties
and other factors that may cause actual results, performance or achievements to be materially different from any future
results, performance or achievements expressed or implied by such forward-looking statements. Actual results may
differ materially due to the speed and nature of increased competition in the electric utility industry and legislative and
regulatory changes affecting how generation rates will be determined following the expiration of existing rate plans in
Ohio and Pennsylvania, the impact of the PUCO’s rulemaking process on the Ohio Companies’ Electric Security Plan
and Market Rate Offer filings, economic or weather conditions affecting future sales and margins, changes in markets for
energy services, changing energy and commodity market prices and availability, replacement power costs being higher
than anticipated or inadequately hedged, the continued ability of FirstEnergy’s regulated utilities to collect transition and
other charges or to recover increased transmission costs, maintenance costs being higher than anticipated, other
legislative and regulatory changes, revised environmental requirements, including possible greenhouse gas emission
regulations, the impact of the U.S. Court of Appeals’ July 11, 2008 decision to vacate the CAIR rules and the scope of
any laws, rules or regulations that may ultimately take their place, the uncertainty of the timing and amounts of the capital
expenditures needed to, among other things, implement the Air Quality Compliance Plan (including that such amounts
could be higher than anticipated) or levels of emission reductions related to the Consent Decree resolving the New
Source Review litigation or other potential regulatory initiatives, adverse regulatory or legal decisions and outcomes
(including, but not limited to, the revocation of necessary licenses or operating permits and oversight) by the Nuclear
Regulatory Commission (including, but not limited to, the Demand for Information issued to FENOC on May 14, 2007),
the timing and outcome of various proceedings before the PUCO (including, but not limited to, the Electric Security Plan
and Market Rate Offer proceedings as well as the distribution rate cases and the generation supply plan filing for the
Ohio Companies and the successful resolution of the issues remanded to the PUCO by the Ohio Supreme Court
regarding the Rate Stabilization Plan and the Rate Certainty Plan, including the recovery of deferred fuel costs), Met-Ed’s
and Penelec’s transmission service charge filings with the PPUC (as well as the resolution of the Petitions for Review
filed with the Commonwealth Court of Pennsylvania with respect to the transition rate plan for Met-Ed and Penelec), the
continuing availability of generating units and their ability to operate at or near full capacity, the ability to comply with
applicable state and federal reliability standards, the ability to accomplish or realize anticipated benefits from strategic
goals (including employee workforce initiatives), the ability to improve electric commodity margins and to experience
growth in the distribution business, the changing market conditions that could affect the value of assets held in the
registrant’s nuclear decommissioning trusts, pension trusts and other trust funds, and cause FirstEnergy to make
additional contributions sooner, or in an amount that is larger than currently anticipated, the ability to access the public
securities and other capital and credit markets in accordance with FirstEnergy’s financing plan and the cost of such
capital, changes in general economic conditions affecting the registrant, the state of the capital and credit markets
affecting the registrant, and the risks and other factors discussed from time to time in the registrant’s SEC filings, and
other similar factors. The foregoing review of factors should not be construed as exhaustive. New factors emerge from
time to time, and it is not possible for management to predict all such factors, nor assess the impact of any such factor on
the registrant’s business or the extent to which any factor, or combination of factors, may cause results to differ materially
from those contained in any forward-looking statements. Also, a security rating is not a recommendation to buy, sell or
hold securities, and it may be subject to revision or withdrawal at any time and each such rating should be evaluated
independently of any other rating. The registrant expressly disclaims any current intention to update any forward-looking
statements contained herein as a result of new information, future events, or otherwise.
Consolidated Report to the Financial Community – 3rd Quarter 2008 14