1. ATTACHMENT A
QWEST COMMUNICATIONS INTERNATIONAL INC.
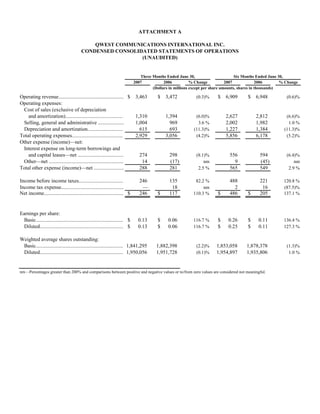
CONDENSED CONSOLIDATED STATEMENTS OF OPERATIONS
(UNAUDITED)
Three Months Ended June 30, Six Months Ended June 30,
2007 2006 % Change 2007 2006 % Change
(Dollars in millions except per share amounts, shares in thousands)
Operating revenue.................................................. $ 3,463 $ 3,472 $ 6,909 $ 6,948
(0.3)% (0.6)%
Operating expenses:
Cost of sales (exclusive of depreciation
and amortization)............................................ 1,310 1,394 2,627 2,812
(6.0)% (6.6)%
Selling, general and administrative .................... 1,004 969 2,002 1,982
3.6 % 1.0 %
Depreciation and amortization........................... 615 693 1,227 1,384
(11.3)% (11.3)%
Total operating expenses....................................... 2,929 3,056 5,856 6,178
(4.2)% (5.2)%
Other expense (income)—net:
Interest expense on long-term borrowings and
and capital leases—net ................................... 274 298 556 594
(8.1)% (6.4)%
Other—net ......................................................... 14 (17) 9 (45)
nm nm
Total other expense (income)—net ....................... 288 281 565 549
2.5 % 2.9 %
Income before income taxes.................................. 246 135 488 221
82.2 % 120.8 %
Income tax expense................................................ — 18 2 16
nm (87.5)%
Net income............................................................. $ 246 $ 117 $ 486 $ 205
110.3 % 137.1 %
Earnings per share:
Basic................................................................... $ 0.13 $ 0.06 $ 0.26 $ 0.11
116.7 % 136.4 %
Diluted................................................................ $ 0.13 $ 0.06 $ 0.25 $ 0.11
116.7 % 127.3 %
Weighted average shares outstanding:
Basic................................................................... 1,841,295 1,882,398 1,853,058 1,878,378
(2.2)% (1.3)%
Diluted................................................................ 1,950,056 1,951,728 1,954,897 1,935,806
(0.1)% 1.0 %
nm—Percentages greater than 200% and comparisons between positive and negative values or to/from zero values are considered not meaningful.
2. ATTACHMENT B
QWEST COMMUNICATIONS INTERNATIONAL INC.
CONDENSED CONSOLIDATED BALANCE SHEETS
(UNAUDITED)
June 30, December 31,
2007 2006
(Dollars in millions)
ASSETS
Current assets:
Cash and cash equivalents......................................................................................................... $ 869 $ 1,241
Short-term investments.............................................................................................................. 240 248
Other.......................................................................................................................................... 1,978 2,165
Total current assets....................................................................................................................... 3,087 3,654
Property, plant and equipment—net and other............................................................................. 17,302 17,585
Total assets................................................................................................................................... $ 20,389 $ 21,239
LIABILITIES AND STOCKHOLDERS' DEFICIT
Current liabilities:
Current portion of long-term borrowings ................................................................................. $ 1,304 $ 1,686
Accounts payable and other....................................................................................................... 3,046 3,474
Total current liabilities.................................................................................................................. 4,350 5,160
Long-term borrowings—net......................................................................................................... 13,207 13,206
Other............................................................................................................................................. 4,388 4,318
Total liabilities.............................................................................................................................. 21,945 22,684
Stockholders' deficit..................................................................................................................... (1,556) (1,445)
Total liabilities and stockholders' deficit...................................................................................... $ 20,389 $ 21,239
3. ATTACHMENT C
QWEST COMMUNICATIONS INTERNATIONAL INC.
CONDENSED CONSOLIDATED STATEMENTS OF CASH FLOWS
(UNAUDITED)
Six Months Ended
June 30,
2007 2006
(Dollars in millions)
Cash provided by operating activities........................................................................................... $ 1,373 $ 1,177
Cash used for investing activities.................................................................................................. (728) (889)
Cash (used for) provided by financing activities.......................................................................... (1,017) 55
Increase (Decrease) in cash and cash equivalents......................................................................... $ (372) $ 343
4. ATTACHMENT D
QWEST COMMUNICATIONS INTERNATIONAL INC.
SELECTED CONSOLIDATED DATA
(UNAUDITED)
Three Months Ended and as of June 30,
2007 2006 % Change
(Dollars in millions)
Operating revenue (1):
Wireline services revenue:
Voice services:
Local voice services:
Mass markets................................................................................................. $ 947 $ 1,017 (6.9)%
Business........................................................................................................ 289 309 (6.5)%
Wholesale...................................................................................................... 156 175 (10.9)%
Total local voice services................................................................................. 1,392 1,501 (7.3)%
Long-distance services:
Mass markets................................................................................................. 166 161 3.1 %
Business........................................................................................................ 133 139 (4.3)%
Wholesale...................................................................................................... 237 262 (9.5)%
Total long-distance services............................................................................. 536 562 (4.6)%
Access services................................................................................................. 139 133 4.5 %
Total voice services ............................................................................................ 2,067 2,196 (5.9)%
Data, Internet and video services:
Mass markets.................................................................................................... 291 206 41.3 %
Business............................................................................................................ 586 581 0.9 %
Wholesale......................................................................................................... 370 337 9.8 %
Total data Internet and video services.................................................................. 1,247 1,124 10.9 %
Total wireline services revenue .............................................................................. 3,314 3,320 (0.2)%
Wireless services revenue ...................................................................................... 139 142 (2.1)%
Other services revenue ........................................................................................... 10 10 —%
Total operating revenue ......................................................................................... $ 3,463 $ 3,472 (0.3)%
Other data:
Capital expenditures (2):......................................................................................... $ 426 $ 442 (3.7)%
Total employees...................................................................................................... 37,585 39,315 (4.4)%
Consumer ARPU (in dollars) (3):........................................................................... $ 53 $ 49 8.2 %
Broadband Services:
Subscribers (in thousands):.................................................................................. 2,405 1,798 33.8 %
Qualified households/businesses (in millions)..................................................... 7 7 —%
Wireless (4):
Total wireless services revenue............................................................................ 139 142 (2.1)%
End of period subscribers (in thousands)............................................................. 807 777 3.9 %
ARPU (in dollars)................................................................................................ 51 52 (1.9)%
Access lines (in thousands) (1)(5):
Business access lines:
Retail lines........................................................................................................ 2,817 2,920 (3.5)%
Resold lines...................................................................................................... 1,385 1,624 (14.7)%
Total business access lines................................................................................... 4,202 4,544 (7.5)%
Mass markets access lines:
Consumer primary lines.................................................................................... 7,015 7,592 (7.6)%
Consumer additional lines................................................................................ 713 840 (15.1)%
Small business lines.......................................................................................... 1,342 1,307 2.7 %
Total mass markets access lines........................................................................... 9,070 9,739 (6.9)%
Total access lines.................................................................................................... 13,272 14,283 (7.1)%
In-region long distance lines (in thousands)........................................................... 4,884 4,840 0.9 %
Minutes of use from carriers and CLECs (in millions):.......................................... 10,859 12,047 (9.9)%
5. ATTACHMENT D
(CONTINUED)
QWEST COMMUNICATIONS INTERNATIONAL INC.
SELECTED CONSOLIDATED DATA
(UNAUDITED)
Three Months Ended and as of June 30,
2007 2006 % Change
Mass markets retail connections (in thousands):
Mass markets access lines.................................................................................... 9,070 9,739 (6.9)%
Broadband subscribers (7)................................................................................... 2,405 1,798 33.8 %
Video subscribers (6)(7)...................................................................................... 572 259 120.8 %
Wireless subscribers............................................................................................ 807 777 3.9 %
Total mass markets retail connections..................................................................... 12,854 12,573 2.2 %
(1) Certain prior year revenue and access line amounts have been reclassified to conform to the current year presentation.
(2) Capital expenditures exclude assets acquired through capital leases.
(3) Consumer ARPU (Average Revenue Per Unit) is measured as consumer wireline revenue in the period divided by the average number of primary access
lines for the period. We believe this metric can be a useful measure of the revenue performance of our consumer business within our mass markets channel
on a per-customer basis. We use ARPU internally to assess the revenue performance of our consumer business within our mass markets channel and the
impact on this business of periodic customer initiatives and product roll-outs. ARPU is not a measure determined in accordance with accounting principles
generally accepted in the United States of America, or GAAP, and should not be considered as a substitute for our wireline services segment revenue or any
other measure determined in accordance with GAAP.
(4) Wireless ARPU (Average Revenue Per Unit) is measured as the recurring portion of our wireless services revenue stream attributed to subscribing
customers (plus certain activation fees) divided by the average number of subscribers for the period. We believe this metric can be a useful measure of
the revenue performance of our wireless business on a per-customer basis. We use ARPU internally to assess the revenue performance of our wireless
business and the impact on this business of periodic customer initiatives and product roll-outs. ARPU is not a measure determined in accordance with
GAAP and should not be considered as a substitute for our wireless services segment revenue or any other measure determined in accordance with GAAP.
Wireless ARPU includes surcharges for the recovery of costs associated with providing number portability and wireless 911 services.
Three Months Ended June 30,
2007 2006 % Change
(Dollars in millions)
ARPU is calculated as follows:
Total quarterly wireless services revenue........................................................................ $ 139 $ 142 (2.1)%
Less: quarterly non-recurring revenue............................................................................. (17) (20) (15.0)%
Quarterly recurring revenue............................................................................................. $ 122 $ 122 —%
Average monthly recurring revenue..................................................................................... $ 41 $ 41 —%
Divided by quarterly average wireless (in thousands)......................................................... 809 782 3.5 %
Wireless services ARPU (in dollars).................................................................................... $ (1.9)%
51 $ 52
(5) Access lines were reclassified during 2007 to conform to our revenue channel presentation. Resold lines include UNE lines and public pay phone lines.
(6) Video subscribers have been adjusted by approximately 14,000 subscribers as of June 30, 2006 to conform to our current presentation of video
subscribers.
(7) Broadband and video subscribers include certain business customers.
6. ATTACHMENT E
QWEST COMMUNICATIONS INTERNATIONAL INC.
RECONCILIATION OF NON-GAAP FINANCIAL MEASURES
(UNAUDITED)
Three Months Ended Six Months Ended
June 30, June 30,
2007 2006 2007 2006
(Dollars in millions)
Segment income:
Operating revenue.................................................. $ 3,463 $ 3,472 $ 6,909 $ 6,948
Cost of sales (exclusive of depreciation
and amortization) ............................................... (1,310) (1,394) (2,627) (2,812)
Selling, general and administrative ........................ (1,004) (969) (2,002) (1,982)
Segment income..................................................... 1,149 1,109 2,280 2,154
EBITDA (1):............................................................. 1,149 1,109 2,280 2,154
Depreciation and amortization............................... (615) (693) (1,227) (1,384)
Total other expense (income)—net ....................... (288) (281) (565) (549)
Income tax expense................................................ — (18) (2) (16)
Net income............................................................. $ 246 $ 117 $ 486 $ 205
EBITDA margin (1):
EBITDA................................................................. $ 1,149 $ 1,109 $ 2,280 $ 2,154
Divided by total operating revenue........................ $ 3,463 $ 3,472 $ 6,909 $ 6,948
EBITDA margin..................................................... 33.2% 31.9% 33.0% 31.0%
Free cash flow from operations (2):
Cash provided by operating activities..................... $ 1,105 $ 1,037 $ 1,373 $ 1,177
Less: expenditures for property, plant
and equipment and capitalized software............. (426) (442) (744) (832)
Free cash flow from operations.............................. 679 595 629 345
Add: certain one-time settlement payments............ — — 200 100
Adjusted free cash flow from operations................ $ 679 $ 595 $ 829 $ 445
June 30,
2007 2006
(Dollars in millions)
Net debt (3):
Current borrowings................................................. $ 1,304 $ 2,683
Long-term borrowings—net................................... 13,207 12,693
Total borrowings—net........................................... 14,511 15,376
Less: cash and cash equivalents ............................. (869) (1,189)
Less: short-term investments.................................. (240) (205)
Net debt.................................................................. $ 13,402 $ 13,982
7. ATTACHMENT E
(CONTINUED)
QWEST COMMUNICATIONS INTERNATIONAL INC.
RECONCILIATION OF NON-GAAP FINANCIAL MEASURES
(UNAUDITED)
(1) EBITDA and EBITDA Margin are non-GAAP financial measures. Other companies may calculate these measures (or similarly titled
measures) differently. We believe these measures provide useful information to investors in evaluating our capital-intensive business
because they reflect our operating performance before the impacts of non-cash items and are indicators of our ability to service debt, pay
taxes and fund discretionary spending such as capital expenditures. Management also uses EBITDA for a number of purposes, including
setting targets for compensation and assessing the performance of our operations.
(2) Free cash flow and adjusted free cash flow from operations are non-GAAP financial measures that indicate cash generated by our
business after operating expenses, capital expenditures and interest expense. We believe these measures provide useful information to our
investors for purposes of evaluating our ability to satisfy our debt and other mandatory payment obligations and because they reflect cash
flows available for financing activities, voluntary debt repayment and to strengthen our balance sheet. This is of particular relevance for
our business given our significant debt balance. We also use free cash flow and adjusted free cash flow from operations internally for a
variety of purposes, including setting targets for compensation and budgeting our cash needs. These measures are not determined in
accordance with GAAP and should not be considered as a substitute for “operating income” or “net cash provided by operating activities”
or any other measure determined in accordance with GAAP. Due to the forward-looking nature of expected free cash flow amounts for
2007, information to reconcile this non-GAAP financial measure is not available at this time.
(3) Net Debt is a non-GAAP financial measure that we calculate as our total borrowings (current plus long-term) less our cash and cash
equivalents and short and long-term investments. We believe net debt is helpful in analyzing our leverage, and management uses this
measure in making decisions regarding potential financings. Net debt is not a measure determined in accordance with GAAP and should
not be considered as a substitute for “current borrowings” or “long-term borrowings” or any other measure determined in accordance with
GAAP.