SlideShare ist ein Scribd-Unternehmen logo
1 von 32
Downloaden Sie, um offline zu lesen
STOCKHOLDER                   RETURN          PERFORMANCE                    GRAPH


The following line graph compares the yearly percentage change in the cumulative total stockholder return on the       
Company’s common stock to the cumulative total return of the Standard & Poor’s Composite 500 Stock Index
and the return of an industry peer group of companies identified in the graph (the Peer Group Index) for the
last five years ending December 31, 2007. Standard & Poor’s has calculated a return for each company in the Peer
Group Index weighted according to its respective capitalization at the beginning of each period with dividends
reinvested on a monthly basis. Management believes that the identified companies and methodology used in the
graph for the Peer Group Index provides a better comparison than other indices available. The Peer Group Index
consists of ArvinMeritor, Inc., Caterpillar Inc., Cummins Inc., Dana Corp., Deere & Co., Eaton Corp., Ingersoll-
Rand Co. Ltd., Navistar International Corp., and Oshkosh Truck Corp. The comparison assumes that $100 was
invested December 31, 2002 in the Company’s common stock and in the stated indices and assumes reinvestment
of dividends.


500                                                                                                        500


                     PACCAR Inc
                     S&P 500 Index
400                                                                                                        400
                     Peer Group Index


300                                                                                                        300


200                                                                                                        200


100                                                                                                        100


  0                                                                                                      0
  2002                 2003               2004                 2005               2006                2007


                              2002          2003           2004           2005           2006          2007
   PACCAR Inc                 100.00       189.53         278.85         249.80        367.26         476.71
   S&P 500 Index              100.00       128.68         142.69         149.70        173.34         182.86
   Peer Group Index           100.00       164.50         197.60         204.96        233.59         337.06


                                                                                         PACCAR Inc and Subsidiaries
ManageMent’s discussion and analysis of financial
           condition and results of operations

     (tables in millions, except truck unit and per share data)


     r e s u lt s o f o p e r at i o n s :                                  	 Selling,	general	and	administrative	(SG&A)	expense	

                                                                            for	Truck	and	Other	increased	to	$491.4	million	in	
                                             2007	
     		                             	                    2006	       2005
                                                                            2007	compared	to	$457.3	million	in	2006.	This	was	
     Net	sales	and	revenues:                                                due	to	expanded	sales	and	higher	production	levels	in	
     	 Truck	and		                                                          the	Company’s	foreign	operations	and	the	translation	
                            $14,030.4	
     	 		Other	                                      $15,503.3	 $13,298.4   of	stronger	foreign	currencies,	somewhat	offset	by	
                              1,191.3	
     	 Financial	Services		                              950.8	     759.0   lower	spending	in	the	U.S.	and	Canada.	As	a	percent	
                            $15,221.7	
     		                                              $16,454.1	 $14,057.4   of	revenues,	SG&A	expense	increased	to	3.5%	in	2007	
                                                                            from	3.0%	in	2006.	The	Company	continues	to	
                                                                            implement	Six	Sigma	initiatives	and	process	improve-
     Income	before	taxes:
                                                                            ments	in	all	facets	of	the	business.
     	 Truck	and		
                                                                            	 Investment	income	of	$95.4	million	in	2007	
                          $ 1,384.8	 $		1,846.6	 $		1,516.8
     	 		Other	
                                                                            increased	from	$81.3	million	in	2006	due	to	higher	
     	 Financial		
                                                                            interest	rates.
                              284.1	
     	 		Services		                       247.4	      199.9
                                                                            	 The	2007	effective	income	tax	rate	was	30.4%	
     	 Investment		
                                                                            compared	to	31.2%	in	2006.	The	lower	2007	effective	
                               95.4	
     	 		income	                           81.3	       56.9
                                                                            income	tax	rate	reflects	a	higher	proportion	of	foreign	
                             (537.0)	
     Income	taxes	                       (679.3)	    (640.4)
                                                                            earnings.
                          $ 1,227.3	 $	1,496.0	 $	1,133.2
     Net	Income	
                                                                            	 The	Company’s	return	on	revenues	was	8.1%	in	
     Diluted	Earnings	
                                                                            2007	compared	to	9.1%	in	2006.
                          $ 3.29	 $	 3.97	 $	 2.92
     	 	 Per	Share	

                                                                            Truck
     Overview:
                                                                            PACCAR’s	truck	segment,	which	includes	the	
     PACCAR	is	a	global	technology	company	whose	
                                                                            manufacture	and	distribution	of	trucks	and	related	
     principal	businesses	include	the	design,	manufacture	
                                                                            aftermarket	parts,	accounted	for	91%,	93%	and	94%	
     and	distribution	of	high-quality,	light-,	medium-	and	
                                                                            of	revenues	in	2007,	2006	and	2005,	respectively.	In	
     heavy-duty	commercial	trucks	and	related	aftermarket	
                                                                            North	America,	trucks	are	sold	under	the	Kenworth	
     parts	and	the	financing	and	leasing	of	its	trucks	and	
                                                                            and	Peterbilt	nameplates	and,	in	Europe,	under	the	
     related	equipment.	The	Company	also	manufactures	
                                                                            DAF	nameplate.
     and	markets	industrial	winches.
     	 Consolidated	net	sales	and	revenue	were	$15.22	
                                                                            	
     billion	in	2007	and	$16.45	billion	in	2006.	Current	                                               2007	
                                                                            		                 	                     2006	       2005
     year	results	reflect	strong	demand	for	the	Company’s	
                                                                            Truck	net	sales	
     high-quality	trucks	in	all	markets	outside	the	U.S.	and	
                                                                                                   $13,853.3	
                                                                            	 and	revenues		                    $15,367.3	 $13,196.1
     Canada,	and	continued	global	growth	in	aftermarket	
                                                                            Truck	income	
     parts	and	financial	services.	Financial	Services	revenues	
                                                                                                   $ 1,360.0	
                                                                            	 before	taxes	                     $		1,848.8	 $		1,520.2
     increased	to	$1.19	billion	in	2007	from	$.95	billion		
     in	2006.
     	 PACCAR	achieved	net	income	of	$1.23	billion	
     ($3.29	per	diluted	share)	in	2007,	the	second	best	
     result	in	the	Company’s	102	year	history.	Solid	results	
     were	achieved	in	the	Truck	and	Other	businesses	from	
     strong	growth	in	revenue,	increased	margins	and	on-
     going	cost	control	in	the	Company’s	foreign	operations,	
     offset	by	lower	truck	sales	and	margins	in	the	U.S.		
     and	Canada.	Financial	Services	income	before	taxes	
     increased	15%	to	a	record	$284.1	million	compared		
     to	$247.4	million	in	2006	as	a	result	of	strong	asset	
     growth	and	stable	finance	margins.
     	 Research	and	Development	expenditures	were	
     $255.5	million	in	2007,	an	increase	of	57%	from	
     $163.1	million	in	2006	due	to	increased	vehicle	and	
     engine	development	programs.
sales	division.	Combined	truck	and	parts	sales	in	
The Company’s new truck deliveries are summarized                                                                 
                                                        these	markets	accounted	for	16%	of	truck	segment	
below:
                                                        sales	and	19%	of	truck	segment	profit.
                        2007        2006       2005
                                                           PACCAR’s	worldwide	aftermarket	parts	revenues	
                      44,700
United States                     82,600     71,900     were	$2.29	billion	in	2007,	an	increase	of	18%	
                       8,300
Canada                            12,900     10,900     compared	to	$1.94	billion	in	2006.	Aftermarket	parts	
                                                        sales	increased	in	all	major	markets	from	a	growing	
                      53,000
U.S. and Canada                   95,500     82,800
                                                        truck	population,	expansion	of	parts	distribution	
                      60,100
Europe                            55,900     52,200
                                                        centers	and	focused	sales	efforts.
Mexico, Australia
                                                        	 Truck	segment	gross	margin	as	a	percentage	of	net	
                      20,800
  and other                       15,400     13,500
                                                        sales	and	revenues	was	14.7%	in	2007	and	15.7%	in	
                     133,900
Total units                      166,800    148,500
                                                        2006.	Improved	operating	efficiencies	and	strong	
                                                        demand	for	the	Company’s	products	outside	the	U.S.	
2007 Compared to 2006:
                                                        and	Canada	were	dampened	by	a	weak	truck	market	
PACCAR’s worldwide truck sales and revenues were
                                                        in	the	U.S.	and	Canada.	Higher	material	costs	from	
$13.85 billion in 2007 compared to $15.37 billion in
                                                        suppliers,	including	the	impacts	of	higher	crude	oil,	
2006 due to lower demand for the Company’s trucks
                                                        copper,	steel	and	other	commodities	negatively	
in the U.S. and Canada, somewhat offset by higher
                                                        impacted	truck	margins.
demand for trucks in all other markets and higher
global demand for related aftermarket parts. The
                                                        2006 Compared to 2005:
impact of a weaker U.S. dollar relative to the
                                                        PACCAR’s worldwide truck sales and revenues
Company’s other currencies (primarily the euro)
                                                        increased to $15.37 billion in 2006 due to high
increased revenues and pretax profit by approximately
                                                        demand for the Company’s trucks and related
$590 million and $90 million, respectively.
                                                        aftermarket parts in all major markets.
	 Truck	income	before	taxes	was	$1.36	billion	
                                                           Truck income before taxes was $1.85 billion
compared	to	$1.85	billion	in	2006.	In	the	U.S.	and	
                                                        compared to $1.52 billion in 2005. The increase from
Canada,	Peterbilt	and	Kenworth	delivered	53,000	
                                                        the prior year was due to higher production rates,
heavy	and	medium-duty	trucks	during	2007,	a	
                                                        growing aftermarket part sales and improved truck
decrease	of	45%	from	2006,	due	to	the	lower	truck	
                                                        margins.
market.	The	Class	8	market	decreased	to	175,800	
                                                           In the U.S. and Canada, Peterbilt and Kenworth
units	in	2007	from	a	record	322,500	units	in	2006,	
                                                        delivered 95,500 medium and heavy trucks during
reflecting	a	2006	pre-buy	and	a	slowdown	in	the	
                                                        2006, an increase of 15% over 2005 due to overall
housing	and	automotive	sectors.	PACCAR’s	market	
                                                        market growth and increased market share. The Class
share	increased	to	26.4%	in	2007	from	25.3%	in	
                                                        8 market increased 12% to 322,500 units in 2006 from
2006.	The	medium-duty	market	decreased	21%	to	
                                                        287,500 in 2005. PACCAR’s market share increased to
85,000	units.
                                                        25.3% in 2006 from 23.1% in 2005. The total
	 In	Europe,	DAF	trucks	delivered	60,100	units	
                                                        medium-duty market increased 3% to 107,000 units.
during	2007,	an	8%	increase	over	2006.	The	15	tonne	
                                                           In Europe, DAF trucks delivered 55,900 units
and	above	truck	market	in	Western	and	Central	Europe	
                                                        during 2006, an increase of 7% over 2005. The 15
improved	to	340,000	units,	a	10%	increase	from	2006	
                                                        tonne and above truck market improved to 308,900
levels.	DAF’s	2007	market	share	of	the	15	tonne	and	
                                                        units, a 7% increase from 2005 levels. DAF increased
above	market	was	13.9%	compared	to	14.3%	in	2006.	
                                                        its share of the 15 tonne and above market to 14.3%
DAF	market	share	in	the	6	to	15	tonne	market	was	
                                                        in 2006 from 13.6% in 2005. DAF market share in the
8.3%	in	2007	and	9.2%	in	2006.	Truck	and	parts	sales	
                                                        6 to 15 tonne market was 9.2% for 2006 and 2005.
in	Europe	represented	46%	of	PACCAR’s	total	truck	
                                                           Truck unit deliveries in Mexico, Australia and other
segment	net	sales	and	revenues	in	2007	compared	to	
                                                        countries outside the Company’s primary markets
28%	in	2006.
                                                        increased 14%. Combined truck and parts sales in
	 Truck	unit	deliveries	in	Mexico,	Australia	and	
                                                        these markets accounted for 10% of total truck
other	countries	outside	the	Company’s	primary	
                                                        segment sales and 9% of truck segment profit in 2006.
markets	increased	35%.	Deliveries	to	customers	in	
South	America,	Africa	and	Asia	are	sold	through	
PACCAR	International,	the	Company’s	international	


                                                                                   PACCAR Inc and Subsidiaries
due	to	higher	asset	levels	and	higher	interest	rates,	
     	 PACCAR’s	worldwide	aftermarket	parts	revenues	of	

                                                                   offset	partly	by	a	higher	cost	of	debt.
     $1.94	billion	increased	from	2005	due	to	a	growing	
                                                                   	 Net	portfolio	charge-offs	were	$25.8	million	
     truck	population	and	systems	integration	with	dealers.
                                                                   compared	to	$13.9	million	in	2006	due	to	higher	
     	 Truck	segment	gross	margin	as	a	percentage	of	net	
                                                                   charge-offs	in	the	U.S.	and	Canada.	At	December	31,	
     sales	and	revenues	improved	to	15.7%	in	2006	from	
                                                                   2007,	the	earning	asset	portfolio	quality	was	excellent	
     15.4%	in	2005	as	a	result	of	improved	operating	
                                                                   with	the	percentage	of	accounts	30+	days	past-due	at	
     efficiencies	and	strong	demand	for	the	Company’s	
                                                                   2.0%,	up	from	1.2%	at	the	end	of	2006,	primarily	due	
     products.
                                                                   to	increased	past	due	accounts	in	the	U.S.	and	Canada.
                                                                   	 During	the	year,	PFS	expanded	its	financing	
     Truck Outlook
                                                                   operations	into	Poland	and	now	operates	in	18	
     Continued	economic	softness	in	the	U.S.	and	Canada	
                                                                   countries	worldwide.
     is	currently	forecast	to	dampen	demand	for	heavy-
     duty	trucks	for	at	least	the	first	half	of	2008.	Industry	
                                                                   2006 Compared to 2005:
     retail	sales	are	expected	to	remain	level	to	slightly	
                                                                   PACCAR	Financial	Services	revenues	increased	25%	to	
     higher	than	2007	at	175,000–215,000	trucks.	Western	
                                                                   $950.8	million	due	to	higher	earning	assets	worldwide	
     and	Central	European	heavy-duty	registrations	for	
                                                                   and	higher	interest	rates.	New	business	volume	was	a	
     2008	are	projected	to	remain	strong	at	330,000–
                                                                   record	$4.24	billion,	up	14%	on	higher	truck	sales	
     350,000	units.	Demand	for	the	Company’s	products		
                                                                   levels	and	solid	market	share.
     in	Mexico,	Australia	and	international	markets	is	
                                                                   	 Income	before	taxes	increased	24%	to	a	record	
     expected	to	remain	strong.
                                                                   $247.4	million	from	$199.9	million	in	2005.	This	
                                                                   improvement	was	primarily	due	to	higher	finance	
     Financial Services
                                                                   gross	profit	and	lower	credit	losses,	partly	offset	by	an	
     The	Financial	Services	segment,	which	includes	wholly	
                                                                   increase	in	selling,	general	and	administrative	expenses	
     owned	subsidiaries	in	North	America,	Europe	and	
                                                                   to	support	business	growth.	The	increase	in	finance	
     Australia,	derives	its	earnings	primarily	from	financing	
                                                                   gross	profit	was	due	to	higher	asset	levels	and	higher	
     or	leasing	PACCAR	products.	Over	the	last	ten	years,	
                                                                   interest	rates,	offset	partly	by	a	higher	cost	of	debt.	
     the	asset	portfolio	and	income	before	taxes	have	
                                                                   The	lower	provision	for	losses	resulted	from	lower	net	
     grown	at	a	compound	annual	rate	of	14%.
                                                                   portfolio	charge-offs.
                                    2007	
     		                    	                    2006	      2005
                                                                   Financial Services Outlook
     Financial	Services:
                                                                   The	outlook	for	the	Financial	Services	segment	is	
     	 Average	earning		
                                                                   principally	dependent	on	the	generation	of	new	
                               $10,158.0	
     	 		assets	                            $8,746.0	   $7,389.0
                                                                   business	volume	and	the	related	spread	between	the	
                                 1,191.3	
     	 Revenues	                               950.8	      759.0
                                                                   asset	yields	and	the	borrowing	costs	on	new	business,	
     	 Income	before		
                                                                   as	well	as	the	level	of	credit	losses	experienced.	Assets	
                                   284.1	
     	 		taxes		                              247.4	      199.9
                                                                   in	the	U.S.	and	Canada	are	not	likely	to	increase	until	
                                                                   the	new	truck	market	recovers.	Asset	growth	is	likely	
     2007 Compared to 2006:
                                                                   in	Europe	due	to	an	expected	increase	in	DAF	truck	
     PACCAR	Financial	Services	(PFS)	revenues	increased	
                                                                   deliveries	due	to	a	strong	market.
     25%	to	$1.19	billion	due	to	higher	earning	assets	
                                                                   	 The	segment	is	exposed	to	reduced	liquidity	in		
     worldwide	and	higher	interest	rates.	New	business	
                                                                   the	public	debt	markets.	PFS	does	not	anticipate	the	
     volume	was	$3.94	billion	in	2007	compared	to	$4.24	
                                                                   impact	of	reduced	liquidity	to	materially	impact	its	
     billion	in	2006.	PFS	provided	loan	and	lease	financing	
                                                                   ability	to	generate	new	business	volume.
     for	29%	of	PACCAR	new	trucks	delivered	in	2007	
                                                                   	 The	segment	continues	to	be	impacted	by	the	risk	
     compared	to	25%	in	2006.
                                                                   that	serious	economic	weakness	in	North	America		
     	 Income	before	taxes	increased	15%	to	a	record	
                                                                   and	higher	fuel	costs	may	continue	to	exert	negative	
     $284.1	million	from	$247.4	million	in	2006.	This	
                                                                   pressure	on	the	profit	margins	of	truck	operators	and	
     improvement	was	primarily	due	to	higher	finance	
                                                                   result	in	higher	past-due	accounts	and	increased	
     gross	profit,	partly	offset	by	an	increase	in	selling,	
                                                                   repossessions.
     general	and	administrative	expenses	to	support	
     business	growth	and	a	higher	provision	for	losses	on	
     receivables.	The	increase	in	finance	gross	profit	was
Other Business                                                                   Truck and Other                                             
Included in Truck and Other is the Company’s winch                               The Company provides funding for working capital,
manufacturing business. Sales from this business                                 capital expenditures, research and development,
represent approximately 1% of net sales for 2007, 2006                           dividends, stock repurchases and other business
and 2005.                                                                        initiatives and commitments primarily from cash
                                                                                 provided by operations. Management expects this
                                                                                 method of funding to continue in the future. Long‑
l i q u i d i t y a n d c a p i ta l r e s o u r c e s :
                                                                                 term debt was $23.6 million at December 31, 2007.
                                            2007              2006       2005       Expenditures for property, plant and equipment in
Cash and cash                                                                    2007 totaled a record $425.7 million compared to
                                     $1,858.1
equivalents                                                $1,852.5   $1,698.9   $312.0 million in 2006. Major capital projects included
Marketable debt                                                                  the substantial completion of construction of a new
                                        778.5
securities                                                    821.7      591.4   parts distribution center in Hungary, completion of
                                                                                 a parts distribution facility in Oklahoma and the
                                     $2,636.6              $2,674.2   $2,290.3
                                                                                 completion of a new engine test facility at DAF in
                                                                                 the Netherlands. In addition, the Company made
   The Company’s total cash and marketable debt
                                                                                 significant investments related to new product
securities decreased $37.6 million in 2007. Cash
                                                                                 development and plant capacity. Over the last ten
provided by operations of $2,055.4 million was used
                                                                                 years, the Company’s combined investments in
primarily to pay dividends of $736.7 million, make
                                                                                 worldwide capital projects and research and
capital additions totaling $425.7 million and
                                                                                 development totaled $3.33 billion.
repurchase PACCAR stock for $360.5 million. Cash
                                                                                    Spending for capital investments and research and
required to originate new loans and leases was funded
                                                                                 development in 2008 is expected to increase from 2007
by repayments of existing loans and leases as well as
                                                                                 levels. In 2008, major projects will include the start of
Financial Services borrowings.
                                                                                 construction on an engine production and technology
   The Company has line of credit arrangements of
                                                                                 facility in Mississippi and continued focus on engine
$3.08 billion. The unused portion of these credit lines
                                                                                 development, new product introductions and
was $3.04 billion at December 31, 2007. Included in
                                                                                 manufacturing efficiency improvements.
these arrangements is a $2.7 billion bank facility, of
which $1.7 billion matures in 2008 and $1.0 billion
matures in 2012 and is primarily maintained to
provide backup liquidity for commercial paper
borrowings of the financial services companies.
   During the second half of 2007, PACCAR’s strong
cash position and credit ratings enabled PFS to meet
its funding requirements despite a decline in liquidity
in the public debt markets. The Company believes its
strong liquidity position and AA‑ investment grade
credit rating will continue to provide financial stability
and access to public debt markets at competitive
interest rates.
   In October 2007, PACCAR’s Board of Directors
approved the repurchase of $300 million of the
Company’s common stock.


                                                                                                            PACCAR Inc and Subsidiaries
Financial Services                                           PACCAR believes its Financial Services companies

     The Company funds its financial services activities        will be able to continue funding receivables, servicing
     primarily from collections on existing finance             debt and paying dividends through internally
     receivables and borrowings in the capital markets.         generated funds, access to public and private debt
     An additional source of funds is loans from other          markets and lines of credit.
     PACCAR companies.
                                                                Commitments
         The primary sources of borrowings in the capital
     market are commercial paper and medium-term notes          The following summarizes the Company’s contractual
     issued in the public markets and, to a lesser extent,      cash commitments at December 31, 2007:
     bank loans. The majority of the medium-term notes
                                                                                            Maturity
     are issued by PACCAR’s largest financial services
                                                                                        Within More than
     subsidiary, PACCAR Financial Corp. (PFC). PFC filed
                                                                                       One Year  One Year         Total
     a shelf registration under the Securities Act of 1933 in
     2006. The registration expires in 2009 and does not        Borrowings             $4,836.8   $3,039.0     $7,875.8
     limit the principal amount of debt securities that may     Operating leases           28.0       42.1         70.1
     be issued during the period.                               Purchase obligations      261.0       50.5        311.5
         In June 2007, PACCAR’s European finance                Other obligations           5.5       29.3         34.8
     subsidiary, PACCAR Financial Europe, renewed and           Total                  $5,131.3   $3,160.9     $8,292.2
     increased the registration of a €1.2 billion medium-
     term note program with the London Stock Exchange.
                                                                   The Company had $8.29 billion of cash commit-
     On December 31, 2007, €448 million remained
                                                                ments, substantially all of which mature within three
     available for issuance. This program is renewable
                                                                years. Of the total cash commitments for borrowings,
     annually through the filing of a new prospectus.
                                                                $7.86 billion were related to the Financial Services
        To reduce exposure to fluctuations in interest rates,
                                                                segment. As described in Note K of the consolidated
     the Financial Services companies pursue a policy of
                                                                financial statements, borrowings consist primarily of
     structuring borrowings with interest-rate character-
                                                                term debt and commercial paper issued by the
     istics similar to the assets being funded. As part of
                                                                Financial Services segment. The Company expects to
     this policy, the companies use interest-rate contracts.
                                                                fund its maturing Financial Services debt obligations
     The permitted types of interest-rate contracts and
                                                                principally from funds provided by collections from
     transaction limits have been established by the
                                                                customers on loans and lease contracts, as well as from
     Company’s senior management, who receive periodic
                                                                the proceeds of commercial paper and medium-term
     reports on the contracts outstanding.
                                                                note borrowings. Purchase obligations are the
                                                                Company’s contractual commitment to acquire future
                                                                production inventory. Other obligations include
                                                                deferred cash compensation.
The	Company’s	other	commitments	include	the		                             critical accounting policies:                              9
                                                                            In	the	preparation	of	the	Company’s	financial	
following	at	December	31,	2007:
                                                                            statements,	in	accordance	with	U.S.	generally	accepted	
		                              Commitment	Expiration                       accounting	principles,	management	uses	estimates	and	
                                                                            makes	judgments	and	assumptions	that	affect	asset	
		                                Within	 More	than
                                                                            and	liability	values	and	the	amounts	reported	as	
		                               One	Year	 One	Year	                Total
                                                                            income	and	expense	during	the	periods	presented.		
Letters	of	credit	                $		17.4	   $		18.0	              $	35.4
                                                                            The	following	are	accounting	policies	which,	in	the	
Loan	and	lease	
                                                                            opinion	of	management,	are	particularly	sensitive		
	 commitments	                         145.1	                	      145.1
                                                                            and	which,	if	actual	results	are	different,	may	have	a	
Equipment		
                                                                            material	impact	on	the	financial	statements.	
	 acquisition		
	 commitments	                          43.4	               8.1	     51.5
                                                                            Operating Leases
Residual	value	
                                                                            The	accounting	for	trucks	sold	pursuant	to	agreements	
	 guarantees	                         115.6	              212.8	    328.4
                                                                            accounted	for	as	operating	leases	is	discussed	in	Notes	
Total		                              $321.5	             $238.9	   $560.4
                                                                            A	and	G	of	the	consolidated	financial	statements.	In	
                                                                            determining	its	estimate	of	the	residual	value	of	such	
	 Loan	and	lease	commitments	are	for	funding	new	                           vehicles,	the	Company	considers	the	length	of	the	lease	
retail	loan	and	lease	contracts.	Equipment	acquisition	                     term,	the	truck	model,	the	expected	usage	of	the	truck	
commitments	require	the	Company,	under	specified	                           and	anticipated	market	demand.	If	the	sales	price	of	
circumstances,	to	purchase	equipment.	Residual	value	                       the	trucks	at	the	end	of	the	term	of	the	agreement	
guarantees	represent	the	Company’s	commitment	to	                           differs	from	the	Company’s	estimate,	a	gain	or	loss	
acquire	trucks	at	a	guaranteed	value	if	the	customer	                       will	result.	The	Company	believes	its	residual-setting	
decides	to	return	the	truck	at	a	specified	date	in	the	                     policies	are	appropriate;	however,	future	market	
future.                                                                     conditions,	changes	in	government	regulations	and	
                                                                            other	factors	outside	the	Company’s	control	could	
i m pa c t o f e n v i r o n m e n ta l m at t e r s :
                                                                            impact	the	ultimate	sales	price	of	trucks	returned	
The	Company,	its	competitors	and	industry	in	general	                       under	these	contracts.	Residual	values	are	reviewed	
are	subject	to	various	domestic	and	foreign	require-                        regularly	and	adjusted	if	market	conditions	warrant.
ments	relating	to	the	environment.	The	Company	
believes	its	policies,	practices	and	procedures	are	
designed	to	prevent	unreasonable	risk	of	environ-
mental	damage	and	that	its	handling,	use	and	disposal	
of	hazardous	or	toxic	substances	have	been	in	
accordance	with	environmental	laws	and	regulations	
enacted	at	the	time	such	use	and	disposal	occurred.	
Expenditures	related	to	environmental	activities	in	
2007,	2006	and	2005	were	immaterial.
	 The	Company	is	involved	in	various	stages	of	
investigations	and	cleanup	actions	in	different	
countries	related	to	environmental	matters.	In	certain	
of	these	matters,	the	Company	has	been	designated	as	
a	“potentially	responsible	party”	by	domestic	and	
foreign	environmental	agencies.	The	Company	has	
provided	an	accrual	for	the	estimated	costs	to	
investigate	and	complete	cleanup	actions	where	it	is	
probable	that	the	Company	will	incur	such	costs	in	
the	future.	Management	expects	that	these	matters	will	
not	have	a	significant	effect	on	the	Company’s	
consolidated	cash	flow,	liquidity	or	financial	condition.


                                                                                                       PACCAR Inc and Subsidiaries
Allowance for Credit Losses                                     The discount rate for each plan is based on market
0
     The Company determines the allowance for credit              interest rates of high-quality corporate bonds with
     losses on financial services receivables based on a          a maturity profile that matches the timing of the
     combination of historical information and current            projected benefit payments of the plans. Changes in
     market conditions. This determination is dependent           the discount rate affect the valuation of the plan
     on estimates, including assumptions regarding the            benefits obligation and funded status of the plans.
     likelihood of collecting current and past-due accounts,         The long-term rate of return on plan assets is based
     repossession rates and the recovery rate on the              on projected returns for each asset class and relative
     underlying collateral based on used truck values and         weighting of those asset classes in the plans.
     other pledged collateral or recourse. The Company               Actual results that differ from these assumptions
     believes its reserve-setting policies adequately take into   are accumulated and amortized into expense over
     account the known risks inherent in the financial            future periods. While management believes that the
     services portfolio. If there are significant variations in   assumptions used are appropriate, significant
     the actual results from those estimates, the provision       differences in actual experience or significant changes
     for credit losses and operating earnings may be              in assumptions would affect pension and other
     materially impacted.                                         postretirement benefit costs and obligations and the
                                                                  balance sheet funded status of the plans.
     Product Warranty
     The expenses related to product warranty are estimated       F O RwA R D - L O O K i N G S TAT E M E N T S :
     and recorded at the time products are sold based on          Certain information presented in this report contains
     historical and current data and reasonable expectations      forward-looking statements made pursuant to the
     for the future regarding the frequency and cost of           Private Securities Litigation Reform Act of 1995, which
     warranty claims. Management believes that the warranty       are subject to risks and uncertainties that may affect
     reserve is appropriate and takes actions to minimize         actual results. Risks and uncertainties include, but are
     warranty costs through quality-improvement programs;         not limited to: a significant decline in industry sales;
     however, actual claims incurred could materially differ      competitive pressures; reduced market share; reduced
     from the estimated amounts and require adjustments           availability of or higher prices for fuel; increased safety,
     to the reserve.                                              emissions, or other regulations resulting in higher
                                                                  costs and/or sales restrictions; currency or commodity
     Pension and Other Postretirement Benefits                    price fluctuations; lower used truck prices; insufficient
     The Company’s accounting for employee pension                or under-utilization of manufacturing capacity;
     and other postretirement benefit costs and obligations       supplier interruptions; insufficient liquidity in the
     is based on management assumptions about the future          capital markets; insufficient supplier capacity or access
     used by actuaries to estimate net costs and liabilities.     to raw materials; labor disruptions; shortages of
     These assumptions include discount rates, long-term          commercial truck drivers; increased warranty costs or
     rates of return on plan assets, health care cost trends,     litigation; or legislative and governmental regulations.
     inflation rates, retirement rates, mortality rates and
     other factors. Management bases these assumptions
     on historical results, the current environment and
     reasonable expectations of future events.
consolidated                statements        of          income


                                                                      2007	
Year Ended December 31                                                                      	2006	                 2005    31
                                                                          (millions except per share data)
truck and other:

Net	sales	and	revenues	                                    	$14,030.4	              	$15,503.3	              $
                                                                                                             	 13,298.4

                                                           	 11,917.3	
Cost	of	sales	and	revenues	                                                          	 13,036.6	             	 11,222.7
                                                                255.5	               	 163.1	
Research	and	development	                                  	                                                 	 117.8
                                                                491.4	
Selling,	general	and	administrative	                       	                         	 457.3	                	 429.9
                                                                (18.6)	
Interest	and	other	(income)	expense,	net	                  	                         	      (.3)	            	     11.2
                                                           	 12,645.6	
				                                                                                 	 13,656.7	             	 11,781.6	
                                                           	 1,384.8	
Truck and Other Income Before Income Taxes	                                          	 1,846.6	              	 1,516.8
 	
financial services:

                                                           	 1,191.3	
Revenues		                                                                           	     950.8	            	    759.0

                                                                    755.3	
Interest	and	other	                                        	                         	     573.7	            	    433.8
                                                                    110.9	
Selling,	general	and	administrative	                       	                         	      95.9	            	     84.9
                                                                     41.0	
Provision	for	losses	on	receivables	                       	                         	      33.8	            	     40.4
                                                                    907.2	
				                                                       	                         	     703.4	            	    559.1
                                                                    284.1	
Financial Services Income Before Income Taxes	             	                         	     247.4	            	    199.9

                                                                  95.4	
Investment	income	                                         	                         	     81.3	             	    56.9
                                                           	 1,764.3	
Total Income Before Income Taxes		                                                   	 2,175.3	              	 1,773.6
                                                                 537.0	
Income	taxes	                                              	                         	 679.3	                	 640.4
Net Income                                                 	$		1,227.3              $
                                                                                    	 		1,496.0	             $	1,133.2

Net	Income	Per	Share
                                                               	$							3.31	
Basic	 	 	                                                                          $	       3.99	           $	    2.93
                                                               	 							3.29	
                                                                $
Diluted	 	                                                                          $	       3.97	           $	    2.92

Weighted	average	number	of	common	shares	outstanding
                                                                    371.1	
Basic	 	 	                                                 	                         	     375.1	            	    386.4
                                                                    373.3	
Diluted	 	                                                 	                         	     377.2	            	    388.7
See notes to consolidated financial statements.


                                                                                         PACCAR Inc and Subsidiaries
CONSOLiDATED   bALANCE   SHEETS


     ASSETS

                                                                    2007
     December 31                                                                              2006
                                                                      (millions of dollars)
     TRUCK AND OTHER:

     Current Assets
                                                              $ 1,736.5
     Cash and cash equivalents                                                       $ 1,806.3
                                                                  570.0
     Trade and other receivables, net                                                    665.0
                                                                  778.5
     Marketable debt securities                                                          821.7
                                                                  628.3
     Inventories                                                                         693.7
                                                                  205.6
     Deferred taxes and other current assets                                             212.8
                                                                3,918.9
     Total Truck and Other Current Assets                                              4,199.5

                                                                    489.2
     Equipment on operating leases, net                                                   418.2
                                                                  1,642.6
     Property, plant and equipment, net                                                 1,347.2
                                                                    467.2
     Other noncurrent assets                                                              331.3
                                                                  6,517.9
     Total Truck and Other Assets                                                       6,296.2


     FiNANCiAL SERviCES:

                                                                  121.6
     Cash and cash equivalents                                                            46.2
                                                                9,025.4
     Finance and other receivables, net                                                8,542.7
                                                                1,318.7
     Equipment on operating leases, net                                                1,033.1
                                                                  244.6
     Other assets                                                                        189.2
                                                               10,710.3
     Total Financial Services Assets                                                   9,811.2
                                                              $17,228.2              $16,107.4
liabilities and stockholders’ equity                                                                                           
                                                                                               2007	
December 31                                                                      	                                      2006
                                                                                                (millions of dollars)
truck and other:

Current Liabilities
                                                                                         	$ 2,136.3	
Accounts	payable	and	accrued	expenses	                                               	                         $	 2,240.5
                                                                                          	 367.1	
Dividend	payable	                                                            	       	                         	 497.0
                                                                                          	 2,503.4	
Total Truck and Other Current Liabilities	                                   	       	                         	 2,737.5
                                                                                               23.6	
Long‑term	debt	                                                              	       	    	                    	     20.2
                                                                                          	 539.4	
Residual	value	guarantees	and	deferred	revenues	                             	       	                         	 477.5
                                                                                          	 458.4	
Deferred	taxes	and	other	liabilities	                                        	       	                         	 383.7
                                                                                          	 3,524.8	
Total Truck and Other Liabilities	                                           	       	                         	 3,618.9

financial services:

Accounts	payable,	accrued	expenses	and	other	                                	       	   	 258.5	              	 243.2
                                                                                         	 4,106.8	
Commercial	paper	and	bank	loans	                                             	       	                         	 4,222.6
                                                                                         	 3,745.4	
Term	debt	                                                                   	       	                         	 3,037.2
                                                                                         	 579.6	
Deferred	taxes	and	other	liabilities	                                        	       	                         	 529.3
                                                                                         	 8,690.3	
Total Financial Services Liabilities	                                        	       	                         	 8,032.3

stockholders’ equity

Preferred	stock,	no	par	value	–	authorized	1.0	million	shares,	none	issued
Common	stock,	$1	par	value	–	authorized	400.0	million	shares;
                                                                                         	 368.4	
	 issued	368.4	million	and	248.5	million	shares	                             	       	                         	 248.5
                                                                                              37.7	
Additional	paid‑in	capital	                                                  	       	   	                     	     27.5
                                                                                         	 (61.7)	
Treasury	stock	–	at	cost	                                                    	       	                         	     (2.1)
                                                                                         	 4,260.6	
Retained	earnings	                                                           	       	                         	 4,026.1
                                                                                         	 408.1	
Accumulated	other	comprehensive	income	                                      	       	                         	 156.2
                                                                                         	 5,013.1	
Total Stockholders’ Equity	                                                  	       	                         	 4,456.2
                                                                                         $17,228.2	
				                                                                         	       	                         	 16,107.4
                                                                                                               $
See notes to consolidated financial statements.


                                                                                          PACCAR Inc and Subsidiaries
consolidated                    statements             of      cash          flows


                                                                                   2007	
     Year Ended December 31                                                                             2006	            2005
4
                                                                                            (millions of dollars)
     operating activities:

                                                                           	 $ 1,227.3	
     Net income	                                                                                 $	1,496.0		        $	1,133.2	
     Items included in net income not affecting cash:
     	 Depreciation	and	amortization:
                                                                                 196.4	
     	 	 Property,	plant	and	equipment	                                    	                     	    163.4	        	   133.3
                                                                                 330.0	
     	 	 Equipment	on	operating	leases	and	other	                          	                     	    271.2	        	   236.8
                                                                                  41.0	
     	 Provision	for	losses	on	financial	services	receivables	             	                     	     33.8	        	    40.4
                                                                                 (21.7)	
     	 Gain	on	sale	of	property	                                           	                     	         	        	
                                                                                  20.7	
     	 Other,	net	                                                         	                     	     61.2	        	   (19.8)
     Change in operating assets and liabilities:
     	 Decrease	(increase)	in	assets	other	than	cash	and	equivalents:
     	 	 Receivables:
                                                                                 143.6	
     	 	 	 Trade	and	other	                                                	                     	    (80.5)	       	 (80.1)
                                                                                  81.3	
     	 	 	 Wholesale	receivables	on	new	trucks	                            	                     	    (64.6)	       	 (398.9)
     	 	 	 Sales-type	finance	leases	and	dealer	direct	loans	on		
                                                                                  40.3	
     	 	 	 		new	trucks	                                                   	                     	 (232.4)	         	 (194.3)
                                                                                 114.4	
     	 	 Inventories	                                                      	                     	 (168.5)	         	 (30.1)
                                                                                  16.8	
     	 	 Other,	net	                                                       	                     	   (2.2)	         	 (37.5)
     	 (Decrease)	increase	in	liabilities:
                                                                           	 (277.6)	
     	 	 Accounts	payable	and	accrued	expenses	                                                  	 423.3	           	   147.1
                                                                                85.1	
     	 	 Residual	value	guarantees	and	deferred	revenues	                  	                     	    72.9	         	    45.5
                                                                                57.8	
     	 	 Other,	net	                                                       	                     	 (120.9)	         	    11.2	
                                                                           	 2,055.4	
     Net Cash Provided by Operating Activities	                                                  	 1,852.7	         	   986.8

     investing activities:

                                                                               (3,116.6)	
     Retail	loans	and	direct	financing	leases	originated	                  	                     	 (3,318.5)	       	 (2,946.4)
                                                                                2,837.3	
     Collections	on	retail	loans	and	direct	financing	leases	              	                     	 2,543.8	         	 2,202.5
                                                                                   13.7	
     Net	decrease	(increase)	in	wholesale	receivables	on	used	equipment	   	                     	 (27.5)	          	 (15.5)
                                                                               (1,282.9)	
     Marketable	securities	purchases	                                      	                     	 (1,458.2)	       	 (1,172.4)
                                                                                1,345.5	
     Marketable	securities	sales	and	maturities	                           	                     	 1,225.4	         	 1,135.1
                                                                                 (425.7)	
     Acquisition	of	property,	plant	and	equipment	                         	                     	 (312.0)	         	 (300.4)
                                                                                 (841.7)	
     Acquisition	of	equipment	for	operating	leases	                        	                     	 (642.3)	         	 (548.1)
                                                                                  240.1	
     Proceeds	from	asset	disposals	                                        	                     	 162.2	           	     96.1
                                                                                  (66.5)	
     Other,	net	                                                           	                     	      1.0	        	     46.5
                                                                               (1,296.8)	
     Net Cash Used in Investing Activities	                                	                     	 (1,826.1)	       	 (1,502.6)

     financing activities:

                                                                           	 (736.7)	
     Cash	dividends	paid	                                                                        	 (530.4)	         	 (496.9)
                                                                           	 (360.5)	
     Purchase	of	treasury	stock	                                                                 	 (312.0)	         	 (367.2)
                                                                                  30.8	
     Stock	compensation	transactions	                                      	                     	     37.7	        	     11.9
                                                                           	 (366.1)	
     Net	(decrease)	increase	in	commercial	paper	and	bank	loans	                                 	 576.0	           	 1,148.4
                                                                                 879.5	
     Proceeds	from	long-term	debt	                                         	                     	 2,222.6	         	 1,016.9
                                                                           	 (285.5)	
     Payments	on	long-term	debt	                                                                 	 (1,951.4)	       	 (592.1)
                                                                           	 (838.5)	
     Net Cash (Used in) Provided by Financing Activities	                                        	     42.5	        	 721.0
                                                                                  85.5	
     Effect	of	exchange	rate	changes	on	cash	                              	                     	     84.5	        	 (121.0)
                                                                                   5.6	
     Net Increase in Cash and Cash Equivalents	                            	                     	 153.6	           	     84.2
                                                                           	 1,852.5	
     Cash	and	Cash	Equivalents	at	beginning	of	year	                                             	 1,698.9	         	 1,614.7
                                                                           	 $ 1,858.1	
     Cash and Cash Equivalents at end of year	                                                   $	 1,852.5	        $	 1,698.9
     See notes to consolidated financial statements.
consolidated                    statements         of   stockholders’                           equity


                                                                      2007	
December 31                                                                               2006	                  2005    5
                                                                         (millions except per share data)
common stock, $1 par value:

                                                             	 $ $ 248.5	
Balance	at	beginning	of	year	                                                       $	 169.4	               $	 173.9
                                                                    (3.8)	
Treasury	stock	retirement	                                   	                      	   (5.0)	              	   (5.0)
                                                                   122.8	
50%	stock	dividend	                                          	                      	   83.1	               	
                                                                      .9	
Stock	compensation	                                          	                      	    1.0	               	     .5
                                                                   368.4	
Balance	at	end	of	year	                                      	                      	 248.5	                	 169.4
additional paid-in capital:

                                                                      27.5	
Balance	at	beginning	of	year	                                	                      	 140.6	                	 450.5
                                                                     (33.8)	
Treasury	stock	retirement	                                   	                      	 (160.8)	              	 (338.4)
                                                                      44.0	
Stock	compensation	and	tax	benefit	                          	                      	   47.7	               	   28.5
                                                                      37.7	
Balance	at	end	of	year	                                      	                      	   27.5	               	 140.6
treasury stock, at cost:

                                                                      (2.1)
Balance	at	beginning	of	year	                                	                         (35.1)
                                                                    (359.6)	
Purchases:	(shares)	2007-5.1;	2006-4.5;	2005-5.5	            	                      	 (301.5)	              	 (378.5)
                                                                     300.0	
Retirements	                                                 	                      	 334.5	                	 343.4
                                                                     (61.7)
Balance	at	end	of	year	                                      	                          (2.1)                  (35.1)
retained earnings:

                                                             	 4,026.1	
Balance	at	beginning	of	year	                                                       	 3,471.5	              	 2,826.9
                                                             	 1,227.3	
Net	income	                                                                         	 1,496.0	              	 1,133.2
Cash	dividends	declared	on	common	stock,
                                                             	 (607.6)	
	 per	share:	2007-$1.65;	2006-$1.84;	2005-$1.28	                                    	 (689.6)	              	 (488.6)
                                                             	 (262.4)
Treasury	stock	retirement	                                                             (168.7)
                                                             	 (122.8)
50%	stock	dividend	                                                                     (83.1)
                                                             	 4,260.6	
Balance	at	end	of	year	                                                             	 4,026.1	              	 3,471.5
accumulated other comprehensive income (loss):

                                                                    156.2	
Balance	at	beginning	of	year	                                	                      	 	 154.7	              	 	 311.1
FAS	158	accounting	change,	net	of	$87.5	tax	effect	          	                          (160.2)	            	
                                                                     251.9	
Other	comprehensive	income	(loss)	                           	                      	 161.7	                	 (156.4)
                                                                     408.1	
Balance	at	end	of	year	                                      	                      	 156.2	                	 154.7
                                                                 $ 5,013.1	
Total Stockholders’ Equity	                                                         $	 4,456.2	             $	 3,901.1
See notes to consolidated financial statements.


                                                                                     PACCAR Inc and Subsidiaries
CONSOLiDATED                    STATEMENTS             OF   COMPREHENSivE                       iNCOME


                                                                                 2007
     Year Ended December 31                                                                          2006               2005

                                                                                            (millions of dollars)
                                                                             $1,227.3
     Net income                                                                                 $1,496.0            $1,133.2
     Other comprehensive income (loss):
       Unrealized (losses) gains on derivative contracts
                                                                                (32.5)
         (Losses) gains arising during the period                                                    13.1               28.5
                                                                                 15.9
           Tax effect                                                                                (4.7)             (10.5)
                                                                                (14.8)
         Reclassification adjustment                                                                (17.4)               9.6
                                                                                  5.6
           Tax effect                                                                                 5.9               (2.8)
                                                                                (25.8)               (3.1)              24.8
          Unrealized gains (losses) on investments
                                                                                  5.2
           Net holding gain (loss)                                                                     (.6)             (1.6)
                                                                                 (2.1)
            Tax effect                                                                                  .3                .6
                                                                                   .2
           Reclassification adjustment                                                                                   (.5)
                                                                                  (.1)
            Tax effect                                                                                                    .2
                                                                                  3.2                  (.3)             (1.3)
          Pension and postretirement
           Minimum pension liability adjustment                                                      26.0              (20.2)
            Tax effect                                                                               (9.8)               7.9
                                                                                 87.0
           Amounts arising during the period
                                                                                (32.2)
            Tax effect
                                                                                 12.7
           Reclassification adjustment
                                                                                 (4.6)
            Tax effect
                                                                                 62.9               16.2               (12.3)
                                                                                211.6
        Foreign currency translation gains (losses)                                                148.9              (167.6)
                                                                                251.9
     Net other comprehensive income (loss)                                                         161.7              (156.4)
                                                                             $1,479.2
     Comprehensive Income                                                                       $1,657.7            $ 976.8
     See notes to consolidated financial statements.


                NOTES         TO     CONSOLiDATED                FiNANCiAL               STATEMENTS

     December 31, 2007, 2006 and 2005 (currencies in millions)


     A.   SiGNiFiCANT ACCOUNTiNG POLiCiES                            Use of Estimates: The preparation of financial
                                                                  statements in conformity with accounting principles
     Description of Operations: PACCAR Inc (the Company
                                                                  generally accepted in the United States requires
     or PACCAR) is a multinational company operating in
                                                                  management to make estimates and assumptions
     two segments: (1) the manufacture and distribution of
                                                                  that affect the amounts reported in the financial
     light-, medium- and heavy-duty commercial trucks
                                                                  statements and accompanying notes. Actual results
     and related aftermarket parts and (2) finance and
                                                                  could differ from those estimates.
     leasing products and services provided to customers
                                                                     Cash and Cash Equivalents: Cash equivalents consist
     and dealers. PACCAR’s sales and revenues are derived
                                                                  of liquid investments with a maturity at date
     primarily from North America and Europe. The
                                                                  of purchase of three months or less.
     Company also operates in Australia and sells trucks
                                                                     Trade and Other Receivables: The Company’s trade
     and parts outside its primary markets to customers in
                                                                  and other receivables are included at cost on the
     Asia, Africa and South America.
                                                                  balance sheet, net of allowances.
        Principles of Consolidation: The consolidated
     financial statements include the accounts of the
     Company and its wholly owned domestic and foreign
     subsidiaries. All significant intercompany accounts and
     transactions are eliminated in consolidation.
NOTES          TO      CONSOLiDATED                       FiNANCiAL             STATEMENTS

December 31, 2007, 2006 and 2005 (currencies in millions except per share amounts)


    Long-lived Assets, Goodwill and Other Intangible                   Earnings per Share: Diluted earnings per share are     
Assets: The Company evaluates the carrying value of                 based on the weighted average number of basic shares
long-lived assets (including property and equipment,                outstanding during the year, adjusted for the dilutive
goodwill and other intangible assets) when events and               effects of stock-based compensation awards under the
circumstances warrant such a review. Goodwill is also               treasury stock method.
tested for impairment on an annual basis. There were                   New Accounting Pronouncements: The Company
no impairment charges during the three years ended                  adopted FASB Statement No. 158, Employers’
December 31, 2007.                                                  Accounting for Defined Benefit Pension and Other
    Revenue Recognition: Substantially all sales and                Retirement Plans (FAS 158) effective December 31,
revenues of trucks and related aftermarket parts are                2006. FAS 158 requires an employer to recognize the
recorded by the Company when products are shipped                   funded status of each of its defined benefit post-
to dealers or customers, except for certain truck                   retirement plans as an asset or liability and to
                                                                    recognize changes in funded status as a component
shipments that are subject to a residual value
                                                                    of accumulated other comprehensive income. Upon
guarantee to the customer. Revenues related to these
                                                                    adoption, total assets were reduced by $114.7, total
shipments are recognized on a straight-line basis over
                                                                    liabilities were increased by $45.5 and stockholders’
the guarantee period (see Note G). At the time certain
                                                                    equity was reduced by $160.5, net of tax.
truck and parts sales to a dealer are recognized, the
                                                                       The Company adopted FASB Interpretation No. 48,
Company records an estimate of the future sales
incentive costs related to such sales. The estimate is              Accounting for Uncertainty in Income Taxes (FIN 48)
based on historical data and announced incentive                    effective January 1, 2007 with no significant effect on
programs.                                                           the Company’s consolidated financial statements. See
    Interest income from finance and other receivables              Note M for further information concerning income
is recognized using the interest method. Certain loan               taxes.
origination costs are deferred and amortized to                        In September 2006, the FASB issued Statement No.
interest income. For operating leases, rental revenue is            157, Fair Value Measurements (FAS 157). FAS 157
recognized on a straight-line basis over the lease term.            defines fair value and expands disclosures about fair
Recognition of interest income and rental revenue                   value measurements and is effective January 1, 2008.
is suspended when management determines that                        Adoption of FAS 157 is not expected to have a
collection is not probable (generally after 90 days                 material effect on the Company’s consolidated
past the contractual due date). Recognition is resumed              financial statements.
if the receivable becomes contractually current and the                In February 2007, the FASB issued Statement No.
collection of amounts is again considered probable.                 159, The Fair Value Option for Financial Assets and
    Foreign Currency Translation: For most of                       Financial Liabilities (FAS 159). This Statement, which
PACCAR’s foreign subsidiaries, the local currency                   is effective January 1, 2008 for PACCAR, permits
is the functional currency. All assets and liabilities              entities to measure most financial instruments at fair
are translated at year-end exchange rates and all                   value if desired and requires that unrealized gains and
income statement amounts are translated at the                      losses on items for which the option has been elected
weighted average rates for the period. Translation                  to be reported in earnings. The Company does not
adjustments are recorded in accumulated other                       expect adoption of FAS 159 to have a material effect
comprehensive income (loss), a component of                         on its consolidated financial statements.
stockholders’ equity.                                                  Reclassifications: Certain prior-year amounts have
    PACCAR uses the U.S. dollar as the functional                   been reclassified to conform to the 2007 presentation.
currency for its Mexican subsidiaries. Accordingly,
inventories, cost of sales, property, plant and
equipment, and depreciation are remeasured at
historical rates. Resulting gains and losses are included
in net income.


                                                                                               PACCAR Inc and Subsidiaries
NOTES                   TO          CONSOLiDATED                     FiNANCiAL             STATEMENTS

     December 31, 2007, 2006 and 2005 (currencies in millions)


     b.   i N v E S T M E N T S i N M A R K E TA b L E S E C U R i T i E S             C. iNvENTORiES

     The Company’s investments in marketable securities                                Inventories include the following:
     are classified as available-for-sale. These investments
                                                                                                                               2007
                                                                                       At December 31,                                    2006
     are stated at fair value with any unrealized gains or
                                                                                                                            $ 422.7
                                                                                       Finished products                               $ 365.4
     losses, net of tax, included as a component of
                                                                                       Work in process and raw
     accumulated other comprehensive income. Gross
                                                                                                                              355.0
                                                                                          materials                                      472.1
     realized and unrealized gains and losses were
                                                                                                                              777.7      837.5
     not significant for any of the three years ended
                                                                                                                            (149.4)
                                                                                       Less LIFO reserve                               (143.8)
     December 31, 2007.
                                                                                                                            $ 628.3    $ 693.7
        The cost of marketable debt securities is adjusted
     for amortization of premiums and accretion of
                                                                                          Inventories are stated at the lower of cost or market.
     discounts to maturity. Amortization, accretion, interest
                                                                                       Cost of inventories in the United States is determined
     and dividend income and realized gains and losses are
                                                                                       principally by the last-in, first-out (LIFO) method.
     included in investment income. The cost of securities
                                                                                       Cost of all other inventories is determined principally
     sold is based on the specific identification method.
                                                                                       by the first-in, first-out (FIFO) method. Inventories
        Marketable debt securities consisted of the
                                                                                       valued using the LIFO method comprised 40% and
     following at December 31:
                                                                                       53% of consolidated inventories before deducting the
                                                             amortized         fair    LIFO reserve at December 31, 2007 and 2006.
     2007                                                         cost        value
                                                                 $ 554.0     $ 558.4
     U.S. tax-exempt securities
     Non U.S. corporate
                                                                   113.7      113.0
       securities
     Non U.S. government
                                                                    92.7        92.5
       securities
                                                                    15.0        14.6
     Other debt securities
                                                                 $ 775.4     $ 778.5

                                                             amortized         fair
     2006                                                         cost        value
     U.S. tax-exempt securities                                  $ 752.3     $ 750.9
     U.S. government securities                                     59.4        58.5
     Other debt securities                                          12.2        12.3
                                                                 $ 823.9     $ 821.7

        Contractual maturities at December 31, 2007, were
     as follows:
                                                             amortized         fair
     Maturities:                                                  cost        value
                                                                 $ 90.2      $ 90.2
     Within one year
                                                                   609.5       612.5
     One to five years
                                                                     1.1         1.1
     Five to ten years
                                                                    74.6        74.7
     10 or more years
                                                                 $ 775.4     $ 778.5

        Marketable debt securities included $75.8 and
     $128.4 of variable rate demand obligations (VRDOs)
     at December 31, 2007 and 2006, respectively. VRDOs
     are debt instruments with long-term scheduled
     maturities which have interest rates that reset
     periodically.
NOTES                  TO         CONSOLiDATED                     FiNANCiAL                         STATEMENTS

December 31, 2007, 2006 and 2005 (currencies in millions)


D.   F i N A N C E A N D O T H E R R E C E i vA b L E S                            The allowance for losses on Truck and Other and                                9
                                                                                Financial Services receivables is summarized as
Finance and other receivables consist primarily of
                                                                                follows:
receivables from loans and financing leases resulting
from truck sales, loan and leasing activity. Finance and                                                                                truck        financial
                                                                                                                                    and other          services
other receivables include the following:
                                                                                Balance, December 31, 2004                                 $ 12.7      $ 127.4
                                                              2007
At December 31,                                                          2006
                                                                                Provision for losses                                           .3         40.4
                                                          $4,325.9
Loans                                                                $4,226.7   Net losses                                                    (.5)       (19.3)
                                                           2,816.7
Retail direct financing leases                                        2,322.1   Currency translation                                         (1.6)        (3.3)
                                                             908.1
Sales-type finance leases                                               909.2   Balance, December 31, 2005                                   10.9        145.2
                                                           1,554.6
Dealer wholesale financing                                            1,562.6   Provision for losses                                           .3         33.8
                                                             108.9
Interest and other receivables                                          112.1   Net losses                                                   (6.0)       (13.9)
Unearned interest:                                                              Currency translation                                           .5          3.9
                                                            (495.4)
   Finance leases                                                    (421.0)
                                                                                Balance, December 31, 2006                                    5.7        169.0
                                                           9,218.8  8,711.7     Provision for losses                                           .2         41.0
                                                            (193.4)
Less allowance for losses                                            (169.0)    Net losses                                                    (.5)       (25.8)
                                                          $9,025.4 $8,542.7     Acquisitions                                                   .2          1.8
                                                                                Currency translation                                          1.9          7.4
   Terms for substantially all finance and other                                Balance, December 31, 2007                                 $ 7.5       $ 193.4
receivables range up to 60 months. Annual payments
due on loans beginning January 1, 2008, are $1,663.8,                              The Company’s customers are principally concen-
$1,171.0, $876.5, $530.9, $236.4 and $25.5 thereafter.                          trated in the transportation industry in North America
Annual minimum lease payments due on finance                                    and Europe. There are no significant concentrations
leases beginning January 1, 2008, are $1,051.9,                                 of credit risk in terms of a single customer. Generally,
$930.9, $722.4, $472.6, $224.1 and $106.3 thereafter.                           Truck and Other and Financial Services receivables are
Repayment experience indicates that some receivables                            collateralized by the related equipment and parts.
will be paid prior to contract maturity, while others
may be extended or revised.                                                     F.   P R O P E RT y, P L A N T A N D E q U i P M E N T
   The effects of sales-type leases, dealer direct loans
                                                                                Property, plant and equipment include the following:
and wholesale financing of new trucks are shown in
the consolidated statements of cash flows as operating                                                                                       2007
                                                                                At December 31,                                                           2006
activities since they finance the sale of company                                                                                        $ 179.3
                                                                                Land                                                                 $ 142.5
inventory. Included in Loans are dealer direct loans                                                                                        847.6
                                                                                Buildings                                                               731.3
on the sale of new trucks of $198.2 and $220.4 as of                                                                                      2,206.9
                                                                                Machinery and equipment                                               1,838.0
December 31, 2007 and 2006. Estimated residual                                                                                            3,233.8     2,711.8
values included with finance leases amounted to                                 Less allowance for
$216.6 in 2007 and $173.7 in 2006.                                                                                                       (1,591.2) (1,364.6)
                                                                                  depreciation
                                                                                                                                         $1,642.6 $1,347.2
E.   A L L O wA N C E F O R L O S S E S

Receivables are charged to the allowance for losses                                Property, plant and equipment are stated at cost.
when, in the judgment of management, they are                                   Depreciation is computed principally by the straight-
deemed uncollectible (generally upon repossession                               line method based upon the estimated useful lives of
of the collateral). The provision for losses on finance,                        the various classes of assets, which range as follows:
trade and other receivables is charged to income in an
                                                                                Buildings                                                       30-40 years
amount sufficient to maintain the allowance for losses
                                                                                Machinery and equipment                                          5-12 years
at a level considered adequate to cover estimated credit
losses.


                                                                                                                          PACCAR Inc and Subsidiaries
PACCAR-07-AR-v2
PACCAR-07-AR-v2
PACCAR-07-AR-v2
PACCAR-07-AR-v2
PACCAR-07-AR-v2
PACCAR-07-AR-v2
PACCAR-07-AR-v2
PACCAR-07-AR-v2
PACCAR-07-AR-v2
PACCAR-07-AR-v2
PACCAR-07-AR-v2
PACCAR-07-AR-v2
PACCAR-07-AR-v2
PACCAR-07-AR-v2
PACCAR-07-AR-v2

Weitere ähnliche Inhalte

Was ist angesagt?

clearchannel 29
clearchannel 29clearchannel 29
clearchannel 29finance31
 
raytheon Q4 Earnings Presentation
raytheon Q4 Earnings Presentationraytheon Q4 Earnings Presentation
raytheon Q4 Earnings Presentationfinance12
 
4Q 07 EARNINGS SLIDES
4Q 07 EARNINGS SLIDES4Q 07 EARNINGS SLIDES
4Q 07 EARNINGS SLIDESfinance22
 
oshkosh Q107_Slides
oshkosh   Q107_Slidesoshkosh   Q107_Slides
oshkosh Q107_Slidesfinance44
 
bnsf 3Q 2007 investors_Report
bnsf 3Q 2007 investors_Reportbnsf 3Q 2007 investors_Report
bnsf 3Q 2007 investors_Reportfinance16
 
Community Market Report | August 2012
Community Market Report | August 2012Community Market Report | August 2012
Community Market Report | August 2012Charter One Realty
 
Raytheon Reports 2007 First Quarter Results
Raytheon Reports 2007 First Quarter ResultsRaytheon Reports 2007 First Quarter Results
Raytheon Reports 2007 First Quarter Resultsfinance12
 
IMPERIAL results presentation interim 2013
IMPERIAL results presentation interim 2013IMPERIAL results presentation interim 2013
IMPERIAL results presentation interim 2013IMPERIAL Logistics
 
Patrick D. Campbell Senior Vice President and Chief Financial Officer
 	Patrick D. Campbell Senior Vice President and Chief Financial Officer 	Patrick D. Campbell Senior Vice President and Chief Financial Officer
Patrick D. Campbell Senior Vice President and Chief Financial Officerfinance10
 
Rallis India - RU2QFY2011
Rallis India - RU2QFY2011Rallis India - RU2QFY2011
Rallis India - RU2QFY2011Angel Broking
 
ConAgra QAFY06Q1
ConAgra QAFY06Q1ConAgra QAFY06Q1
ConAgra QAFY06Q1finance21
 
Dishman ru4 qfy2010-310510
Dishman ru4 qfy2010-310510Dishman ru4 qfy2010-310510
Dishman ru4 qfy2010-310510Angel Broking
 
Dchl ru4 qfy2010-140510
Dchl ru4 qfy2010-140510Dchl ru4 qfy2010-140510
Dchl ru4 qfy2010-140510Angel Broking
 
oe E. Harlan Executive Vice President, Electro and Communications Business
oe E. Harlan Executive Vice President, Electro and Communications Businessoe E. Harlan Executive Vice President, Electro and Communications Business
oe E. Harlan Executive Vice President, Electro and Communications Businessfinance10
 
L&t ru4 qfy2010-170510
L&t ru4 qfy2010-170510L&t ru4 qfy2010-170510
L&t ru4 qfy2010-170510Angel Broking
 
3Q10 Fact Sheet
3Q10 Fact Sheet 3Q10 Fact Sheet
3Q10 Fact Sheet Gafisa RI !
 
UBS Best of Americas
	UBS Best of Americas	UBS Best of Americas
UBS Best of Americasfinance10
 

Was ist angesagt? (20)

clearchannel 29
clearchannel 29clearchannel 29
clearchannel 29
 
raytheon Q4 Earnings Presentation
raytheon Q4 Earnings Presentationraytheon Q4 Earnings Presentation
raytheon Q4 Earnings Presentation
 
4Q 07 EARNINGS SLIDES
4Q 07 EARNINGS SLIDES4Q 07 EARNINGS SLIDES
4Q 07 EARNINGS SLIDES
 
oshkosh Q107_Slides
oshkosh   Q107_Slidesoshkosh   Q107_Slides
oshkosh Q107_Slides
 
bnsf 3Q 2007 investors_Report
bnsf 3Q 2007 investors_Reportbnsf 3Q 2007 investors_Report
bnsf 3Q 2007 investors_Report
 
Community Market Report | August 2012
Community Market Report | August 2012Community Market Report | August 2012
Community Market Report | August 2012
 
OSK_101606
OSK_101606OSK_101606
OSK_101606
 
2011 2nd Half & Full Year, Asia Pacific TPI Index
2011 2nd Half & Full Year, Asia Pacific TPI Index2011 2nd Half & Full Year, Asia Pacific TPI Index
2011 2nd Half & Full Year, Asia Pacific TPI Index
 
2005 Results
2005 Results2005 Results
2005 Results
 
Raytheon Reports 2007 First Quarter Results
Raytheon Reports 2007 First Quarter ResultsRaytheon Reports 2007 First Quarter Results
Raytheon Reports 2007 First Quarter Results
 
IMPERIAL results presentation interim 2013
IMPERIAL results presentation interim 2013IMPERIAL results presentation interim 2013
IMPERIAL results presentation interim 2013
 
Patrick D. Campbell Senior Vice President and Chief Financial Officer
 	Patrick D. Campbell Senior Vice President and Chief Financial Officer 	Patrick D. Campbell Senior Vice President and Chief Financial Officer
Patrick D. Campbell Senior Vice President and Chief Financial Officer
 
Rallis India - RU2QFY2011
Rallis India - RU2QFY2011Rallis India - RU2QFY2011
Rallis India - RU2QFY2011
 
ConAgra QAFY06Q1
ConAgra QAFY06Q1ConAgra QAFY06Q1
ConAgra QAFY06Q1
 
Dishman ru4 qfy2010-310510
Dishman ru4 qfy2010-310510Dishman ru4 qfy2010-310510
Dishman ru4 qfy2010-310510
 
Dchl ru4 qfy2010-140510
Dchl ru4 qfy2010-140510Dchl ru4 qfy2010-140510
Dchl ru4 qfy2010-140510
 
oe E. Harlan Executive Vice President, Electro and Communications Business
oe E. Harlan Executive Vice President, Electro and Communications Businessoe E. Harlan Executive Vice President, Electro and Communications Business
oe E. Harlan Executive Vice President, Electro and Communications Business
 
L&t ru4 qfy2010-170510
L&t ru4 qfy2010-170510L&t ru4 qfy2010-170510
L&t ru4 qfy2010-170510
 
3Q10 Fact Sheet
3Q10 Fact Sheet 3Q10 Fact Sheet
3Q10 Fact Sheet
 
UBS Best of Americas
	UBS Best of Americas	UBS Best of Americas
UBS Best of Americas
 

Andere mochten auch

PCARJune2005_10-Q
PCARJune2005_10-QPCARJune2005_10-Q
PCARJune2005_10-Qfinance17
 
computer sciences FY 2001 Q2
computer sciences FY 2001 Q2computer sciences FY 2001 Q2
computer sciences FY 2001 Q2finance17
 
southern 2004 4th
southern 2004 4thsouthern 2004 4th
southern 2004 4thfinance17
 
southern 2006 1st
southern 2006 1stsouthern 2006 1st
southern 2006 1stfinance17
 
PCAR June 2004_10-Q
PCAR June 2004_10-QPCAR June 2004_10-Q
PCAR June 2004_10-Qfinance17
 
PCAR June 2006_10-Q
PCAR June 2006_10-QPCAR June 2006_10-Q
PCAR June 2006_10-Qfinance17
 

Andere mochten auch (6)

PCARJune2005_10-Q
PCARJune2005_10-QPCARJune2005_10-Q
PCARJune2005_10-Q
 
computer sciences FY 2001 Q2
computer sciences FY 2001 Q2computer sciences FY 2001 Q2
computer sciences FY 2001 Q2
 
southern 2004 4th
southern 2004 4thsouthern 2004 4th
southern 2004 4th
 
southern 2006 1st
southern 2006 1stsouthern 2006 1st
southern 2006 1st
 
PCAR June 2004_10-Q
PCAR June 2004_10-QPCAR June 2004_10-Q
PCAR June 2004_10-Q
 
PCAR June 2006_10-Q
PCAR June 2006_10-QPCAR June 2006_10-Q
PCAR June 2006_10-Q
 

Ähnlich wie PACCAR-07-AR-v2

.progressive mreport-09/06
.progressive mreport-09/06.progressive mreport-09/06
.progressive mreport-09/06finance18
 
.progressive mreport-09/06
.progressive mreport-09/06.progressive mreport-09/06
.progressive mreport-09/06finance18
 
goodrich 3Q06
goodrich  3Q06goodrich  3Q06
goodrich 3Q06finance44
 
goodrich 3Q06
goodrich  3Q06goodrich  3Q06
goodrich 3Q06finance44
 
.rockwellautomation AR2004
.rockwellautomation AR2004.rockwellautomation AR2004
.rockwellautomation AR2004finance39
 
ROCKWELL AUTOMATION AR2004
ROCKWELL AUTOMATION  AR2004ROCKWELL AUTOMATION  AR2004
ROCKWELL AUTOMATION AR2004finance39
 
advance auto parts 2004_ar
advance auto parts 2004_aradvance auto parts 2004_ar
advance auto parts 2004_arfinance48
 
advance auto parts 2004_ar
advance auto parts 2004_aradvance auto parts 2004_ar
advance auto parts 2004_arfinance48
 
progressive mreport-06/04
progressive mreport-06/04progressive mreport-06/04
progressive mreport-06/04finance18
 
progressive mreport-06/04
progressive mreport-06/04progressive mreport-06/04
progressive mreport-06/04finance18
 
danaher 06-3Q-REL
danaher 06-3Q-RELdanaher 06-3Q-REL
danaher 06-3Q-RELfinance24
 
.progressive mreport-11/06
.progressive mreport-11/06.progressive mreport-11/06
.progressive mreport-11/06finance18
 
.progressive mreport-11/06
.progressive mreport-11/06.progressive mreport-11/06
.progressive mreport-11/06finance18
 
Raytheon Reports 2003 Fourth Quarter Results
	Raytheon Reports 2003 Fourth Quarter Results	Raytheon Reports 2003 Fourth Quarter Results
Raytheon Reports 2003 Fourth Quarter Resultsfinance12
 
raytheon Q3 Earnings Release
raytheon Q3 Earnings Releaseraytheon Q3 Earnings Release
raytheon Q3 Earnings Releasefinance12
 
.progressive mreport-12/06
.progressive mreport-12/06.progressive mreport-12/06
.progressive mreport-12/06finance18
 
.progressive mreport-12/06
.progressive mreport-12/06.progressive mreport-12/06
.progressive mreport-12/06finance18
 
csx Citigroup11.06.07
csx  Citigroup11.06.07csx  Citigroup11.06.07
csx Citigroup11.06.07finance27
 
csx Citigroup11.06.07
csx  Citigroup11.06.07csx  Citigroup11.06.07
csx Citigroup11.06.07finance27
 

Ähnlich wie PACCAR-07-AR-v2 (20)

.progressive mreport-09/06
.progressive mreport-09/06.progressive mreport-09/06
.progressive mreport-09/06
 
.progressive mreport-09/06
.progressive mreport-09/06.progressive mreport-09/06
.progressive mreport-09/06
 
goodrich 3Q06
goodrich  3Q06goodrich  3Q06
goodrich 3Q06
 
goodrich 3Q06
goodrich  3Q06goodrich  3Q06
goodrich 3Q06
 
.rockwellautomation AR2004
.rockwellautomation AR2004.rockwellautomation AR2004
.rockwellautomation AR2004
 
ROCKWELL AUTOMATION AR2004
ROCKWELL AUTOMATION  AR2004ROCKWELL AUTOMATION  AR2004
ROCKWELL AUTOMATION AR2004
 
advance auto parts 2004_ar
advance auto parts 2004_aradvance auto parts 2004_ar
advance auto parts 2004_ar
 
advance auto parts 2004_ar
advance auto parts 2004_aradvance auto parts 2004_ar
advance auto parts 2004_ar
 
progressive mreport-06/04
progressive mreport-06/04progressive mreport-06/04
progressive mreport-06/04
 
progressive mreport-06/04
progressive mreport-06/04progressive mreport-06/04
progressive mreport-06/04
 
CBS Q4 06
CBS Q4 06CBS Q4 06
CBS Q4 06
 
danaher 06-3Q-REL
danaher 06-3Q-RELdanaher 06-3Q-REL
danaher 06-3Q-REL
 
.progressive mreport-11/06
.progressive mreport-11/06.progressive mreport-11/06
.progressive mreport-11/06
 
.progressive mreport-11/06
.progressive mreport-11/06.progressive mreport-11/06
.progressive mreport-11/06
 
Raytheon Reports 2003 Fourth Quarter Results
	Raytheon Reports 2003 Fourth Quarter Results	Raytheon Reports 2003 Fourth Quarter Results
Raytheon Reports 2003 Fourth Quarter Results
 
raytheon Q3 Earnings Release
raytheon Q3 Earnings Releaseraytheon Q3 Earnings Release
raytheon Q3 Earnings Release
 
.progressive mreport-12/06
.progressive mreport-12/06.progressive mreport-12/06
.progressive mreport-12/06
 
.progressive mreport-12/06
.progressive mreport-12/06.progressive mreport-12/06
.progressive mreport-12/06
 
csx Citigroup11.06.07
csx  Citigroup11.06.07csx  Citigroup11.06.07
csx Citigroup11.06.07
 
csx Citigroup11.06.07
csx  Citigroup11.06.07csx  Citigroup11.06.07
csx Citigroup11.06.07
 

Mehr von finance17

computer sciences equitygrant
computer sciences equitygrantcomputer sciences equitygrant
computer sciences equitygrantfinance17
 
computer sciences By Laws
computer sciences By Lawscomputer sciences By Laws
computer sciences By Lawsfinance17
 
computer sciences Restated
computer sciences Restatedcomputer sciences Restated
computer sciences Restatedfinance17
 
computer sciences Ethics
computer sciences Ethicscomputer sciences Ethics
computer sciences Ethicsfinance17
 
computer sciences Ethics Standards
computer sciences Ethics Standardscomputer sciences Ethics Standards
computer sciences Ethics Standardsfinance17
 
computer sciences Corp Gov Guide lines
computer sciences Corp Gov Guide linescomputer sciences Corp Gov Guide lines
computer sciences Corp Gov Guide linesfinance17
 
computer sciences FY 1997 Q1
computer sciences FY 1997 Q1computer sciences FY 1997 Q1
computer sciences FY 1997 Q1finance17
 
computer sciences FY 1997 Q2
computer sciences FY 1997 Q2computer sciences FY 1997 Q2
computer sciences FY 1997 Q2finance17
 
computer sciences FY 1998 Q1
computer sciences FY 1998 Q1computer sciences FY 1998 Q1
computer sciences FY 1998 Q1finance17
 
computer sciences FY 1998 Q2
computer sciences FY 1998 Q2computer sciences FY 1998 Q2
computer sciences FY 1998 Q2finance17
 
computer sciences FY 1998 Q3
computer sciences FY 1998 Q3computer sciences FY 1998 Q3
computer sciences FY 1998 Q3finance17
 
computer sciences FY 1999 Q1
computer sciences FY 1999 Q1computer sciences FY 1999 Q1
computer sciences FY 1999 Q1finance17
 
computer sciences FY 1999 Q2
computer sciences FY 1999 Q2computer sciences FY 1999 Q2
computer sciences FY 1999 Q2finance17
 
computer sciences FY 1999 Q3
computer sciences FY 1999 Q3computer sciences FY 1999 Q3
computer sciences FY 1999 Q3finance17
 
computer sciences FY 2000 Q1
computer sciences FY 2000 Q1computer sciences FY 2000 Q1
computer sciences FY 2000 Q1finance17
 
computer sciences FY 2000 Q2
computer sciences FY 2000 Q2computer sciences FY 2000 Q2
computer sciences FY 2000 Q2finance17
 
computer sciences FY 2000 Q3
computer sciences FY 2000 Q3computer sciences FY 2000 Q3
computer sciences FY 2000 Q3finance17
 
computer sciences FY 2001 Q1
computer sciences FY 2001 Q1computer sciences FY 2001 Q1
computer sciences FY 2001 Q1finance17
 
computer sciences FY 2001 Q3
computer sciences FY 2001 Q3computer sciences FY 2001 Q3
computer sciences FY 2001 Q3finance17
 
computer sciences FY 2002 Q1
computer sciences FY 2002 Q1computer sciences FY 2002 Q1
computer sciences FY 2002 Q1finance17
 

Mehr von finance17 (20)

computer sciences equitygrant
computer sciences equitygrantcomputer sciences equitygrant
computer sciences equitygrant
 
computer sciences By Laws
computer sciences By Lawscomputer sciences By Laws
computer sciences By Laws
 
computer sciences Restated
computer sciences Restatedcomputer sciences Restated
computer sciences Restated
 
computer sciences Ethics
computer sciences Ethicscomputer sciences Ethics
computer sciences Ethics
 
computer sciences Ethics Standards
computer sciences Ethics Standardscomputer sciences Ethics Standards
computer sciences Ethics Standards
 
computer sciences Corp Gov Guide lines
computer sciences Corp Gov Guide linescomputer sciences Corp Gov Guide lines
computer sciences Corp Gov Guide lines
 
computer sciences FY 1997 Q1
computer sciences FY 1997 Q1computer sciences FY 1997 Q1
computer sciences FY 1997 Q1
 
computer sciences FY 1997 Q2
computer sciences FY 1997 Q2computer sciences FY 1997 Q2
computer sciences FY 1997 Q2
 
computer sciences FY 1998 Q1
computer sciences FY 1998 Q1computer sciences FY 1998 Q1
computer sciences FY 1998 Q1
 
computer sciences FY 1998 Q2
computer sciences FY 1998 Q2computer sciences FY 1998 Q2
computer sciences FY 1998 Q2
 
computer sciences FY 1998 Q3
computer sciences FY 1998 Q3computer sciences FY 1998 Q3
computer sciences FY 1998 Q3
 
computer sciences FY 1999 Q1
computer sciences FY 1999 Q1computer sciences FY 1999 Q1
computer sciences FY 1999 Q1
 
computer sciences FY 1999 Q2
computer sciences FY 1999 Q2computer sciences FY 1999 Q2
computer sciences FY 1999 Q2
 
computer sciences FY 1999 Q3
computer sciences FY 1999 Q3computer sciences FY 1999 Q3
computer sciences FY 1999 Q3
 
computer sciences FY 2000 Q1
computer sciences FY 2000 Q1computer sciences FY 2000 Q1
computer sciences FY 2000 Q1
 
computer sciences FY 2000 Q2
computer sciences FY 2000 Q2computer sciences FY 2000 Q2
computer sciences FY 2000 Q2
 
computer sciences FY 2000 Q3
computer sciences FY 2000 Q3computer sciences FY 2000 Q3
computer sciences FY 2000 Q3
 
computer sciences FY 2001 Q1
computer sciences FY 2001 Q1computer sciences FY 2001 Q1
computer sciences FY 2001 Q1
 
computer sciences FY 2001 Q3
computer sciences FY 2001 Q3computer sciences FY 2001 Q3
computer sciences FY 2001 Q3
 
computer sciences FY 2002 Q1
computer sciences FY 2002 Q1computer sciences FY 2002 Q1
computer sciences FY 2002 Q1
 

Kürzlich hochgeladen

Independent Call Girl Number in Kurla Mumbai📲 Pooja Nehwal 9892124323 💞 Full ...
Independent Call Girl Number in Kurla Mumbai📲 Pooja Nehwal 9892124323 💞 Full ...Independent Call Girl Number in Kurla Mumbai📲 Pooja Nehwal 9892124323 💞 Full ...
Independent Call Girl Number in Kurla Mumbai📲 Pooja Nehwal 9892124323 💞 Full ...Pooja Nehwal
 
High Class Call Girls Nashik Maya 7001305949 Independent Escort Service Nashik
High Class Call Girls Nashik Maya 7001305949 Independent Escort Service NashikHigh Class Call Girls Nashik Maya 7001305949 Independent Escort Service Nashik
High Class Call Girls Nashik Maya 7001305949 Independent Escort Service NashikCall Girls in Nagpur High Profile
 
03_Emmanuel Ndiaye_Degroof Petercam.pptx
03_Emmanuel Ndiaye_Degroof Petercam.pptx03_Emmanuel Ndiaye_Degroof Petercam.pptx
03_Emmanuel Ndiaye_Degroof Petercam.pptxFinTech Belgium
 
Monthly Market Risk Update: April 2024 [SlideShare]
Monthly Market Risk Update: April 2024 [SlideShare]Monthly Market Risk Update: April 2024 [SlideShare]
Monthly Market Risk Update: April 2024 [SlideShare]Commonwealth
 
05_Annelore Lenoir_Docbyte_MeetupDora&Cybersecurity.pptx
05_Annelore Lenoir_Docbyte_MeetupDora&Cybersecurity.pptx05_Annelore Lenoir_Docbyte_MeetupDora&Cybersecurity.pptx
05_Annelore Lenoir_Docbyte_MeetupDora&Cybersecurity.pptxFinTech Belgium
 
The Economic History of the U.S. Lecture 18.pdf
The Economic History of the U.S. Lecture 18.pdfThe Economic History of the U.S. Lecture 18.pdf
The Economic History of the U.S. Lecture 18.pdfGale Pooley
 
20240429 Calibre April 2024 Investor Presentation.pdf
20240429 Calibre April 2024 Investor Presentation.pdf20240429 Calibre April 2024 Investor Presentation.pdf
20240429 Calibre April 2024 Investor Presentation.pdfAdnet Communications
 
VIP Call Girls Service Dilsukhnagar Hyderabad Call +91-8250192130
VIP Call Girls Service Dilsukhnagar Hyderabad Call +91-8250192130VIP Call Girls Service Dilsukhnagar Hyderabad Call +91-8250192130
VIP Call Girls Service Dilsukhnagar Hyderabad Call +91-8250192130Suhani Kapoor
 
VIP Call Girls LB Nagar ( Hyderabad ) Phone 8250192130 | ₹5k To 25k With Room...
VIP Call Girls LB Nagar ( Hyderabad ) Phone 8250192130 | ₹5k To 25k With Room...VIP Call Girls LB Nagar ( Hyderabad ) Phone 8250192130 | ₹5k To 25k With Room...
VIP Call Girls LB Nagar ( Hyderabad ) Phone 8250192130 | ₹5k To 25k With Room...Suhani Kapoor
 
TEST BANK For Corporate Finance, 13th Edition By Stephen Ross, Randolph Weste...
TEST BANK For Corporate Finance, 13th Edition By Stephen Ross, Randolph Weste...TEST BANK For Corporate Finance, 13th Edition By Stephen Ross, Randolph Weste...
TEST BANK For Corporate Finance, 13th Edition By Stephen Ross, Randolph Weste...ssifa0344
 
Call Girls Service Nagpur Maya Call 7001035870 Meet With Nagpur Escorts
Call Girls Service Nagpur Maya Call 7001035870 Meet With Nagpur EscortsCall Girls Service Nagpur Maya Call 7001035870 Meet With Nagpur Escorts
Call Girls Service Nagpur Maya Call 7001035870 Meet With Nagpur Escortsranjana rawat
 
High Class Call Girls Nagpur Grishma Call 7001035870 Meet With Nagpur Escorts
High Class Call Girls Nagpur Grishma Call 7001035870 Meet With Nagpur EscortsHigh Class Call Girls Nagpur Grishma Call 7001035870 Meet With Nagpur Escorts
High Class Call Girls Nagpur Grishma Call 7001035870 Meet With Nagpur Escortsranjana rawat
 
Lundin Gold April 2024 Corporate Presentation v4.pdf
Lundin Gold April 2024 Corporate Presentation v4.pdfLundin Gold April 2024 Corporate Presentation v4.pdf
Lundin Gold April 2024 Corporate Presentation v4.pdfAdnet Communications
 
Independent Lucknow Call Girls 8923113531WhatsApp Lucknow Call Girls make you...
Independent Lucknow Call Girls 8923113531WhatsApp Lucknow Call Girls make you...Independent Lucknow Call Girls 8923113531WhatsApp Lucknow Call Girls make you...
Independent Lucknow Call Girls 8923113531WhatsApp Lucknow Call Girls make you...makika9823
 
Instant Issue Debit Cards - High School Spirit
Instant Issue Debit Cards - High School SpiritInstant Issue Debit Cards - High School Spirit
Instant Issue Debit Cards - High School Spiritegoetzinger
 
The Economic History of the U.S. Lecture 30.pdf
The Economic History of the U.S. Lecture 30.pdfThe Economic History of the U.S. Lecture 30.pdf
The Economic History of the U.S. Lecture 30.pdfGale Pooley
 
VIP Kolkata Call Girl Serampore 👉 8250192130 Available With Room
VIP Kolkata Call Girl Serampore 👉 8250192130  Available With RoomVIP Kolkata Call Girl Serampore 👉 8250192130  Available With Room
VIP Kolkata Call Girl Serampore 👉 8250192130 Available With Roomdivyansh0kumar0
 
Malad Call Girl in Services 9892124323 | ₹,4500 With Room Free Delivery
Malad Call Girl in Services  9892124323 | ₹,4500 With Room Free DeliveryMalad Call Girl in Services  9892124323 | ₹,4500 With Room Free Delivery
Malad Call Girl in Services 9892124323 | ₹,4500 With Room Free DeliveryPooja Nehwal
 
Bladex Earnings Call Presentation 1Q2024
Bladex Earnings Call Presentation 1Q2024Bladex Earnings Call Presentation 1Q2024
Bladex Earnings Call Presentation 1Q2024Bladex
 
06_Joeri Van Speybroek_Dell_MeetupDora&Cybersecurity.pdf
06_Joeri Van Speybroek_Dell_MeetupDora&Cybersecurity.pdf06_Joeri Van Speybroek_Dell_MeetupDora&Cybersecurity.pdf
06_Joeri Van Speybroek_Dell_MeetupDora&Cybersecurity.pdfFinTech Belgium
 

Kürzlich hochgeladen (20)

Independent Call Girl Number in Kurla Mumbai📲 Pooja Nehwal 9892124323 💞 Full ...
Independent Call Girl Number in Kurla Mumbai📲 Pooja Nehwal 9892124323 💞 Full ...Independent Call Girl Number in Kurla Mumbai📲 Pooja Nehwal 9892124323 💞 Full ...
Independent Call Girl Number in Kurla Mumbai📲 Pooja Nehwal 9892124323 💞 Full ...
 
High Class Call Girls Nashik Maya 7001305949 Independent Escort Service Nashik
High Class Call Girls Nashik Maya 7001305949 Independent Escort Service NashikHigh Class Call Girls Nashik Maya 7001305949 Independent Escort Service Nashik
High Class Call Girls Nashik Maya 7001305949 Independent Escort Service Nashik
 
03_Emmanuel Ndiaye_Degroof Petercam.pptx
03_Emmanuel Ndiaye_Degroof Petercam.pptx03_Emmanuel Ndiaye_Degroof Petercam.pptx
03_Emmanuel Ndiaye_Degroof Petercam.pptx
 
Monthly Market Risk Update: April 2024 [SlideShare]
Monthly Market Risk Update: April 2024 [SlideShare]Monthly Market Risk Update: April 2024 [SlideShare]
Monthly Market Risk Update: April 2024 [SlideShare]
 
05_Annelore Lenoir_Docbyte_MeetupDora&Cybersecurity.pptx
05_Annelore Lenoir_Docbyte_MeetupDora&Cybersecurity.pptx05_Annelore Lenoir_Docbyte_MeetupDora&Cybersecurity.pptx
05_Annelore Lenoir_Docbyte_MeetupDora&Cybersecurity.pptx
 
The Economic History of the U.S. Lecture 18.pdf
The Economic History of the U.S. Lecture 18.pdfThe Economic History of the U.S. Lecture 18.pdf
The Economic History of the U.S. Lecture 18.pdf
 
20240429 Calibre April 2024 Investor Presentation.pdf
20240429 Calibre April 2024 Investor Presentation.pdf20240429 Calibre April 2024 Investor Presentation.pdf
20240429 Calibre April 2024 Investor Presentation.pdf
 
VIP Call Girls Service Dilsukhnagar Hyderabad Call +91-8250192130
VIP Call Girls Service Dilsukhnagar Hyderabad Call +91-8250192130VIP Call Girls Service Dilsukhnagar Hyderabad Call +91-8250192130
VIP Call Girls Service Dilsukhnagar Hyderabad Call +91-8250192130
 
VIP Call Girls LB Nagar ( Hyderabad ) Phone 8250192130 | ₹5k To 25k With Room...
VIP Call Girls LB Nagar ( Hyderabad ) Phone 8250192130 | ₹5k To 25k With Room...VIP Call Girls LB Nagar ( Hyderabad ) Phone 8250192130 | ₹5k To 25k With Room...
VIP Call Girls LB Nagar ( Hyderabad ) Phone 8250192130 | ₹5k To 25k With Room...
 
TEST BANK For Corporate Finance, 13th Edition By Stephen Ross, Randolph Weste...
TEST BANK For Corporate Finance, 13th Edition By Stephen Ross, Randolph Weste...TEST BANK For Corporate Finance, 13th Edition By Stephen Ross, Randolph Weste...
TEST BANK For Corporate Finance, 13th Edition By Stephen Ross, Randolph Weste...
 
Call Girls Service Nagpur Maya Call 7001035870 Meet With Nagpur Escorts
Call Girls Service Nagpur Maya Call 7001035870 Meet With Nagpur EscortsCall Girls Service Nagpur Maya Call 7001035870 Meet With Nagpur Escorts
Call Girls Service Nagpur Maya Call 7001035870 Meet With Nagpur Escorts
 
High Class Call Girls Nagpur Grishma Call 7001035870 Meet With Nagpur Escorts
High Class Call Girls Nagpur Grishma Call 7001035870 Meet With Nagpur EscortsHigh Class Call Girls Nagpur Grishma Call 7001035870 Meet With Nagpur Escorts
High Class Call Girls Nagpur Grishma Call 7001035870 Meet With Nagpur Escorts
 
Lundin Gold April 2024 Corporate Presentation v4.pdf
Lundin Gold April 2024 Corporate Presentation v4.pdfLundin Gold April 2024 Corporate Presentation v4.pdf
Lundin Gold April 2024 Corporate Presentation v4.pdf
 
Independent Lucknow Call Girls 8923113531WhatsApp Lucknow Call Girls make you...
Independent Lucknow Call Girls 8923113531WhatsApp Lucknow Call Girls make you...Independent Lucknow Call Girls 8923113531WhatsApp Lucknow Call Girls make you...
Independent Lucknow Call Girls 8923113531WhatsApp Lucknow Call Girls make you...
 
Instant Issue Debit Cards - High School Spirit
Instant Issue Debit Cards - High School SpiritInstant Issue Debit Cards - High School Spirit
Instant Issue Debit Cards - High School Spirit
 
The Economic History of the U.S. Lecture 30.pdf
The Economic History of the U.S. Lecture 30.pdfThe Economic History of the U.S. Lecture 30.pdf
The Economic History of the U.S. Lecture 30.pdf
 
VIP Kolkata Call Girl Serampore 👉 8250192130 Available With Room
VIP Kolkata Call Girl Serampore 👉 8250192130  Available With RoomVIP Kolkata Call Girl Serampore 👉 8250192130  Available With Room
VIP Kolkata Call Girl Serampore 👉 8250192130 Available With Room
 
Malad Call Girl in Services 9892124323 | ₹,4500 With Room Free Delivery
Malad Call Girl in Services  9892124323 | ₹,4500 With Room Free DeliveryMalad Call Girl in Services  9892124323 | ₹,4500 With Room Free Delivery
Malad Call Girl in Services 9892124323 | ₹,4500 With Room Free Delivery
 
Bladex Earnings Call Presentation 1Q2024
Bladex Earnings Call Presentation 1Q2024Bladex Earnings Call Presentation 1Q2024
Bladex Earnings Call Presentation 1Q2024
 
06_Joeri Van Speybroek_Dell_MeetupDora&Cybersecurity.pdf
06_Joeri Van Speybroek_Dell_MeetupDora&Cybersecurity.pdf06_Joeri Van Speybroek_Dell_MeetupDora&Cybersecurity.pdf
06_Joeri Van Speybroek_Dell_MeetupDora&Cybersecurity.pdf
 

PACCAR-07-AR-v2

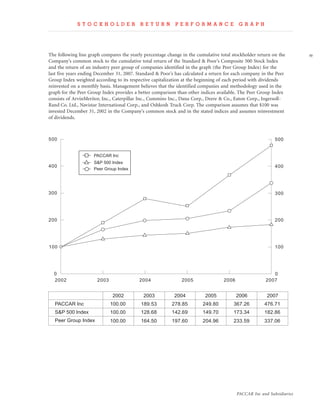
  • 1. STOCKHOLDER RETURN PERFORMANCE GRAPH The following line graph compares the yearly percentage change in the cumulative total stockholder return on the  Company’s common stock to the cumulative total return of the Standard & Poor’s Composite 500 Stock Index and the return of an industry peer group of companies identified in the graph (the Peer Group Index) for the last five years ending December 31, 2007. Standard & Poor’s has calculated a return for each company in the Peer Group Index weighted according to its respective capitalization at the beginning of each period with dividends reinvested on a monthly basis. Management believes that the identified companies and methodology used in the graph for the Peer Group Index provides a better comparison than other indices available. The Peer Group Index consists of ArvinMeritor, Inc., Caterpillar Inc., Cummins Inc., Dana Corp., Deere & Co., Eaton Corp., Ingersoll- Rand Co. Ltd., Navistar International Corp., and Oshkosh Truck Corp. The comparison assumes that $100 was invested December 31, 2002 in the Company’s common stock and in the stated indices and assumes reinvestment of dividends. 500 500 PACCAR Inc S&P 500 Index 400 400 Peer Group Index 300 300 200 200 100 100 0 0 2002 2003 2004 2005 2006 2007 2002 2003 2004 2005 2006 2007 PACCAR Inc 100.00 189.53 278.85 249.80 367.26 476.71 S&P 500 Index 100.00 128.68 142.69 149.70 173.34 182.86 Peer Group Index 100.00 164.50 197.60 204.96 233.59 337.06 PACCAR Inc and Subsidiaries
  • 2. ManageMent’s discussion and analysis of financial condition and results of operations (tables in millions, except truck unit and per share data) r e s u lt s o f o p e r at i o n s : Selling, general and administrative (SG&A) expense  for Truck and Other increased to $491.4 million in 2007 2006 2005 2007 compared to $457.3 million in 2006. This was Net sales and revenues: due to expanded sales and higher production levels in Truck and the Company’s foreign operations and the translation $14,030.4 Other $15,503.3 $13,298.4 of stronger foreign currencies, somewhat offset by 1,191.3 Financial Services 950.8 759.0 lower spending in the U.S. and Canada. As a percent $15,221.7 $16,454.1 $14,057.4 of revenues, SG&A expense increased to 3.5% in 2007 from 3.0% in 2006. The Company continues to implement Six Sigma initiatives and process improve- Income before taxes: ments in all facets of the business. Truck and Investment income of $95.4 million in 2007 $ 1,384.8 $ 1,846.6 $ 1,516.8 Other increased from $81.3 million in 2006 due to higher Financial interest rates. 284.1 Services 247.4 199.9 The 2007 effective income tax rate was 30.4% Investment compared to 31.2% in 2006. The lower 2007 effective 95.4 income 81.3 56.9 income tax rate reflects a higher proportion of foreign (537.0) Income taxes (679.3) (640.4) earnings. $ 1,227.3 $ 1,496.0 $ 1,133.2 Net Income The Company’s return on revenues was 8.1% in Diluted Earnings 2007 compared to 9.1% in 2006. $ 3.29 $ 3.97 $ 2.92 Per Share Truck Overview: PACCAR’s truck segment, which includes the PACCAR is a global technology company whose manufacture and distribution of trucks and related principal businesses include the design, manufacture aftermarket parts, accounted for 91%, 93% and 94% and distribution of high-quality, light-, medium- and of revenues in 2007, 2006 and 2005, respectively. In heavy-duty commercial trucks and related aftermarket North America, trucks are sold under the Kenworth parts and the financing and leasing of its trucks and and Peterbilt nameplates and, in Europe, under the related equipment. The Company also manufactures DAF nameplate. and markets industrial winches. Consolidated net sales and revenue were $15.22 billion in 2007 and $16.45 billion in 2006. Current 2007 2006 2005 year results reflect strong demand for the Company’s Truck net sales high-quality trucks in all markets outside the U.S. and $13,853.3 and revenues $15,367.3 $13,196.1 Canada, and continued global growth in aftermarket Truck income parts and financial services. Financial Services revenues $ 1,360.0 before taxes $ 1,848.8 $ 1,520.2 increased to $1.19 billion in 2007 from $.95 billion in 2006. PACCAR achieved net income of $1.23 billion ($3.29 per diluted share) in 2007, the second best result in the Company’s 102 year history. Solid results were achieved in the Truck and Other businesses from strong growth in revenue, increased margins and on- going cost control in the Company’s foreign operations, offset by lower truck sales and margins in the U.S. and Canada. Financial Services income before taxes increased 15% to a record $284.1 million compared to $247.4 million in 2006 as a result of strong asset growth and stable finance margins. Research and Development expenditures were $255.5 million in 2007, an increase of 57% from $163.1 million in 2006 due to increased vehicle and engine development programs.
  • 3. sales division. Combined truck and parts sales in The Company’s new truck deliveries are summarized  these markets accounted for 16% of truck segment below: sales and 19% of truck segment profit. 2007 2006 2005 PACCAR’s worldwide aftermarket parts revenues 44,700 United States 82,600 71,900 were $2.29 billion in 2007, an increase of 18% 8,300 Canada 12,900 10,900 compared to $1.94 billion in 2006. Aftermarket parts sales increased in all major markets from a growing 53,000 U.S. and Canada 95,500 82,800 truck population, expansion of parts distribution 60,100 Europe 55,900 52,200 centers and focused sales efforts. Mexico, Australia Truck segment gross margin as a percentage of net 20,800 and other 15,400 13,500 sales and revenues was 14.7% in 2007 and 15.7% in 133,900 Total units 166,800 148,500 2006. Improved operating efficiencies and strong demand for the Company’s products outside the U.S. 2007 Compared to 2006: and Canada were dampened by a weak truck market PACCAR’s worldwide truck sales and revenues were in the U.S. and Canada. Higher material costs from $13.85 billion in 2007 compared to $15.37 billion in suppliers, including the impacts of higher crude oil, 2006 due to lower demand for the Company’s trucks copper, steel and other commodities negatively in the U.S. and Canada, somewhat offset by higher impacted truck margins. demand for trucks in all other markets and higher global demand for related aftermarket parts. The 2006 Compared to 2005: impact of a weaker U.S. dollar relative to the PACCAR’s worldwide truck sales and revenues Company’s other currencies (primarily the euro) increased to $15.37 billion in 2006 due to high increased revenues and pretax profit by approximately demand for the Company’s trucks and related $590 million and $90 million, respectively. aftermarket parts in all major markets. Truck income before taxes was $1.36 billion Truck income before taxes was $1.85 billion compared to $1.85 billion in 2006. In the U.S. and compared to $1.52 billion in 2005. The increase from Canada, Peterbilt and Kenworth delivered 53,000 the prior year was due to higher production rates, heavy and medium-duty trucks during 2007, a growing aftermarket part sales and improved truck decrease of 45% from 2006, due to the lower truck margins. market. The Class 8 market decreased to 175,800 In the U.S. and Canada, Peterbilt and Kenworth units in 2007 from a record 322,500 units in 2006, delivered 95,500 medium and heavy trucks during reflecting a 2006 pre-buy and a slowdown in the 2006, an increase of 15% over 2005 due to overall housing and automotive sectors. PACCAR’s market market growth and increased market share. The Class share increased to 26.4% in 2007 from 25.3% in 8 market increased 12% to 322,500 units in 2006 from 2006. The medium-duty market decreased 21% to 287,500 in 2005. PACCAR’s market share increased to 85,000 units. 25.3% in 2006 from 23.1% in 2005. The total In Europe, DAF trucks delivered 60,100 units medium-duty market increased 3% to 107,000 units. during 2007, an 8% increase over 2006. The 15 tonne In Europe, DAF trucks delivered 55,900 units and above truck market in Western and Central Europe during 2006, an increase of 7% over 2005. The 15 improved to 340,000 units, a 10% increase from 2006 tonne and above truck market improved to 308,900 levels. DAF’s 2007 market share of the 15 tonne and units, a 7% increase from 2005 levels. DAF increased above market was 13.9% compared to 14.3% in 2006. its share of the 15 tonne and above market to 14.3% DAF market share in the 6 to 15 tonne market was in 2006 from 13.6% in 2005. DAF market share in the 8.3% in 2007 and 9.2% in 2006. Truck and parts sales 6 to 15 tonne market was 9.2% for 2006 and 2005. in Europe represented 46% of PACCAR’s total truck Truck unit deliveries in Mexico, Australia and other segment net sales and revenues in 2007 compared to countries outside the Company’s primary markets 28% in 2006. increased 14%. Combined truck and parts sales in Truck unit deliveries in Mexico, Australia and these markets accounted for 10% of total truck other countries outside the Company’s primary segment sales and 9% of truck segment profit in 2006. markets increased 35%. Deliveries to customers in South America, Africa and Asia are sold through PACCAR International, the Company’s international PACCAR Inc and Subsidiaries
  • 4. due to higher asset levels and higher interest rates, PACCAR’s worldwide aftermarket parts revenues of  offset partly by a higher cost of debt. $1.94 billion increased from 2005 due to a growing Net portfolio charge-offs were $25.8 million truck population and systems integration with dealers. compared to $13.9 million in 2006 due to higher Truck segment gross margin as a percentage of net charge-offs in the U.S. and Canada. At December 31, sales and revenues improved to 15.7% in 2006 from 2007, the earning asset portfolio quality was excellent 15.4% in 2005 as a result of improved operating with the percentage of accounts 30+ days past-due at efficiencies and strong demand for the Company’s 2.0%, up from 1.2% at the end of 2006, primarily due products. to increased past due accounts in the U.S. and Canada. During the year, PFS expanded its financing Truck Outlook operations into Poland and now operates in 18 Continued economic softness in the U.S. and Canada countries worldwide. is currently forecast to dampen demand for heavy- duty trucks for at least the first half of 2008. Industry 2006 Compared to 2005: retail sales are expected to remain level to slightly PACCAR Financial Services revenues increased 25% to higher than 2007 at 175,000–215,000 trucks. Western $950.8 million due to higher earning assets worldwide and Central European heavy-duty registrations for and higher interest rates. New business volume was a 2008 are projected to remain strong at 330,000– record $4.24 billion, up 14% on higher truck sales 350,000 units. Demand for the Company’s products levels and solid market share. in Mexico, Australia and international markets is Income before taxes increased 24% to a record expected to remain strong. $247.4 million from $199.9 million in 2005. This improvement was primarily due to higher finance Financial Services gross profit and lower credit losses, partly offset by an The Financial Services segment, which includes wholly increase in selling, general and administrative expenses owned subsidiaries in North America, Europe and to support business growth. The increase in finance Australia, derives its earnings primarily from financing gross profit was due to higher asset levels and higher or leasing PACCAR products. Over the last ten years, interest rates, offset partly by a higher cost of debt. the asset portfolio and income before taxes have The lower provision for losses resulted from lower net grown at a compound annual rate of 14%. portfolio charge-offs. 2007 2006 2005 Financial Services Outlook Financial Services: The outlook for the Financial Services segment is Average earning principally dependent on the generation of new $10,158.0 assets $8,746.0 $7,389.0 business volume and the related spread between the 1,191.3 Revenues 950.8 759.0 asset yields and the borrowing costs on new business, Income before as well as the level of credit losses experienced. Assets 284.1 taxes 247.4 199.9 in the U.S. and Canada are not likely to increase until the new truck market recovers. Asset growth is likely 2007 Compared to 2006: in Europe due to an expected increase in DAF truck PACCAR Financial Services (PFS) revenues increased deliveries due to a strong market. 25% to $1.19 billion due to higher earning assets The segment is exposed to reduced liquidity in worldwide and higher interest rates. New business the public debt markets. PFS does not anticipate the volume was $3.94 billion in 2007 compared to $4.24 impact of reduced liquidity to materially impact its billion in 2006. PFS provided loan and lease financing ability to generate new business volume. for 29% of PACCAR new trucks delivered in 2007 The segment continues to be impacted by the risk compared to 25% in 2006. that serious economic weakness in North America Income before taxes increased 15% to a record and higher fuel costs may continue to exert negative $284.1 million from $247.4 million in 2006. This pressure on the profit margins of truck operators and improvement was primarily due to higher finance result in higher past-due accounts and increased gross profit, partly offset by an increase in selling, repossessions. general and administrative expenses to support business growth and a higher provision for losses on receivables. The increase in finance gross profit was
  • 5. Other Business Truck and Other  Included in Truck and Other is the Company’s winch The Company provides funding for working capital, manufacturing business. Sales from this business capital expenditures, research and development, represent approximately 1% of net sales for 2007, 2006 dividends, stock repurchases and other business and 2005. initiatives and commitments primarily from cash provided by operations. Management expects this method of funding to continue in the future. Long‑ l i q u i d i t y a n d c a p i ta l r e s o u r c e s : term debt was $23.6 million at December 31, 2007. 2007 2006 2005 Expenditures for property, plant and equipment in Cash and cash 2007 totaled a record $425.7 million compared to $1,858.1 equivalents $1,852.5 $1,698.9 $312.0 million in 2006. Major capital projects included Marketable debt the substantial completion of construction of a new 778.5 securities 821.7 591.4 parts distribution center in Hungary, completion of a parts distribution facility in Oklahoma and the $2,636.6 $2,674.2 $2,290.3 completion of a new engine test facility at DAF in the Netherlands. In addition, the Company made The Company’s total cash and marketable debt significant investments related to new product securities decreased $37.6 million in 2007. Cash development and plant capacity. Over the last ten provided by operations of $2,055.4 million was used years, the Company’s combined investments in primarily to pay dividends of $736.7 million, make worldwide capital projects and research and capital additions totaling $425.7 million and development totaled $3.33 billion. repurchase PACCAR stock for $360.5 million. Cash Spending for capital investments and research and required to originate new loans and leases was funded development in 2008 is expected to increase from 2007 by repayments of existing loans and leases as well as levels. In 2008, major projects will include the start of Financial Services borrowings. construction on an engine production and technology The Company has line of credit arrangements of facility in Mississippi and continued focus on engine $3.08 billion. The unused portion of these credit lines development, new product introductions and was $3.04 billion at December 31, 2007. Included in manufacturing efficiency improvements. these arrangements is a $2.7 billion bank facility, of which $1.7 billion matures in 2008 and $1.0 billion matures in 2012 and is primarily maintained to provide backup liquidity for commercial paper borrowings of the financial services companies. During the second half of 2007, PACCAR’s strong cash position and credit ratings enabled PFS to meet its funding requirements despite a decline in liquidity in the public debt markets. The Company believes its strong liquidity position and AA‑ investment grade credit rating will continue to provide financial stability and access to public debt markets at competitive interest rates. In October 2007, PACCAR’s Board of Directors approved the repurchase of $300 million of the Company’s common stock. PACCAR Inc and Subsidiaries
  • 6. Financial Services PACCAR believes its Financial Services companies  The Company funds its financial services activities will be able to continue funding receivables, servicing primarily from collections on existing finance debt and paying dividends through internally receivables and borrowings in the capital markets. generated funds, access to public and private debt An additional source of funds is loans from other markets and lines of credit. PACCAR companies. Commitments The primary sources of borrowings in the capital market are commercial paper and medium-term notes The following summarizes the Company’s contractual issued in the public markets and, to a lesser extent, cash commitments at December 31, 2007: bank loans. The majority of the medium-term notes Maturity are issued by PACCAR’s largest financial services Within More than subsidiary, PACCAR Financial Corp. (PFC). PFC filed One Year One Year Total a shelf registration under the Securities Act of 1933 in 2006. The registration expires in 2009 and does not Borrowings $4,836.8 $3,039.0 $7,875.8 limit the principal amount of debt securities that may Operating leases 28.0 42.1 70.1 be issued during the period. Purchase obligations 261.0 50.5 311.5 In June 2007, PACCAR’s European finance Other obligations 5.5 29.3 34.8 subsidiary, PACCAR Financial Europe, renewed and Total $5,131.3 $3,160.9 $8,292.2 increased the registration of a €1.2 billion medium- term note program with the London Stock Exchange. The Company had $8.29 billion of cash commit- On December 31, 2007, €448 million remained ments, substantially all of which mature within three available for issuance. This program is renewable years. Of the total cash commitments for borrowings, annually through the filing of a new prospectus. $7.86 billion were related to the Financial Services To reduce exposure to fluctuations in interest rates, segment. As described in Note K of the consolidated the Financial Services companies pursue a policy of financial statements, borrowings consist primarily of structuring borrowings with interest-rate character- term debt and commercial paper issued by the istics similar to the assets being funded. As part of Financial Services segment. The Company expects to this policy, the companies use interest-rate contracts. fund its maturing Financial Services debt obligations The permitted types of interest-rate contracts and principally from funds provided by collections from transaction limits have been established by the customers on loans and lease contracts, as well as from Company’s senior management, who receive periodic the proceeds of commercial paper and medium-term reports on the contracts outstanding. note borrowings. Purchase obligations are the Company’s contractual commitment to acquire future production inventory. Other obligations include deferred cash compensation.
  • 7. The Company’s other commitments include the critical accounting policies: 9 In the preparation of the Company’s financial following at December 31, 2007: statements, in accordance with U.S. generally accepted Commitment Expiration accounting principles, management uses estimates and makes judgments and assumptions that affect asset Within More than and liability values and the amounts reported as One Year One Year Total income and expense during the periods presented. Letters of credit $ 17.4 $ 18.0 $ 35.4 The following are accounting policies which, in the Loan and lease opinion of management, are particularly sensitive commitments 145.1 145.1 and which, if actual results are different, may have a Equipment material impact on the financial statements. acquisition commitments 43.4 8.1 51.5 Operating Leases Residual value The accounting for trucks sold pursuant to agreements guarantees 115.6 212.8 328.4 accounted for as operating leases is discussed in Notes Total $321.5 $238.9 $560.4 A and G of the consolidated financial statements. In determining its estimate of the residual value of such Loan and lease commitments are for funding new vehicles, the Company considers the length of the lease retail loan and lease contracts. Equipment acquisition term, the truck model, the expected usage of the truck commitments require the Company, under specified and anticipated market demand. If the sales price of circumstances, to purchase equipment. Residual value the trucks at the end of the term of the agreement guarantees represent the Company’s commitment to differs from the Company’s estimate, a gain or loss acquire trucks at a guaranteed value if the customer will result. The Company believes its residual-setting decides to return the truck at a specified date in the policies are appropriate; however, future market future. conditions, changes in government regulations and other factors outside the Company’s control could i m pa c t o f e n v i r o n m e n ta l m at t e r s : impact the ultimate sales price of trucks returned The Company, its competitors and industry in general under these contracts. Residual values are reviewed are subject to various domestic and foreign require- regularly and adjusted if market conditions warrant. ments relating to the environment. The Company believes its policies, practices and procedures are designed to prevent unreasonable risk of environ- mental damage and that its handling, use and disposal of hazardous or toxic substances have been in accordance with environmental laws and regulations enacted at the time such use and disposal occurred. Expenditures related to environmental activities in 2007, 2006 and 2005 were immaterial. The Company is involved in various stages of investigations and cleanup actions in different countries related to environmental matters. In certain of these matters, the Company has been designated as a “potentially responsible party” by domestic and foreign environmental agencies. The Company has provided an accrual for the estimated costs to investigate and complete cleanup actions where it is probable that the Company will incur such costs in the future. Management expects that these matters will not have a significant effect on the Company’s consolidated cash flow, liquidity or financial condition. PACCAR Inc and Subsidiaries
  • 8. Allowance for Credit Losses The discount rate for each plan is based on market 0 The Company determines the allowance for credit interest rates of high-quality corporate bonds with losses on financial services receivables based on a a maturity profile that matches the timing of the combination of historical information and current projected benefit payments of the plans. Changes in market conditions. This determination is dependent the discount rate affect the valuation of the plan on estimates, including assumptions regarding the benefits obligation and funded status of the plans. likelihood of collecting current and past-due accounts, The long-term rate of return on plan assets is based repossession rates and the recovery rate on the on projected returns for each asset class and relative underlying collateral based on used truck values and weighting of those asset classes in the plans. other pledged collateral or recourse. The Company Actual results that differ from these assumptions believes its reserve-setting policies adequately take into are accumulated and amortized into expense over account the known risks inherent in the financial future periods. While management believes that the services portfolio. If there are significant variations in assumptions used are appropriate, significant the actual results from those estimates, the provision differences in actual experience or significant changes for credit losses and operating earnings may be in assumptions would affect pension and other materially impacted. postretirement benefit costs and obligations and the balance sheet funded status of the plans. Product Warranty The expenses related to product warranty are estimated F O RwA R D - L O O K i N G S TAT E M E N T S : and recorded at the time products are sold based on Certain information presented in this report contains historical and current data and reasonable expectations forward-looking statements made pursuant to the for the future regarding the frequency and cost of Private Securities Litigation Reform Act of 1995, which warranty claims. Management believes that the warranty are subject to risks and uncertainties that may affect reserve is appropriate and takes actions to minimize actual results. Risks and uncertainties include, but are warranty costs through quality-improvement programs; not limited to: a significant decline in industry sales; however, actual claims incurred could materially differ competitive pressures; reduced market share; reduced from the estimated amounts and require adjustments availability of or higher prices for fuel; increased safety, to the reserve. emissions, or other regulations resulting in higher costs and/or sales restrictions; currency or commodity Pension and Other Postretirement Benefits price fluctuations; lower used truck prices; insufficient The Company’s accounting for employee pension or under-utilization of manufacturing capacity; and other postretirement benefit costs and obligations supplier interruptions; insufficient liquidity in the is based on management assumptions about the future capital markets; insufficient supplier capacity or access used by actuaries to estimate net costs and liabilities. to raw materials; labor disruptions; shortages of These assumptions include discount rates, long-term commercial truck drivers; increased warranty costs or rates of return on plan assets, health care cost trends, litigation; or legislative and governmental regulations. inflation rates, retirement rates, mortality rates and other factors. Management bases these assumptions on historical results, the current environment and reasonable expectations of future events.
  • 9. consolidated statements of income 2007 Year Ended December 31 2006 2005 31 (millions except per share data) truck and other: Net sales and revenues $14,030.4 $15,503.3 $ 13,298.4 11,917.3 Cost of sales and revenues 13,036.6 11,222.7 255.5 163.1 Research and development 117.8 491.4 Selling, general and administrative 457.3 429.9 (18.6) Interest and other (income) expense, net (.3) 11.2 12,645.6 13,656.7 11,781.6 1,384.8 Truck and Other Income Before Income Taxes 1,846.6 1,516.8 financial services: 1,191.3 Revenues 950.8 759.0 755.3 Interest and other 573.7 433.8 110.9 Selling, general and administrative 95.9 84.9 41.0 Provision for losses on receivables 33.8 40.4 907.2 703.4 559.1 284.1 Financial Services Income Before Income Taxes 247.4 199.9 95.4 Investment income 81.3 56.9 1,764.3 Total Income Before Income Taxes 2,175.3 1,773.6 537.0 Income taxes 679.3 640.4 Net Income $ 1,227.3 $ 1,496.0 $ 1,133.2 Net Income Per Share $ 3.31 Basic $ 3.99 $ 2.93 3.29 $ Diluted $ 3.97 $ 2.92 Weighted average number of common shares outstanding 371.1 Basic 375.1 386.4 373.3 Diluted 377.2 388.7 See notes to consolidated financial statements. PACCAR Inc and Subsidiaries
  • 10. CONSOLiDATED bALANCE SHEETS ASSETS  2007 December 31 2006 (millions of dollars) TRUCK AND OTHER: Current Assets $ 1,736.5 Cash and cash equivalents $ 1,806.3 570.0 Trade and other receivables, net 665.0 778.5 Marketable debt securities 821.7 628.3 Inventories 693.7 205.6 Deferred taxes and other current assets 212.8 3,918.9 Total Truck and Other Current Assets 4,199.5 489.2 Equipment on operating leases, net 418.2 1,642.6 Property, plant and equipment, net 1,347.2 467.2 Other noncurrent assets 331.3 6,517.9 Total Truck and Other Assets 6,296.2 FiNANCiAL SERviCES: 121.6 Cash and cash equivalents 46.2 9,025.4 Finance and other receivables, net 8,542.7 1,318.7 Equipment on operating leases, net 1,033.1 244.6 Other assets 189.2 10,710.3 Total Financial Services Assets 9,811.2 $17,228.2 $16,107.4
  • 11. liabilities and stockholders’ equity  2007 December 31 2006 (millions of dollars) truck and other: Current Liabilities $ 2,136.3 Accounts payable and accrued expenses $ 2,240.5 367.1 Dividend payable 497.0 2,503.4 Total Truck and Other Current Liabilities 2,737.5 23.6 Long‑term debt 20.2 539.4 Residual value guarantees and deferred revenues 477.5 458.4 Deferred taxes and other liabilities 383.7 3,524.8 Total Truck and Other Liabilities 3,618.9 financial services: Accounts payable, accrued expenses and other 258.5 243.2 4,106.8 Commercial paper and bank loans 4,222.6 3,745.4 Term debt 3,037.2 579.6 Deferred taxes and other liabilities 529.3 8,690.3 Total Financial Services Liabilities 8,032.3 stockholders’ equity Preferred stock, no par value – authorized 1.0 million shares, none issued Common stock, $1 par value – authorized 400.0 million shares; 368.4 issued 368.4 million and 248.5 million shares 248.5 37.7 Additional paid‑in capital 27.5 (61.7) Treasury stock – at cost (2.1) 4,260.6 Retained earnings 4,026.1 408.1 Accumulated other comprehensive income 156.2 5,013.1 Total Stockholders’ Equity 4,456.2 $17,228.2 16,107.4 $ See notes to consolidated financial statements. PACCAR Inc and Subsidiaries
  • 12. consolidated statements of cash flows 2007 Year Ended December 31 2006 2005 4 (millions of dollars) operating activities: $ 1,227.3 Net income $ 1,496.0 $ 1,133.2 Items included in net income not affecting cash: Depreciation and amortization: 196.4 Property, plant and equipment 163.4 133.3 330.0 Equipment on operating leases and other 271.2 236.8 41.0 Provision for losses on financial services receivables 33.8 40.4 (21.7) Gain on sale of property 20.7 Other, net 61.2 (19.8) Change in operating assets and liabilities: Decrease (increase) in assets other than cash and equivalents: Receivables: 143.6 Trade and other (80.5) (80.1) 81.3 Wholesale receivables on new trucks (64.6) (398.9) Sales-type finance leases and dealer direct loans on 40.3 new trucks (232.4) (194.3) 114.4 Inventories (168.5) (30.1) 16.8 Other, net (2.2) (37.5) (Decrease) increase in liabilities: (277.6) Accounts payable and accrued expenses 423.3 147.1 85.1 Residual value guarantees and deferred revenues 72.9 45.5 57.8 Other, net (120.9) 11.2 2,055.4 Net Cash Provided by Operating Activities 1,852.7 986.8 investing activities: (3,116.6) Retail loans and direct financing leases originated (3,318.5) (2,946.4) 2,837.3 Collections on retail loans and direct financing leases 2,543.8 2,202.5 13.7 Net decrease (increase) in wholesale receivables on used equipment (27.5) (15.5) (1,282.9) Marketable securities purchases (1,458.2) (1,172.4) 1,345.5 Marketable securities sales and maturities 1,225.4 1,135.1 (425.7) Acquisition of property, plant and equipment (312.0) (300.4) (841.7) Acquisition of equipment for operating leases (642.3) (548.1) 240.1 Proceeds from asset disposals 162.2 96.1 (66.5) Other, net 1.0 46.5 (1,296.8) Net Cash Used in Investing Activities (1,826.1) (1,502.6) financing activities: (736.7) Cash dividends paid (530.4) (496.9) (360.5) Purchase of treasury stock (312.0) (367.2) 30.8 Stock compensation transactions 37.7 11.9 (366.1) Net (decrease) increase in commercial paper and bank loans 576.0 1,148.4 879.5 Proceeds from long-term debt 2,222.6 1,016.9 (285.5) Payments on long-term debt (1,951.4) (592.1) (838.5) Net Cash (Used in) Provided by Financing Activities 42.5 721.0 85.5 Effect of exchange rate changes on cash 84.5 (121.0) 5.6 Net Increase in Cash and Cash Equivalents 153.6 84.2 1,852.5 Cash and Cash Equivalents at beginning of year 1,698.9 1,614.7 $ 1,858.1 Cash and Cash Equivalents at end of year $ 1,852.5 $ 1,698.9 See notes to consolidated financial statements.
  • 13. consolidated statements of stockholders’ equity 2007 December 31 2006 2005 5 (millions except per share data) common stock, $1 par value: $ $ 248.5 Balance at beginning of year $ 169.4 $ 173.9 (3.8) Treasury stock retirement (5.0) (5.0) 122.8 50% stock dividend 83.1 .9 Stock compensation 1.0 .5 368.4 Balance at end of year 248.5 169.4 additional paid-in capital: 27.5 Balance at beginning of year 140.6 450.5 (33.8) Treasury stock retirement (160.8) (338.4) 44.0 Stock compensation and tax benefit 47.7 28.5 37.7 Balance at end of year 27.5 140.6 treasury stock, at cost: (2.1) Balance at beginning of year (35.1) (359.6) Purchases: (shares) 2007-5.1; 2006-4.5; 2005-5.5 (301.5) (378.5) 300.0 Retirements 334.5 343.4 (61.7) Balance at end of year (2.1) (35.1) retained earnings: 4,026.1 Balance at beginning of year 3,471.5 2,826.9 1,227.3 Net income 1,496.0 1,133.2 Cash dividends declared on common stock, (607.6) per share: 2007-$1.65; 2006-$1.84; 2005-$1.28 (689.6) (488.6) (262.4) Treasury stock retirement (168.7) (122.8) 50% stock dividend (83.1) 4,260.6 Balance at end of year 4,026.1 3,471.5 accumulated other comprehensive income (loss): 156.2 Balance at beginning of year 154.7 311.1 FAS 158 accounting change, net of $87.5 tax effect (160.2) 251.9 Other comprehensive income (loss) 161.7 (156.4) 408.1 Balance at end of year 156.2 154.7 $ 5,013.1 Total Stockholders’ Equity $ 4,456.2 $ 3,901.1 See notes to consolidated financial statements. PACCAR Inc and Subsidiaries
  • 14. CONSOLiDATED STATEMENTS OF COMPREHENSivE iNCOME 2007 Year Ended December 31 2006 2005  (millions of dollars) $1,227.3 Net income $1,496.0 $1,133.2 Other comprehensive income (loss): Unrealized (losses) gains on derivative contracts (32.5) (Losses) gains arising during the period 13.1 28.5 15.9 Tax effect (4.7) (10.5) (14.8) Reclassification adjustment (17.4) 9.6 5.6 Tax effect 5.9 (2.8) (25.8) (3.1) 24.8 Unrealized gains (losses) on investments 5.2 Net holding gain (loss) (.6) (1.6) (2.1) Tax effect .3 .6 .2 Reclassification adjustment (.5) (.1) Tax effect .2 3.2 (.3) (1.3) Pension and postretirement Minimum pension liability adjustment 26.0 (20.2) Tax effect (9.8) 7.9 87.0 Amounts arising during the period (32.2) Tax effect 12.7 Reclassification adjustment (4.6) Tax effect 62.9 16.2 (12.3) 211.6 Foreign currency translation gains (losses) 148.9 (167.6) 251.9 Net other comprehensive income (loss) 161.7 (156.4) $1,479.2 Comprehensive Income $1,657.7 $ 976.8 See notes to consolidated financial statements. NOTES TO CONSOLiDATED FiNANCiAL STATEMENTS December 31, 2007, 2006 and 2005 (currencies in millions) A. SiGNiFiCANT ACCOUNTiNG POLiCiES Use of Estimates: The preparation of financial statements in conformity with accounting principles Description of Operations: PACCAR Inc (the Company generally accepted in the United States requires or PACCAR) is a multinational company operating in management to make estimates and assumptions two segments: (1) the manufacture and distribution of that affect the amounts reported in the financial light-, medium- and heavy-duty commercial trucks statements and accompanying notes. Actual results and related aftermarket parts and (2) finance and could differ from those estimates. leasing products and services provided to customers Cash and Cash Equivalents: Cash equivalents consist and dealers. PACCAR’s sales and revenues are derived of liquid investments with a maturity at date primarily from North America and Europe. The of purchase of three months or less. Company also operates in Australia and sells trucks Trade and Other Receivables: The Company’s trade and parts outside its primary markets to customers in and other receivables are included at cost on the Asia, Africa and South America. balance sheet, net of allowances. Principles of Consolidation: The consolidated financial statements include the accounts of the Company and its wholly owned domestic and foreign subsidiaries. All significant intercompany accounts and transactions are eliminated in consolidation.
  • 15. NOTES TO CONSOLiDATED FiNANCiAL STATEMENTS December 31, 2007, 2006 and 2005 (currencies in millions except per share amounts) Long-lived Assets, Goodwill and Other Intangible Earnings per Share: Diluted earnings per share are  Assets: The Company evaluates the carrying value of based on the weighted average number of basic shares long-lived assets (including property and equipment, outstanding during the year, adjusted for the dilutive goodwill and other intangible assets) when events and effects of stock-based compensation awards under the circumstances warrant such a review. Goodwill is also treasury stock method. tested for impairment on an annual basis. There were New Accounting Pronouncements: The Company no impairment charges during the three years ended adopted FASB Statement No. 158, Employers’ December 31, 2007. Accounting for Defined Benefit Pension and Other Revenue Recognition: Substantially all sales and Retirement Plans (FAS 158) effective December 31, revenues of trucks and related aftermarket parts are 2006. FAS 158 requires an employer to recognize the recorded by the Company when products are shipped funded status of each of its defined benefit post- to dealers or customers, except for certain truck retirement plans as an asset or liability and to recognize changes in funded status as a component shipments that are subject to a residual value of accumulated other comprehensive income. Upon guarantee to the customer. Revenues related to these adoption, total assets were reduced by $114.7, total shipments are recognized on a straight-line basis over liabilities were increased by $45.5 and stockholders’ the guarantee period (see Note G). At the time certain equity was reduced by $160.5, net of tax. truck and parts sales to a dealer are recognized, the The Company adopted FASB Interpretation No. 48, Company records an estimate of the future sales incentive costs related to such sales. The estimate is Accounting for Uncertainty in Income Taxes (FIN 48) based on historical data and announced incentive effective January 1, 2007 with no significant effect on programs. the Company’s consolidated financial statements. See Interest income from finance and other receivables Note M for further information concerning income is recognized using the interest method. Certain loan taxes. origination costs are deferred and amortized to In September 2006, the FASB issued Statement No. interest income. For operating leases, rental revenue is 157, Fair Value Measurements (FAS 157). FAS 157 recognized on a straight-line basis over the lease term. defines fair value and expands disclosures about fair Recognition of interest income and rental revenue value measurements and is effective January 1, 2008. is suspended when management determines that Adoption of FAS 157 is not expected to have a collection is not probable (generally after 90 days material effect on the Company’s consolidated past the contractual due date). Recognition is resumed financial statements. if the receivable becomes contractually current and the In February 2007, the FASB issued Statement No. collection of amounts is again considered probable. 159, The Fair Value Option for Financial Assets and Foreign Currency Translation: For most of Financial Liabilities (FAS 159). This Statement, which PACCAR’s foreign subsidiaries, the local currency is effective January 1, 2008 for PACCAR, permits is the functional currency. All assets and liabilities entities to measure most financial instruments at fair are translated at year-end exchange rates and all value if desired and requires that unrealized gains and income statement amounts are translated at the losses on items for which the option has been elected weighted average rates for the period. Translation to be reported in earnings. The Company does not adjustments are recorded in accumulated other expect adoption of FAS 159 to have a material effect comprehensive income (loss), a component of on its consolidated financial statements. stockholders’ equity. Reclassifications: Certain prior-year amounts have PACCAR uses the U.S. dollar as the functional been reclassified to conform to the 2007 presentation. currency for its Mexican subsidiaries. Accordingly, inventories, cost of sales, property, plant and equipment, and depreciation are remeasured at historical rates. Resulting gains and losses are included in net income. PACCAR Inc and Subsidiaries
  • 16. NOTES TO CONSOLiDATED FiNANCiAL STATEMENTS December 31, 2007, 2006 and 2005 (currencies in millions) b. i N v E S T M E N T S i N M A R K E TA b L E S E C U R i T i E S C. iNvENTORiES  The Company’s investments in marketable securities Inventories include the following: are classified as available-for-sale. These investments 2007 At December 31, 2006 are stated at fair value with any unrealized gains or $ 422.7 Finished products $ 365.4 losses, net of tax, included as a component of Work in process and raw accumulated other comprehensive income. Gross 355.0 materials 472.1 realized and unrealized gains and losses were 777.7 837.5 not significant for any of the three years ended (149.4) Less LIFO reserve (143.8) December 31, 2007. $ 628.3 $ 693.7 The cost of marketable debt securities is adjusted for amortization of premiums and accretion of Inventories are stated at the lower of cost or market. discounts to maturity. Amortization, accretion, interest Cost of inventories in the United States is determined and dividend income and realized gains and losses are principally by the last-in, first-out (LIFO) method. included in investment income. The cost of securities Cost of all other inventories is determined principally sold is based on the specific identification method. by the first-in, first-out (FIFO) method. Inventories Marketable debt securities consisted of the valued using the LIFO method comprised 40% and following at December 31: 53% of consolidated inventories before deducting the amortized fair LIFO reserve at December 31, 2007 and 2006. 2007 cost value $ 554.0 $ 558.4 U.S. tax-exempt securities Non U.S. corporate 113.7 113.0 securities Non U.S. government 92.7 92.5 securities 15.0 14.6 Other debt securities $ 775.4 $ 778.5 amortized fair 2006 cost value U.S. tax-exempt securities $ 752.3 $ 750.9 U.S. government securities 59.4 58.5 Other debt securities 12.2 12.3 $ 823.9 $ 821.7 Contractual maturities at December 31, 2007, were as follows: amortized fair Maturities: cost value $ 90.2 $ 90.2 Within one year 609.5 612.5 One to five years 1.1 1.1 Five to ten years 74.6 74.7 10 or more years $ 775.4 $ 778.5 Marketable debt securities included $75.8 and $128.4 of variable rate demand obligations (VRDOs) at December 31, 2007 and 2006, respectively. VRDOs are debt instruments with long-term scheduled maturities which have interest rates that reset periodically.
  • 17. NOTES TO CONSOLiDATED FiNANCiAL STATEMENTS December 31, 2007, 2006 and 2005 (currencies in millions) D. F i N A N C E A N D O T H E R R E C E i vA b L E S The allowance for losses on Truck and Other and 9 Financial Services receivables is summarized as Finance and other receivables consist primarily of follows: receivables from loans and financing leases resulting from truck sales, loan and leasing activity. Finance and truck financial and other services other receivables include the following: Balance, December 31, 2004 $ 12.7 $ 127.4 2007 At December 31, 2006 Provision for losses .3 40.4 $4,325.9 Loans $4,226.7 Net losses (.5) (19.3) 2,816.7 Retail direct financing leases 2,322.1 Currency translation (1.6) (3.3) 908.1 Sales-type finance leases 909.2 Balance, December 31, 2005 10.9 145.2 1,554.6 Dealer wholesale financing 1,562.6 Provision for losses .3 33.8 108.9 Interest and other receivables 112.1 Net losses (6.0) (13.9) Unearned interest: Currency translation .5 3.9 (495.4) Finance leases (421.0) Balance, December 31, 2006 5.7 169.0 9,218.8 8,711.7 Provision for losses .2 41.0 (193.4) Less allowance for losses (169.0) Net losses (.5) (25.8) $9,025.4 $8,542.7 Acquisitions .2 1.8 Currency translation 1.9 7.4 Terms for substantially all finance and other Balance, December 31, 2007 $ 7.5 $ 193.4 receivables range up to 60 months. Annual payments due on loans beginning January 1, 2008, are $1,663.8, The Company’s customers are principally concen- $1,171.0, $876.5, $530.9, $236.4 and $25.5 thereafter. trated in the transportation industry in North America Annual minimum lease payments due on finance and Europe. There are no significant concentrations leases beginning January 1, 2008, are $1,051.9, of credit risk in terms of a single customer. Generally, $930.9, $722.4, $472.6, $224.1 and $106.3 thereafter. Truck and Other and Financial Services receivables are Repayment experience indicates that some receivables collateralized by the related equipment and parts. will be paid prior to contract maturity, while others may be extended or revised. F. P R O P E RT y, P L A N T A N D E q U i P M E N T The effects of sales-type leases, dealer direct loans Property, plant and equipment include the following: and wholesale financing of new trucks are shown in the consolidated statements of cash flows as operating 2007 At December 31, 2006 activities since they finance the sale of company $ 179.3 Land $ 142.5 inventory. Included in Loans are dealer direct loans 847.6 Buildings 731.3 on the sale of new trucks of $198.2 and $220.4 as of 2,206.9 Machinery and equipment 1,838.0 December 31, 2007 and 2006. Estimated residual 3,233.8 2,711.8 values included with finance leases amounted to Less allowance for $216.6 in 2007 and $173.7 in 2006. (1,591.2) (1,364.6) depreciation $1,642.6 $1,347.2 E. A L L O wA N C E F O R L O S S E S Receivables are charged to the allowance for losses Property, plant and equipment are stated at cost. when, in the judgment of management, they are Depreciation is computed principally by the straight- deemed uncollectible (generally upon repossession line method based upon the estimated useful lives of of the collateral). The provision for losses on finance, the various classes of assets, which range as follows: trade and other receivables is charged to income in an Buildings 30-40 years amount sufficient to maintain the allowance for losses Machinery and equipment 5-12 years at a level considered adequate to cover estimated credit losses. PACCAR Inc and Subsidiaries