1. Anheuser-Busch Companies and Subsidiaries
Consolidated Balance Sheet
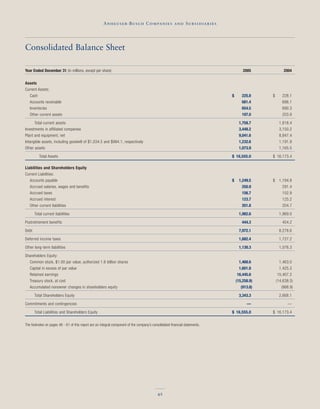
Year Ended December 31 (in millions, except per share) 2005 2004
Assets
Current Assets:
Cash $ 225.8 $ 228.1
Accounts receivable 681.4 696.1
Inventories 654.5 690.3
Other current assets 197.0 203.9
Total current assets 1,758.7 1,818.4
Investments in affiliated companies 3,448.2 3,150.2
Plant and equipment, net 9,041.6 8,847.4
Intangible assets, including goodwill of $1,034.5 and $984.1, respectively 1,232.6 1,191.9
Other assets 1,073.9 1,165.5
Total Assets $ 16,555.0 $ 16,173.4
Liabilities and Shareholders Equity
Current Liabilities:
Accounts payable $ 1,249.5 $ 1,194.8
Accrued salaries, wages and benefits 250.9 291.4
Accrued taxes 156.7 152.9
Accrued interest 123.7 125.2
Other current liabilities 201.8 204.7
Total current liabilities 1,982.6 1,969.0
Postretirement benefits 444.3 454.2
Debt 7,972.1 8,278.6
Deferred income taxes 1,682.4 1,727.2
Other long-term liabilities 1,130.3 1,076.3
Shareholders Equity:
Common stock, $1.00 par value, authorized 1.6 billion shares 1,468.6 1,463.0
Capital in excess of par value 1,601.8 1,425.3
Retained earnings 16,445.6 15,407.2
Treasury stock, at cost (15,258.9) (14,638.5)
Accumulated nonowner changes in shareholders equity (913.8) (988.9)
Total Shareholders Equity 3,343.3 2,668.1
Commitments and contingencies — —
Total Liabilities and Shareholders Equity $ 16,555.0 $ 16,173.4
The footnotes on pages 46 - 61 of this report are an integral component of the company’s consolidated financial statements.
42
2. Anheuser-Busch Companies and Subsidiaries
Consolidated Statement of Income
Year Ended December 31 (in millions, except per share) 2005 2004 2003
Gross sales $17,253.5 $ 17,160.2 $ 16,320.2
Excise taxes (2,217.8) (2,226.0) (2,173.5)
Net sales 15,035.7 14,934.2 14,146.7
Cost of sales (9,579.5) (8,982.5) (8,449.1)
Gross profit 5,456.2 5,951.7 5,697.6
Marketing, distribution and administrative expenses (2,730.2) (2,590.7) (2,498.3)
Litigation settlement (105.0) — —
Operating income 2,621.0 3,361.0 3,199.3
Interest expense (454.5) (426.9) (401.5)
Interest capitalized 19.9 21.9 24.4
Interest income 2.4 4.7 1.7
Other income, net 2.7 38.7 0.4
Income before income taxes 2,191.5 2,999.4 2,824.3
Provision for income taxes (850.4) (1,163.2) (1,093.3)
Equity income, net of tax 498.1 404.1 344.9
Net income $ 1,839.2 $ 2,240.3 $ 2,075.9
Earnings per share:
Basic $ 2.37 $ 2.80 $ 2.51
Diluted $ 2.35 $ 2.77 $ 2.48
The footnotes on pages 46 - 61 of this report are an integral component of the company’s consolidated financial statements.
43
3. Anheuser-Busch Companies and Subsidiaries
Consolidated Statement of Changes in Shareholders Equity
Year Ended December 31 (in millions, except per share) 2005 2004 2003
Common Stock, $1.00 Par Value
Balance, beginning of period $ 1,463.0 $ 1,457.9 $ 1,453.4
Shares issued under stock plans 5.6 5.1 4.5
Balance, end of period $ 1,468.6 $ 1,463.0 $ 1,457.9
Capital in Excess of Par Value
Balance, beginning of period $ 1,425.3 $ 1,194.0 $ 1,024.5
Shares issued under stock plans 176.5 157.3 125.4
Shares issued for acquisition — — 44.1
Grupo Modelo capital transaction — 74.0 —
Balance, end of period $ 1,601.8 $ 1,425.3 $ 1,194.0
Retained Earnings
Balance, beginning of period $ 15,407.2 $ 13,935.4 $ 12,544.0
Net income 1,839.2 2,240.3 2,075.9
Common dividends paid (per share: 2005, $1.03; 2004, $.93; 2003, $.83) (800.8) (742.8) (685.4)
Deferred income tax adjustment — (25.9) —
Shares issued under stock plans — 0.2 0.9
Balance, end of period $ 16,445.6 $ 15,407.2 $ 13,935.4
Treasury Stock
Balance, beginning of period $ (14,638.5) $ (12,939.0) $ (11,008.6)
Treasury stock acquired (620.4) (1,699.5) (1,958.9)
Treasury stock issued for acquisition — — 28.5
Balance, end of period $ (15,258.9) $ (14,638.5) $ (12,939.0)
Accumulated Nonowner Changes in Shareholders Equity
Balance, beginning of period $ (988.9) $ (890.3) $ (870.7)
Foreign currency translation gains/(losses) 184.5 102.9 (229.8)
Deferred hedging gains/(losses) (1.1) (61.1) 65.7
Deferred securities valuation gains/(losses) (95.6) (76.4) 169.3
Minimum pension liability (12.7) (64.0) (24.8)
Total nonowner changes in shareholders equity, net of tax 75.1 (98.6) (19.6)
Balance, end of period $ (913.8) $ (988.9) $ (890.3)
ESOP Debt Guarantee
Balance, beginning of period — $ (46.3) $ (90.3)
Annual debt service — 46.3 44.0
Balance, end of period — $ — $ (46.3)
Total Shareholders Equity $ 3,343.3 $ 2,668.1 $ 2,711.7
Net Income and Nonowner Changes in Shareholders Equity
Net income $ 1,839.2 $ 2,240.3 $ 2,075.9
Total nonowner changes in shareholders equity, net of tax 75.1 (98.6) (19.6)
Combined Net Income and Nonowner Changes in Shareholders Equity $ 1,914.3 $ 2,141.7 $ 2,056.3
The footnotes on pages 46 - 61 of this report are an integral component of the company’s consolidated financial statements.
44
4. Anheuser-Busch Companies and Subsidiaries
Consolidated Statement of Cash Flows
Year Ended December 31 (in millions) 2005 2004 2003
Cash Flow from Operating Activities:
Net income $ 1,839.2 $ 2,240.3 $ 2,075.9
Adjustments to reconcile net income to cash provided by operating activities:
Depreciation and amortization 979.0 932.7 877.2
Deferred income taxes 0.2 187.1 129.5
Gain on sale of business (15.4) (13.4) —
Undistributed earnings of affiliated companies (288.0) (225.1) (175.7)
Other, net 162.5 0.3 31.4
Operating cash flow before changes in working capital 2,677.5 3,121.9 2,938.3
(Increase)/Decrease in working capital 50.3 (181.6) 32.6
Cash provided by operating activities 2,727.8 2,940.3 2,970.9
Cash Flow from Investing Activities:
Capital expenditures (1,136.7) (1,089.6) (993.0)
New business acquisitions — (727.9) (156.9)
Proceeds from sale of business 48.3 302.5 —
Cash used for investing activities (1,088.4) (1,515.0) (1,149.9)
Cash Flow from Financing Activities:
Increase in debt 100.0 1,443.8 1,389.0
Decrease in debt (456.0) (510.6) (652.1)
Dividends paid to shareholders (800.8) (742.8) (685.4)
Acquisition of treasury stock (620.4) (1,699.5) (1,958.9)
Shares issued under stock plans 135.5 120.8 88.6
Cash used for financing activities (1,641.7) (1,388.3) (1,818.8)
Net increase in cash during the year (2.3) 37.0 2.2
Cash, beginning of year 228.1 191.1 188.9
Cash, end of year $ 225.8 $ 228.1 $ 191.1
The footnotes on pages 46 - 61 of this report are an integral component of the company’s consolidated financial statements.
45