1. The TJX Companies, Inc.
S E L E C T E D F I N A N C I A L D ATA ( C O N T I N U I N G O P E R AT I O N S )
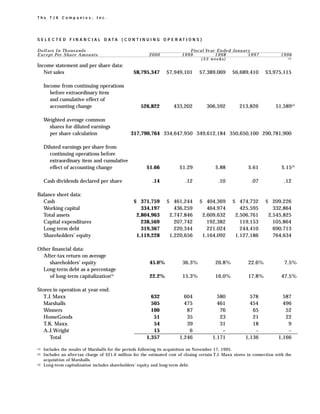
Do ll ars I n Th ous a nd s Fis c al Ye ar En de d Ja n u a r y
E xc e pt Per S ha re A m o u n t s 2000 1999 1998 1997 1996
( 5 3 we e k s ) (1)
Income statement and per share data:
Net sales $8,795,347 $7,949,101 $7,389,069 $6,689,410 $3,975,115
Income from continuing operations
before extraordinary item
and cumulative effect of
accounting change 526,822 433,202 306,592 213,826 51,589(2)
Weighted average common
shares for diluted earnings
per share calculation 317,790,764 334,647,950 349,612,184 350,650,100 290,781,900
Diluted earnings per share from
continuing operations before
extraordinary item and cumulative
effect of accounting change $1.66 $1.29 $.88 $.61 $.15(2)
Cash dividends declared per share .14 .12 .10 .07 .12
Balance sheet data:
Cash $ 371,759 $ 461,244 $ 404,369 $ 474,732 $ 209,226
Working capital 334,197 436,259 464,974 425,595 332,864
Total assets 2,804,963 2,747,846 2,609,632 2,506,761 2,545,825
Capital expenditures 238,569 207,742 192,382 119,153 105,864
Long-term debt 319,367 220,344 221,024 244,410 690,713
Shareholders’ equity 1,119,228 1,220,656 1,164,092 1,127,186 764,634
Other financial data:
After-tax return on average
shareholders’ equity 45.0% 36.3% 26.8% 22.6% 7.5%
Long-term debt as a percentage
of long-term capitalization(3) 22.2% 15.3% 16.0% 17.8% 47.5%
Stores in operation at year-end:
T.J. Maxx 632 604 580 578 587
Marshalls 505 475 461 454 496
Winners 100 87 76 65 52
HomeGoods 51 35 23 21 22
T.K. Maxx 54 39 31 18 9
A.J. Wright 15 6 – – –
Total 1,357 1,246 1,171 1,136 1,166
Includes the results of Marshalls for the periods following its acquisition on November 17, 1995.
(1)
Includes an after-tax charge of $21.0 million for the estimated cost of closing certain T.J. Maxx stores in connection with the
(2)
acquisition of Marshalls.
Long-term capitalization includes shareholders’ equity and long-term debt.
(3)
2. The TJX Companies, Inc.
C O N S O L I D AT E D S TAT E M E N T S O F I N C O M E
Fi sc al Ye ar E n ded
Ja nua ry 2 9, Ja nua r y 3 0, Ja nua r y 3 1 ,
Do ll ars I n Th ous a nd s E xc ep t Pe r S har e A m o u n t s 2000 1999 1998
(5 3 we e k s )
Net sales $8,795,347 $7,949,101 $7,389,069
Cost of sales, including buying and occupancy costs 6,579,400 5,957,415 5,676,541
Selling, general and administrative expenses 1,354,665 1,285,988 1,185,755
Interest expense, net 7,345 1,686 4,502
Income from continuing operations before income taxes,
extraordinary item and cumulative effect of accounting change 853,937 704,012 522,271
Provision for income taxes 327,115 270,810 215,679
Income from continuing operations before extraordinary
item and cumulative effect of accounting change 526,822 433,202 306,592
(Loss) from discontinued operations, net of income taxes – (9,048) –
Income before extraordinary item and cumulative effect
of accounting change 526,822 424,154 306,592
Extraordinary (charge), net of income taxes – – (1,777)
Cumulative effect of accounting change, net of income taxes (5,154) – –
Net income 521,668 424,154 304,815
Preferred stock dividends – 3,523 11,668
Net income available to common shareholders $ 521,668 $ 420,631 $ 293,147
Basic earnings per share:
Income from continuing operations before extraordinary
item and cumulative effect of accounting change $1.67 $1.35 $.92
Net income $1.66 $1.32 $.91
Weighted average common shares — basic 314,577,145 318,073,081 321,474,046
Diluted earnings per share:
Income from continuing operations before extraordinary
item and cumulative effect of accounting change $1.66 $1.29 $.88
Net income $1.64 $1.27 $.87
Weighted average common shares — diluted 317,790,764 334,647,950 349,612,184
Cash dividends declared per share $ .14 $ .12 $.10
The a cc om pany i n g n ot e s a re an in teg ra l pa r t o f th e fin a nc i al s tat e me nt s.
3. The TJX Companies, Inc.
C O N S O L I D AT E D B A L A N C E S H E E T S
Ja nua ry 2 9, Ja nua ry 3 0,
I n Th o u s a n d s 2000 1999
Assets
Current assets:
Cash and cash equivalents $ 371,759 $ 461,244
Accounts receivable 55,461 67,345
Merchandise inventories 1,229,587 1,186,068
Prepaid expenses and other current assets 43,758 28,448
Total current assets 1,700,565 1,743,105
Property at cost:
Land and buildings 116,005 115,485
Leasehold costs and improvements 622,962 547,099
Furniture, fixtures and equipment 849,932 711,320
1,588,899 1,373,904
Less: accumulated depreciation and amortization 754,314 617,302
834,585 756,602
Other assets 55,826 27,436
Deferred income taxes, net 23,143 22,386
Goodwill and tradename, net of amortization 190,844 198,317
Total Assets $2,804,963 $2,747,846
Liabilities
Current liabilities:
Current installments of long-term debt $ 100,359 $ 694
Accounts payable 615,671 617,159
Accrued expenses and other current liabilities 650,338 688,993
Total current liabilities 1,366,368 1,306,846
Long-term debt, exclusive of current installments 319,367 220,344
Commitments and contingencies
S h a reho l der s’ Equ ity
Common stock, authorized 1,200,000,000 shares, par value $1,
issued and outstanding 299,979,363 and 322,140,770 shares 299,979 322,141
Additional paid-in capital – –
Accumulated other comprehensive income (loss) (1,433) (1,529)
Retained earnings 820,682 900,044
Total shareholders’ equity 1,119,228 1,220,656
Total Liabilities and Shareholders’ Equity $2,804,963 $2,747,846
The a cc om p any in g n ot e s a re an in teg ra l pa r t o f th e fin an ci al s tat e me nts .
4. The TJX Companies, Inc.
C O N S O L I D AT E D S TAT E ME N T S O F C A S H F L O W S
Fi sc al Ye ar E n ded
Ja nua ry 2 9, Ja nua r y 3 0, Ja nua r y 3 1 ,
I n Th o u s a n d s 2000 1999 1998
( 5 3 we e k s )
C a s h f l ow s f r o m o p e r a t i n g a c t i v i t i e s :
Net income $ 521,668 $ 424,154 $ 304,815
Adjustments to reconcile net income to net cash
provided by operating activities:
Loss from discontinued operations – 9,048 –
Extraordinary charge – – 1,777
Cumulative effect of accounting change 5,154 – –
Depreciation and amortization 160,393 136,531 124,891
Property disposals 4,624 6,037 18,778
Other, net (27,744) (6,296) (3,928)
Changes in assets and liabilities:
(Increase) in accounts receivable (8,199) (6,610) (3,460)
(Increase) decrease in merchandise inventories (28,886) 4,102 (130,665)
(Increase) in prepaid expenses and other current assets (15,532) (1,091) (10,978)
Increase (decrease) in accounts payable (1,488) 34,368 48,846
Increase (decrease) in accrued expenses
and other current liabilities (34,789) 48,670 37,211
Increase (decrease) in deferred income taxes 2,769 (19,965) (3,793)
Net cash provided by operating activities 577,970 628,948 383,494
C ash fl ows from i nves tin g activi ti es:
Property additions (238,569) (207,742) (192,382)
Proceeds from sale of other assets – 9,421 15,697
Proceeds adjustment to sale
of discontinued operations – – (33,190)
Net cash (used in) investing activities (238,569) (198,321) (209,875)
Cash f low s f rom f ina ncin g acti viti es:
Proceeds from borrowings of long-term debt, net 198,060 – –
Principal payments on long-term debt (695) (23,360) (27,179)
Proceeds from sale and issuance of common stock 21,048 27,763 15,471
Stock repurchased (604,560) (337,744) (245,198)
Cash dividends paid (42,739) (40,411) (41,527)
Net cash (used in) financing activities (428,886) (373,752) (298,433)
Net cash provided by (used in) continuing operations (89,485) 56,875 (124,814)
Net cash provided by discontinued operations – – 54,451
Net increase (decrease) in cash and cash equivalents (89,485) 56,875 (70,363)
Cash and cash equivalents at beginning of year 461,244 404,369 474,732
Cash and cash equivalents at end of year $ 371,759 $ 461,244 $ 404,369
The a cco m pany in g n o te s a re an in t eg ral pa rt o f t h e fi n anc i al sta te me n ts.
5. The TJX Companies, Inc.
C O N S O L I D AT E D S TA T E M E N T S O F S H A R E H O L D E R S ’ E Q U I T Y
Accumulated
P re fe r re d Common Additional Other
S t o ck S t o c k , Pa r Pa i d - i n C o m p re h e n s i ve Retained
I n Thousands Fa c e Va l u e Va l u e $ 1 C ap i t a l In co me (Loss ) Earnings To t a l
Balance, January 25, 1997 $150,000 $ 79,576 $430,055 $(1,038) $ 468,593 $1,127,186
Comprehensive income:
Net income – – – – 304,815 304,815
Foreign currency translation – – – (643) – (643)
Unrealized gains on securities – – – 4,998 – 4,998
Total comprehensive income 309,170
Cash dividends declared:
Preferred stock – – – – (11,668) (11,668)
Common stock – – – – (31,832) (31,832)
Conversion of cumulative Series E
preferred stock into common stock (77,020) 8,315 68,705 – – –
Stock repurchased:
Preferred (250) – – – (500) (750)
Common – (8,528) (235,920) – – (244,448)
Stock split, two–for–one – 79,823 (79,823) – – –
Issuance of common stock under stock
incentive plans and related tax benefits – 715 15,719 – – 16,434
Balance, January 31, 1998 72,730 159,901 198,736 3,317 729,408 1,164,092
Comprehensive income:
Net income – – – – 424,154 424,154
Foreign currency translation – – – 152 – 152
Reclassification of unrealized gains – – – (4,998) – (4,998)
Total comprehensive income 419,308
Cash dividends declared:
Preferred stock – – – – (3,523) (3,523)
Common stock – – – – (38,134) (38,134)
Conversion of cumulative Series E
preferred stock into common stock (72,730) 14,682 58,048 – – –
Common stock repurchased – (12,998) (187,859) – (149,462) (350,319)
Stock split, two–for–one – 158,954 (96,555) – (62,399) –
Issuance of common stock under stock
incentive plans and related tax benefits – 1,602 27,630 – – 29,232
Balance, January 30, 1999 – 322,141 – (1,529) 900,044 1,220,656
Comprehensive income:
Net income – – – – 521,668 521,668
Foreign currency translation – – – 229 – 229
Unrealized (loss) on securities – – – (133) – (133)
Total comprehensive income 521,764
Cash dividends declared on common stock – – – – (43,716) (43,716)
Common stock repurchased – (23,578) (20,368) – (557,314) (601,260)
Issuance of common stock under stock
incentive plans and related tax benefits – 1,416 20,368 – – 21,784
Balance, January 29, 2000 $ – $299,979 $ – $(1,433) $ 820,682 $1,119,228
The a cc om pany in g n o te s a re a n in t eg ral pa rt o f t h e fin anc i al s ta te me nt s.
6. The TJX Companies, Inc.
SELECTED INFORMATION BY MAJOR BUSINESS SEGMENT
Fi sc al Ye ar E n ded
Ja nua ry 2 9, Ja nua r y 3 0, Ja nua r y 3 1 ,
I n Th o u s a n d s 2000 1999 1998
( 5 3 we e k s )
Net sales:
Off-price family apparel stores $8,588,537 $7,816,563 $7,290,959
Off-price home fashion stores 206,810 132,538 98,110
$8,795,347 $7,949,101 $7,389,069
Operating income (loss):
Off-price family apparel stores $ 896,492 $ 782,706 $ 596,908
Off-price home fashion stores (1) 4,581 (4,950) (8,615)
901,073 777,756 588,293
General corporate expense (2) 37,182 69,449 58,906
Goodwill amortization 2,609 2,609 2,614
Interest expense, net 7,345 1,686 4,502
Income from continuing operations before income
taxes, extraordinary item and cumulative effect of
accounting change $ 853,937 $ 704,012 $ 522,271
Identifiable assets:
Off-price family apparel stores $2,189,403 $2,093,879 $2,033,945
Off-price home fashion stores 63,888 49,515 39,074
Corporate, primarily cash, goodwill and deferred taxes 551,672 604,452 536,613
$2,804,963 $2,747,846 $2,609,632
Capital expenditures:
Off-price family apparel stores $ 227,750 $ 202,054 $ 190,720
Off-price home fashion stores 10,819 5,688 1,662
$ 238,569 $ 207,742 $ 192,382
Depreciation and amortization:
Off-price family apparel stores $ 153,525 $ 130,325 $ 115,967
Off-price home fashion stores 3,911 3,302 3,186
Corporate, including goodwill 2,957 2,904 5,738
$ 160,393 $ 136,531 $ 124,891
The periods ended January 30, 1999 and January 31, 1998 include a pre-tax charge of $2.2 million and $1.5 million, respectively,
(1)
for certain store closings and other restructuring costs relating to HomeGoods.
General corporate expense for the fiscal year ended January 29, 2000, includes a pre-tax gain of $8.5 million associated with the
(2)
Company’s receipt of common stock resulting from the demutualization of Manulife Financial and a pre-tax charge of $1.1 million
for costs associated with a fiscal 1998 executive deferred compensation award. General corporate expense for the fiscal year ended
January 30, 1999 includes a pre-tax charge of $6.3 million for costs associated with the foregoing executive deferred compensation
awa rd , a $3.5 million pre-tax charge for the write-down of a note receivable from the Company’s former Hit or Miss division and a
$7.5 million charitable donation to The TJX Foundation. General corporate expense for the fiscal year ended January 31, 1998
includes a pre-tax charge of $15.2 million for costs associated with the foregoing executive deferred compensation award and a pre-
tax gain of $6.0 million for the sale of Brylane, Inc. common stock.
7. The TJX Companies, Inc.
N O T E S T O C O NS O L I D AT E D FI N A N C I A L S TAT E M E N T S
S u m m a r y o f A c c o u n t i n g Po l i c i e s
Fi s c a l Ye a r: The Company’s fiscal year ends on the last Saturday in January. The fiscal year ended January 31,
1998 (fiscal 1998) included 53 weeks. The fiscal years ended January 29, 2000 and January 30, 1999 each
included 52 weeks.
B a s i s o f P re s e n t a t i o n : The consolidated financial statements of The TJX Companies, Inc. include the
financial statements of all the Company’s wholly owned subsidiaries,including its foreign subsidiaries.The finan-
cial statements for the applicable periods present the Company’s former Chadwick’s of Boston (Chadwick’s)
and Hit or Miss divisions as discontinued operations. The notes pertain to continuing operations except where
otherwise noted.
U s e o f E s t i m a te s : The preparation of the financial statements, in conformity with generally accepted account-
ing principles, requires management to make estimates and assumptions that affect the reported amounts of assets
and liabilities, and disclosure of contingent liabilities, at the date of the financial statements as well as the reported
amounts of revenues and expenses during the reporting period. Actual results could differ from those estimates.
C a s h , C a s h E q u i va l e n t s a n d S h o r t - Te r m I nve s t m e n t s : The Company generally considers highly liquid
investments with an initial maturity of three months or less to be cash equivalents. The Company’s investments
are primarily high-grade commercial paper, institutional money market funds and time deposits with major
banks. The fair value of cash equivalents approximates carrying value.
During September 1999, the Company received 693,537 common shares of Manulife Financial. The shares
issued reflect ownership interest in the demutualized insurer due to policies held by the Company. These securi-
ties were recorded at market value upon receipt resulting in an $8.5 million pre-tax gain.The Company has clas-
sified these Manulife Financial common shares as available-for-sale and includes them in other current assets on
the balance sheets. In years prior to fiscal 2000, the Company also held available-for-sale marketable securities
received as proceeds from the sale of its former Chadwick’s division (see Note B). Available-for-sale securities
are stated at fair market value with unrealized gains or losses, net of income taxes, included as a component of
other comprehensive income (loss). Realized gains or losses are included in net income when the securities are
sold or disposed of, resulting in a related reclassification adjustment to other comprehensive income (loss).
M e r ch a n d i s e I n v e n t o r i e s : Inventories are stated at the lower of cost or market.The Company uses the retail
method for valuing inventories on the first-in first-out basis.
D e p r e c i a t i o n a n d A m o r t i z a t i o n : For financial reporting purposes, the Company provides for depreciation
and amortization of property principally by the use of the straight-line method over the estimated useful lives
of the assets. Buildings are depreciated over 33 years,leasehold costs and improvements are generally amortized
over the lease term or their estimated useful life, whichever is shorter, and furniture, fixtures and equipment are
depreciated over 3 to 10 years. Depreciation and amortization expense for property was $154.2 million, $130.4
million and $115.8 million for the fiscal years 2000, 1999 and 1998, respectively. Maintenance and repairs are
charged to expense as incurred. Internal costs for the development of software are generally not material and
the Company expenses them as incurred. Upon retirement or sale, the cost of disposed assets and the related
depreciation are eliminated and any gain or loss is included in net income. Debt discount and related issue
expenses are amortized to interest expense over the lives of the related debt issues. Pre-opening costs are
expensed as incurred.
G o od w il l a n d Tr a d e n a m e : Goodwill is primarily the excess of the purchase price incurred over the carrying
value of the minority interest in the Company’s former 83%-owned subsidiary. The minority interest was
acquired pursuant to the Company’s fiscal 1990 restructuring. In addition, goodwill includes the excess of cost
over the estimated fair market value of the net assets of Winners Apparel Ltd., acquired by the Company in fiscal
1991. Goodwill, net of amortization, totaled $76.8 million and $79.3 million as of January 29, 2000 and
8. January 30, 1999, respectively, and is being amortized over 40 years on a straight-line basis.Annual amortiza-
tion of goodwill was $2.6 million in fiscal years 2000, 1999 and 1998. Cumulative amortization as of January
29, 2000 and January 30, 1999 was $27.7 million and $25.1 million, respectively.
Tradename is the value assigned to the name “Marshalls” as a result of the Company’s acquisition of the
Marshalls chain on November 17, 1995. The value of the tradename was determined by the discounted present
value of assumed after-tax royalty payments, offset by a reduction for its pro-rata share of the total negative good-
will acquired. The final purchase price allocated to the tradename, including a reduction for a pro-rata share of
reserve adjustments recorded in fiscal 2000 and fiscal 1998 (see Note J) amounted to $128.3 million.The trade-
name is deemed to have an indefinite life and accordingly is being amortized over 40 years.Amortization expense
was $3.2 million for fiscal years 2000 and 1999, and $3.4 million for fiscal 1998. Cumulative amortization as of
January 29, 2000 and January 30, 1999 was $14.2 million and $11.0 million, respectively.
I m p a i r m e n t o f L on g - Li v e d A s s e t s : The Company periodically reviews the value of its property and intan-
gible assets in relation to the current and expected operating results of the related business segments in order to
assess whether there has been a permanent impairment of their carrying values.
A d ve r t i s i n g C o s t s : The Company expenses advertising costs during the fiscal year incurred. Advertising
expense was $114.7 million, $106.4 million and $103.8 million for fiscal years 2000, 1999 and 1998, respectively.
E a r n i n g s Pe r S h a re : All earnings per share amounts discussed refer to diluted earnings per share unless
otherwise indicated.All historical earnings per share amounts reflect the June 1998 and June 1997 two-for-one
stock splits.
Fo re i g n C u r re n cy Tra n s l a t i o n : The Company’s foreign assets and liabilities are translated at the year-end
exchange rate and income statement items are translated at the average exchange rates prevailing during the
year. A large portion of the Company’s net investment in foreign operations is hedged with foreign currency
swap agreements and forward contracts. The translation adjustments associated with the foreign operations and
the related hedging instruments are included in shareholders’ equity as a component of comprehensive income
(loss). Cumulative foreign currency translation adjustments included in shareholders’ equity amounted to losses
of $1.3 million as of January 29, 2000 and $1.5 million as of January 30, 1999.
N e w A c c o u n t i ng S t a n d a rd s : During 1998, the Financial Accounting Standards Board (FASB) issued State-
ment of Financial Accounting Standards (SFAS) No. 133, “Accounting for Derivative Instruments and Hedging
Activities.” This Statement established accounting and reporting standards for derivative instruments, including
certain derivative instruments embedded in other contracts, and for hedging activities. This Statement requires
that an entity recognize all derivatives as either assets or liabilities in the statements of financial position and
measure those instruments at fair value. SFAS No. 133 was later amended by SFAS No. 137 which deferred the
implementation date of SFAS No. 133 to fiscal years beginning after June 15, 2000. The Company believes that
the impact of implementation of this new standard will be immaterial. The Company will adopt SFAS No. 133,
as amended by SFAS No. 137, in its fiscal year ending January 26, 2002.
R e c l a s s i f i c a t i o n s : Certain amounts in prior years’ financial statements have been reclassified for comparative
purposes.
A. Change In Accounting Principle
Effective January 31, 1999,the Company changed its method of accounting for layaway sales in compliance with
Staff Accounting Bulletin No. 101 “Revenue Recognition in Financial Statements,” issued by the Securities and
Exchange Commission during the fourth quarter of fiscal 2000. Under the new accounting method, the
Company will defer recognition of a layaway sale and its related profit to the accounting period when the
customer picks up layaway merchandise. The cumulative effect of this change for periods prior to January 31,
9. 1999 of $5.2 million (net of income taxes of $3.4 million), or $.02 per share, is shown as the cumulative effect
of accounting change in the Consolidated Statements of Income. The accounting change has virtually no impact
on annual sales and earnings (before cumulative effect).However, due to the seasonal influences of the business,
the accounting change results in a shift of sales and earnings among the Company’s quarterly periods.As a result,
the Company has restated its earnings for the first three quarters of the fiscal year ended January 29, 2000 (see
Selected Quarterly Financial Data, page 45, for more information). Except for the Selected Quarterly Financial
Data, the Company has not presented pro forma results for prior fiscal years due to immateriality.
B. Di sp osit ions a nd A c q u i s i t i o n s
S a le o f C h ad w i ck ’s o f Bo s t o n : The Company sold its former Chadwick’s division in fiscal 1997 to Brylane,
Inc.As part of the proceeds from the sale, the Company received a $20 million convertible note. During fiscal
1998, the Company converted a portion of the Brylane note into 352,908 shares of Brylane, Inc. common stock
which it sold for $15.7 million. This sale resulted in an after-tax gain of $3.6 million. During fiscal 1999, the
balance of the note was converted into shares of Brylane common stock.A portion of the shares were donated
to the Company’s charitable foundation, and the remaining shares were sold. The net pre-tax impact of these
transactions was immaterial. Pursuant to the agreement, the Company retained the Chadwick’s consumer credit
card receivables. The cash provided by discontinued operations for fiscal 1998 represents the collection of the
remaining balance of the Chadwick’s consumer credit card receivables outstanding as of January 25, 1997.Also
pursuant to the disposition, the Company agreed to purchase certain amounts of excess inventory from Chad-
wick’s.This arrangement has subsequently been amended and extended through fiscal 2002.
S a le o f H i t o r M i s s : Effective September 30, 1995, the Company sold its Hit or Miss division to members of
Hit or Miss management and outside investors.The Company received $3.0 million in cash and a seven-year $10
million note with interest at 10%. During fiscal 1998, the Company forgave a portion of this note and was
released from certain obligations and guarantees which reduced the note to $5.5 million. During fiscal 1999,the
Company settled the note for $2.0 million, the balance of $3.5 million was charged to selling, general and
administrative expenses.
A c qu i s i t i o n o f M a r s ha l l s : On November 17, 1995, the Company acquired the Marshalls family apparel
chain from Melville Corporation.The Company paid $424.3 million in cash and $175 million in junior convertible
preferred stock.The total purchase price of Marshalls, including acquisition costs of $6.7 million, was $606 million.
C . L o n g - Te r m D e b t a n d C r e d i t L i n e s
At January 29, 2000 and January 30, 1999, long-term debt, exclusive of current installments, consisted of the
following:
Ja nua r y 2 9, Ja nua r y 3 0 ,
I n Th o u s a n d s 2000 1999
Equipment notes, interest at 11% to 11.25% maturing
December 12, 2000 to December 30, 2001 $ 73 $ 433
General corporate debt:
Medium term notes, interest at 5.87% to 7.97%, $15 million maturing
October 21, 2003 and $5 million maturing September 20, 2004 20,000 20,000
5 /8% unsecured notes, maturing June 15, 2000
6 – 100,000
7% unsecured notes, maturing June 15, 2005 (effective interest rate of 7.02%
after reduction of the unamortized debt discount of $75,000 and $89,000
in fiscal 2000 and 1999, respectively) 99,925 99,911
7.45% unsecured notes, maturing December 15, 2009 (effective interest rate of
7.50% after reduction of unamortized debt discount of $631,000 in fiscal 2000) 199,369 –
Total general corporate debt 319,294 219,911
Long-term debt, exclusive of current installments $319,367 $220,344
10. The aggregate maturities of long-term debt, exclusive of current installments, at January 29, 2000 are as follows:
G e n e ra l
Equipment C o r p o ra t e
I n Th o u s a n d s Notes D eb t To t a l
Fiscal Year
2002 $73 $ – $ 73
2003 – – –
2004 – 15,000 15,000
2005 – 5,000 5,000
Later years – 299,294 299,294
Aggregate maturities of long-term debt,
exclusive of current installments $73 $319,294 $319,367
In June 1995, the Company issued $200 million of long-term notes; $100 million of 65/8% notes due June 15,
2000 and $100 million of 7% notes due June 15, 2005. The proceeds were used in part to repay short-term
borrowings and for general corporate purposes, including the repayment of scheduled maturities of other
outstanding long-term debt and for new store and other capital expenditures. In December 1999, the Company
issued $200 million of 7.45% ten-year notes, the proceeds of which are being used for general corporate purposes,
including the Company’s ongoing stock repurchase program.
The Company periodically enters into financial instruments to manage its cost of borrowing. In December
1999, the Company entered into a rate-lock agreement to hedge the underlying treasury rate of the $200 million
ten-year notes, prior to their issuance. The cost of this agreement has been deferred and is being amortized to
interest expense over the term of the notes and resulted in an effective rate of 7.6% on the debt.
On November 17, 1995, the Company entered into an unsecured $875 million bank credit agreement which
allowed the Company to borrow up to $500 million on a revolving loan basis to fund the working capital needs
of the Company. In September 1997, the Company replaced this credit agreement with a new five-year $500
million revolving credit facility. The Company recorded an extraordinary charge of $1.8 million, net of income
taxes of $1.2 million, associated with the write-off of deferred financing costs of the former agreement. The new
agreement provides for reduced commitment fees on the unused portion of the line, as well as lower borrowing
costs and has certain financial covenants which require that the Company maintain specified fixed charge cover-
age and leverage ratios.
As of January 29, 2000, all $500 million of the revolving credit facility was available for use. Interest is
payable on borrowings at rates equal to or less than prime. The revolving credit facility is used as backup to the
Company’s commercial paper program. The maximum amount outstanding under this credit agreement during
fiscal 2000 was $108 million.There were no borrowings under this facility during fiscal 1999.The weighted aver-
age interest rate on the Company’s short-term borrowings under this agreement was 6.06% in fiscal 2000. The
Company does not have any compensating balance requirements under these arrangements.The Company also
has C$40 million of credit lines for its Canadian operation, all of which were available as of January 29, 2000.
D. F i n a n c i a l I n s t r u m e n t s
The Company periodically enters into forward foreign exchange contracts to hedge firm U.S. dollar and Euro
dollar merchandise purchase commitments made by its foreign subsidiaries. As of January 29, 2000, the
Company had $21.4 million of such contracts outstanding for its Canadian subsidiary and $4.3 million and 2.5
million Euro dollars for its subsidiary in the United Kingdom. The contracts cover certain commitments for the
first quarter of fiscal 2001 and any gains or losses on the contracts will ultimately be reflected in the cost of the
merchandise. Deferred gains and losses on the contracts as of January 29, 2000 were immaterial.
The Company also has entered into several foreign currency swap and forward contracts in both Canadian
dollars and British pounds sterling. Both the swap and forward agreements are accounted for as a hedge against the
Company’s investment in foreign subsidiaries; thus, foreign exchange gains and losses on the agreements are recog-
nized in shareholders’ equity thereby offsetting translation adjustments associated with the Company’s investment
in foreign operations.The gains and losses on this hedging activity as of January 29, 2000 were immaterial.
11. The Canadian swap and forward agreements will require the Company to pay C$66.2 million in exchange for
$47.2 million in U.S. currency between January 2002 and October 2004. The British pounds sterling swap and
forward agreements will require the Company to pay £65.0 million between January 2001 and October 2002 in
exchange for $103.3 million in U.S. currency.
The agreements contain rights of offset which minimize the Company’s exposure to credit loss in the event of
nonperformance by one of the counterparties. The interest rates payable on the foreign currency swap agree-
ments are slightly higher than the interest rates receivable on the currency exchanged, resulting in deferred inter-
est costs which are being amortized to interest expense over the term of the related agreements. The premium
costs or discounts associated with the forward contracts are being amortized over the term of the related agree-
ments and are included with the gains or losses of the hedging instrument. The unamortized balance of the net
deferred costs was $2.1 million and $3.2 million as of January 29, 2000 and January 30, 1999, respectively.
The counterparties to the forward exchange contracts and swap agreements are major international financial
institutions.The Company periodically monitors its position and the credit ratings of the counterparties and does
not anticipate losses resulting from the nonperformance of these institutions.
The fair value of the Company’s long-term debt, including current installments, is estimated using discounted
cash flow analysis based upon the Company’s current incremental borrowing rates for similar types of borrow-
ing arrangements.The fair value of long-term debt, including current installments, at January 29, 2000 approxi-
mates the carrying value of $419.7 million. These estimates do not necessarily reflect certain provisions or
restrictions in the various debt agreements which might affect the Company’s ability to settle these obligations.
E. Commitments
The Company is committed under long-term leases related to its continuing operations for the rental of real
estate, and fixtures and equipment. Virtually all of the Company’s leases are for a ten year initial term with
options to extend for one or more five year periods. Certain Marshalls leases, acquired in fiscal 1996, had
remaining terms ranging up to twenty-five years. Leases for T.K. Maxx are generally for fifteen to twenty-five
years with ten year kick-out options. Many of the leases contain escalation clauses. In addition, the Company is
generally required to pay insurance, real estate taxes and other operating expenses including, in some cases,
rentals based on a percentage of sales.
Following is a schedule of future minimum lease payments for continuing operations as of January 29, 2000:
C ap i t a l O p e rati n g
I n Th o u s a n d s Leases Leases
Fiscal Year
2001 $ – $ 361,037
2002 3,415 334,796
2003 3,726 310,638
2004 3,726 278,996
2005 3,726 243,653
Later years 41,574 1,053,016
Total future minimum lease payments $56,167 $2,582,136
The capital lease commitments relate to a 283,000 square foot addition to the Company’s home office facility.
Construction of the addition is in progress, with completion currently scheduled for the first quarter of fiscal
2002. The Company will recognize a capital lease asset and related obligation of approximately $34 million at
the time rental payments are to commence.
The rental expense under operating leases for continuing operations amounted to $352.6 million, $318.1
million and $301.9 million for fiscal years 2000, 1999 and 1998, respectively. The present value of the
Company’s operating lease obligations approximates $1,814.8 million as of January 29, 2000, including $225.1
million payable on operating lease obligations in fiscal 2001.
The Company had outstanding letters of credit in the amounts of $37.6 million and $40.4 million as of
January 29, 2000 and January 30, 1999, respectively. Letters of credit are issued by the Company primarily for
the purchase of inventory.
12. F. S t o c k C o m p e n s a t i o n P l a n s
In the following note, all references to historical awards, outstanding awards and availability of shares for future
grants under the Company’s stock incentive plans and related prices per share have been restated, for compara-
bility purposes, for the two-for-one stock splits distributed in June 1998 and June 1997.
The Company has a Stock Incentive Plan under which options and other stock awards may be granted to
certain officers and key employees. The Stock Incentive Plan, as amended, provides for the issuance of up to 42
million shares with 12.5 million shares available for future grants as of January 29, 2000. The Company also has
a Directors’ Stock Option Plan under which stock options are granted to directors who are not otherwise
employed by the Company. This plan provides for the issuance of up to 200,000 shares.There are 66,000 shares
available for future grants under this plan as of January 29, 2000.
Under its stock option plans, the Company has granted options for the purchase of common stock, generally
within ten years from the grant date at option prices of 100% of market price on the grant date. Most options
outstanding are exercisable at various percentages starting one year after the grant, while certain options are
exercisable in their entirety three years after the grant date. Options granted to directors become fully exercis-
able one year after the date of grant.
A summary of the status of the Company’s stock options and related Weighted Average Exercise Prices
(“WAEP”), adjusted for the two-for-one stock splits distributed in June 1998 and June 1997, is presented below
(shares in thousands):
Fi sc al Ye ar E n ded
Janu ar y 2 9, 2 00 0 Ja nu ar y 30 , 1 999 Jan u ar y 31, 1 998
S h a re s WA E P S h a re s WA E P S h a re s WA E P
Outstanding at beginning of year 10,105 $12.04 10,507 $ 9.04 8,192 $ 6.10
Granted 3,164 29.26 1,964 21.77 4,338 12.97
Exercised (1,275) 7.13 (2,215) 6.31 (1,756) 5.31
Canceled (162) 20.52 (151) 13.35 (267) 7.31
Outstanding at end of year 11,832 17.06 10,105 12.04 10,507 9.04
Options exercisable at end of year 5,980 $10.77 4,796 $ 8.01 3,932 $ 5.89
Virtually all canceled options are forfeitures. The Company realizes an income tax benefit from the exercise of
stock options which results in a decrease in current income taxes payable and an increase in additional paid-in
capital. Such benefits amounted to $11.7 million, $13.8 million and $6.1 million for the fiscal years ended Janu-
ary 29, 2000, January 30, 1999 and January 31, 1998, respectively.
The Company has adopted the disclosure-only provisions of Statement of Financial Accounting Standards
(SFAS) No. 123, “Accounting for Stock-Based Compensation,” and continues to apply the provisions of Account-
ing Principles Board (APB) Opinion No. 25, “Accounting for Stock Issued to Employees,” in accounting for
compensation expense under its stock option plans.The Company grants options at fair market value on the date
of the grant; accordingly, no compensation expense has been recognized for the stock options issued during fiscal
years 2000, 1999 or 1998. Compensation expense determined in accordance with SFAS No. 123, net of related
income taxes, would have amounted to $12.9 million, $8.7 million and $5.5 million for fiscal 2000, fiscal 1999
and fiscal 1998, respectively. Income from continuing operations, net income and related earnings per share
amounts presented on a pro forma basis are as follows:
13. Un a ud ite d P r o Form a Fi sc al Ye ar E n ded
Ja nua ry 2 9, Ja nua ry 3 0, Ja nua r y 3 1 ,
Do ll ars I n Th ous a nd s E xc ep t Pe r S har e A m o u n t s 2000 1999 1998
(5 3 we e k s )
Income from continuing operations before extraordinary
item and cumulative effect of accounting change $513,862 $424,512 $301,129
Per diluted share $ 1.62 $ 1.27 $ .86
Net income $508,708 $415,464 $299,352
Per diluted share $ 1.60 $ 1.24 $ .85
For purposes of applying the provisions of SFAS No. 123 for the pro forma calculations, the fair value of each
option grant issued during fiscal 2000, 1999 and 1998 is estimated on the date of grant using the Black-Scholes
option pricing model with the following assumptions: dividend yield of 1% in each fiscal year, expected volatil-
ity of 46%, 40% and 38% in fiscal 2000, 1999 and 1998, respectively, a risk-free interest rate of 6.4% in fiscal
2000, 5.0% in fiscal 1999 and 5.8% in fiscal 1998, and expected holding periods of six years in all fiscal peri-
ods. The weighted average fair value of options granted during fiscal 2000, 1999 and 1998 was $14.38, $9.28
and $5.52 per share, respectively.
The effects of applying SFAS No. 123 in this pro forma disclosure are not indicative of future amounts. SFAS
No. 123 does not apply to awards prior to 1995, and additional awards in future years are anticipated.
The following table summarizes information about stock options outstanding as of January 29, 2000 (shares
in thousands):
Op tio ns Ou ts ta nd i ng O p ti ons E xe rc i s a bl e
We i g h t e d
Ave rage We i g h t e d We i g h t e d
R a n ge o f Remaining Ave rage Ave rage
E xe rc is e Pr i ce s S h a re s C o n t ra ct L i fe E xe r ci se P ric e S h a re s E xe r ci s e Pr ic e
$12.5625 - $16.3125 1,575 4.2 Years $ 5.06 1,575 $ 5.06
$16.3126 - $10.6875 2,766 6.8 Years 9.71 2,433 9.58
$10.6876 - $14.4688 2,503 7.5 Years 13.97 1,340 14.44
$14.4689 - $21.7500 1,829 8.6 Years 21.74 604 21.74
$21.7501 - $30.5000 3,159 9.6 Years 29.21 28 23.94
Total 11,832 7.6 Years $17.06 5,980 $10.77
During fiscal 1998, a special deferred compensation award was granted to the Company’s then Chief Executive
Officer, initially denominated in 900,000 shares of the Company’s stock with a fair value of $10.69 per share at
the date of grant. The shares vested at the time of the grant and the Company recorded a deferred compensa-
tion charge of $9.6 million at the time of the grant.The award provided the executive the option to periodically
denominate the shares granted into other investments. The Company was subject to income statement charges
or credits for changes in the fair market value ofTJX common stock to the extent the award, or a portion thereof,
was denominated in TJX stock. The Company recorded additional compensation expense of $1.1 million, $6.3
million and $5.6 million in fiscal 2000, 1999 and 1998, respectively, due to the increase in market value of the
shares of Company stock from date of grant.As of January 29, 2000, all of the shares have been denominated
into other investments. The Company separately transferred funds to a trust in an amount equal to the value of
the new investment elections at the time such elections were made by the executive.The trust assets are included
in other assets on the balance sheet and are invested in a manner that matches the elections made by the exec-
utive. Thus, deferred compensation adjustments due to the change in the executive’s deferred compensation
account are offset by similar amounts due to gains or losses on the trust assets.
The Company has also issued restricted stock and performance based stock awards under the Stock Incentive
Plan. Restricted stock awards are issued at par value, or at no cost, and have restrictions which generally lapse
over three to five years from date of grant.At January 31, 1998, the performance based stock awards had either
vested or been forfeited. The market value in excess of cost is charged to income ratably over the period during
14. which these awards vest, such pre-tax charges amounted to $1.1 million, $619,000 and $2.7 million in fiscal
years 2000, 1999 and 1998, respectively. The market value of the awards is determined at date of grant for
restricted stock awards, and at the date shares are earned for performance based awards.
There has been a combined total of 131,480 shares,4,000 shares and 1,023,834 shares for deferred, restricted
and performance based awards issued in the fiscal years ended January 2000, 1999 and 1998, respectively.There
were 3,000 and 300,000 shares forfeited for the fiscal years ended January 2000 and 1998, respectively. There
were no shares forfeited during the fiscal year ended January 1999.The weighted average market value per share
of these stock awards at grant date was $29.55, $18.03 and $10.89 for fiscal 2000, 1999 and 1998, respectively.
During fiscal 1998, the Company formed a deferred stock compensation plan for its outside directors which
replaced the Company’s retirement plan for directors. Each director’s deferred stock account has been credited
with deferred stock to compensate for the value of such director’s accrued retirement benefit.Additional share
awards valued at $10,000 are issued annually to each eligible director. Currently, there are 27,391 deferred
shares outstanding, actual shares will be issued at retirement.The Company has 100,000 shares held in treasury
from which such shares will be issued.
G . C a p i t a l S t o c k a n d E a r n i n g s Pe r S h a r e
C a p i t a l St o ck : The Company distributed a two-for-one stock split, effected in the form of a 100% stock divi-
dend, on June 25, 1998 to shareholders of record on June 11, 1998, which resulted in the issuance of 158.9
million shares of common stock and corresponding decreases of $96.5 million in additional paid-in capital and
$62.4 million in retained earnings. Similar transfers were made between additional paid-in capital and common
stock in the amount of $79.8 million, reflecting the two-for-one stock split of June 26, 1997 to shareholders of
record on June 11, 1997.All historical earnings per share amounts have been restated to reflect both two-for-
one stock splits. Reference to common stock activity before the distribution of the related stock split has not
been restated unless otherwise noted.All activity after the distribution date reflects the two-for-one stock splits.
On November 17, 1995, the Company issued 1.5 million shares of Series E cumulative convertible preferred
stock as part of the purchase price for Marshalls. The shares of Series E preferred stock, initially issued at a face
value of $150 million, carried an annual dividend rate of $7.00 per share. During fiscal 1998, 770,200 shares of
the Series E preferred stock were voluntarily converted into 8.3 million shares of common stock and 2,500 shares
were repurchased. During fiscal 1999, 357,300 shares of Series E were voluntarily converted into 6.7 million
shares of common stock. On November 18, 1998, the remaining 370,000 shares of the Series E preferred stock
were mandatorily converted into 8.0 million shares of common stock in accordance with its terms. Inducement
fees of $130,000 and $3.8 million were paid on the Series E voluntary conversions in fiscal 1999 and fiscal 1998,
respectively. The Company recorded aggregate dividends, including inducement fees, on its preferred stock of $3.5
million in fiscal 1999 and $11.7 million in fiscal 1998. The preferred dividends reduce net income in computing
net income available to common shareholders. As of January 29, 2000, the Company has authorization for the
issuance of up to 5 million shares of preferred stock with none issued or outstanding at January 29, 2000.
In June 1997, the Company announced a $250 million stock repurchase program. During fiscal 1998, the
Company repurchased and retired 17.1 million shares of common stock (adjusted for stock splits) for a cost of
$245.2 million.The program was completed in February 1998, at which time the Company announced a second
$250 million stock repurchase program. In October 1998, the Company completed the second $250 million
stock repurchase program, having repurchased 8.7 million shares, and announced its intentions to repurchase
an additional $750 million of common stock over the next several years. The Company spent $601.3 million
and $95.5 million through January 29, 2000 and January 30, 1999, respectively, on this repurchase program.
In total, through January 29, 2000, the Company repurchased and retired 27.7 million shares under the $750
million repurchase program. Subsequent to year-end, the Company repurchased an additional 2.7 million
shares, completing the $750 million stock repurchase program and announced a new multi-year, $1 billion
stock repurchase program.
15. E ar ni n g s Pe r S h a r e : The following schedule presents the calculation of basic and diluted earnings per share
for income from continuing operations:
Fi sc al Ye ar E n ded
Ja nua ry 2 9, Ja nua r y 3 0, Ja nua r y 3 1 ,
Do ll ars I n Th ous a nd s E xc ep t Pe r S har e A m o u n t s 2000 1999 1998
(5 3 we e k s )
Basic earnings per share:
Income from continuing operations before extraordinary item
and cumulative effect of accounting change $526,822 $433,202 $306,592
Less preferred stock dividends – 3,523 11,668
Income from continuing operations before extraordinary
item and cumulative effect of accounting change
available to common shareholders $526,822 $429,679 $294,924
Weighted average common stock outstanding
for basic earnings per share 314,577,145 318,073,081 321,474,046
Basic earnings per share $ 1.67 $ 1.35 $ .92
Diluted earnings per share:
Income from continuing operations before extraordinary
item and cumulative effect of accounting change
available to common shareholders $526,822 $429,679 $294,924
Add preferred stock dividends – 3,523 11,668
Income from continuing operations before extraordinary item
and cumulative effect of accounting change for diluted
earnings per share calculation $526,822 $433,202 $306,592
Weighted average common stock outstanding
for basic earnings per share 314,577,145 318,073,081 321,474,046
Assumed conversion of:
Convertible preferred stock – 10,914,354 24,032,172
Stock options and awards 3,213,619 5,660,515 4,105,966
Weighted average common shares for
diluted earnings per share calculation 317,790,764 334,647,950 349,612,184
Diluted earnings per share $ 1.66 $ 1.29 $ .88
The weighted average common shares for diluted earnings per share calculation at January 29, 2000 excludes
the incremental effect related to outstanding stock options whose exercise price is in excess of the average price
of the Company’s stock of $28.50 for the fiscal year. These options are excluded due to their antidilutive effect
at January 29, 2000.
H . I n c o m e Ta xe s
The provision for income taxes includes the following:
Fi sc al Ye ar E n ded
Ja nua ry 2 9, Ja nua r y 3 0, Ja nua r y 3 1 ,
I n Th o u s a n d s 2000 1999 1998
( 5 3 we e k s )
Current:
Federal $255,277 $231,811 $172,026
State 49,836 45,117 39,200
Foreign 20,212 13,784 8,117
Deferred:
Federal 3,885 (13,084) (3,432)
State 1,984 (2,306) (326)
Foreign (4,079) (4,512) 94
Provision for income taxes $327,115 $270,810 $215,679
16. The Company had a net deferred tax asset as follows:
Ja nua r y 2 9, Ja nua r y 3 0 ,
I n Th o u s a n d s 2000 1999
Deferred tax assets:
Foreign net operating loss carryforward $ 30,107 $ 30,660
Reserve for discontinued operations 10,900 12,074
Reserve for closed store and restructuring costs 11,569 19,767
Insurance costs not currently deductible for tax purposes 1,025 7,496
Pension, postretirement and employee benefits 48,968 48,556
Leases 15,596 13,379
Other 24,709 24,255
Valuation allowance (15,678) (27,321)
Total deferred tax assets 127,196 128,866
Deferred tax liabilities:
Property, plant and equipment 19,240 17,056
Safe harbor leases 24,450 31,738
Tradename 45,408 47,373
Other 14,955 10,313
Total deferred tax liabilities 104,053 106,480
Net deferred tax asset $ 23,143 $ 22,386
The Company has elected to repatriate the fiscal 2000 and 1999 earnings of its Canadian subsidiary. The major-
ity of the fiscal 2000 and 1999 earnings from of its Canadian subsidiary were repatriated and deferred foreign
tax credits have been provided for on the undistributed portions for these years. Prior earnings of its Canadian
subsidiary and all the earnings of the Company’s other foreign subsidiaries are indefinitely reinvested and no
deferred taxes have been provided for on those earnings.
The Company has a United Kingdom and a Netherlands net operating loss carryforward of approximately $51
million and $9 million, respectively, for both tax and financial reporting purposes.The United Kingdom and Nether-
lands net operating losses do not expire under the current tax laws of each country. The Company also has a
Puerto Rico net operating loss carryforward of approximately $30 million, for tax and financial reporting
purposes, which was acquired in the Marshalls acquisition and expires in fiscal years 2001 through 2003. The
Company recognized a deferred tax asset of $8.0 million and $3.4 million, in fiscal years 2000 and 1999 respec-
tively, for the estimated future utilization of the Puerto Rico net operating loss carryforward. The valuation
allowance relates to the Company’s foreign net operating losses that have not yet been recognized or are likely
to expire. Additional utilization of these net operating loss carryforwards is dependent upon future earnings of
the Company’s foreign subsidiaries.
The Company’s worldwide effective tax rate was 38% for the fiscal years ended January 29, 2000, and January 30,
1999, and 41% for the fiscal year ended January 31, 1998.The difference between the U.S. federal statutory income
tax rate and the Company’s worldwide effective income tax rate is summarized as follows:
Fi sc al Ye ar E n ded
Ja nua ry 2 9, Ja nua r y 3 0, Ja nua r y 3 1 ,
2000 1999 1998
U.S. federal statutory income tax rate 35% 35% 35%
Effective state income tax rate 4 4 5
Impact of foreign operations (1) (1) –
All other – – 1
Worldwide effective income tax rate 38% 38% 41%
17. I . Pe n s i o n P l a n s a n d O t h e r R e t i r e m e n t B e n e f i t s
The Company has a non-contributory defined benefit retirement plan covering the majority of full-time U.S.
employees. Employees who have attained twenty-one years of age and have completed one year of service are
covered under the plan. Benefits are based on compensation earned in each year of service. The Company also
has an unfunded supplemental retirement plan which covers certain key employees of the Company and
provides additional retirement benefits based on average compensation and an unfunded postretirement medical
plan which provides limited postretirement medical and life insurance benefits to associates who participate in
the Company’s retirement plan and who retire at age fifty-five or older with ten or more years of service.
Presented below is certain financial information relating to the Company’s retirement plans for the fiscal years
indicated:
Pe n s i o n Po s t re t i r eme nt Med ic al
Fi sc al Ye ar E n ded Fi sc al Ye ar E n ded
Ja nu a ry 2 9, Ja nu a ry 3 0, Ja nua ry 2 9, Ja nua r y 3 0,
Do ll ars I n Th o u s a n d s 2000 1999 2000 1999
C h a n ge i n b e n e f i t o bl i ga t i o n :
Benefit obligation at beginning of year $152,047 $127,148 $24,992 $21,172
Service cost 11,781 10,538 1,366 1,405
Interest cost 10,768 9,647 1,430 1,610
Participants’ contributions – – 14 11
Actuarial (gains) losses (20,393) 11,027 (8,165) 1,712
Settlement (7,434) – – –
Benefits paid (6,039) (5,497) (1,108) (918)
Expenses paid (720) (816) – –
Benefit obligation at end of year $140,010 $152,047 $18,529 $24,992
C h a n ge i n plan as sets:
Fair value of plan assets at beginning of year $123,191 $110,234 $ – $ –
Actual return on plan assets 15,024 8,164 – –
Employer contribution 8,735 11,106 1,094 907
Participants’ contributions – – 14 11
Benefits paid (6,039) (5,497) (1,108) (918)
Expenses paid (720) (816) – –
Fair value of plan assets at end of year $140,191 $123,191 $ – $ –
Reconciliation of funded status:
Benefit obligation at end of year $140,010 $152,047 $18,529 $24,992
Fair value of plan assets at end of year 140,191 123,191 – –
Funded status – excess (assets) obligations (181) 28,856 18,529 24,992
Unrecognized transition obligation 447 522 – –
Unrecognized prior service cost 685 773 1,278 1,616
Unrecognized actuarial (gains) losses (21,282) 4,909 (4,167) 3,997
Net accrued liability recognized $ 19,969 $ 22,652 $21,418 $19,379
We i g h t e d a v e ra g e a s s u m p t i o n s :
Discount rate 7.66% 6.63% 7.75% 6.75%
Expected return on plan assets 9.00% 9.00% N/A N/A
Rate of compensation increase 4.00% 4.00% 4.00% 4.00%
The projected benefit obligation and accumulated benefit obligation of the Company’s unfunded supplemental
retirement plan was $18.6 million and $14.3 million, respectively, as of January 29, 2000 and $26.2 million and
$20.1 million, respectively, as of January 30, 1999.
18. For measurement purposes of the postretirement medical plan, a 3.77% annual rate of increase in the per
capita cost of covered health care benefits was assumed and is gradually reduced to zero. The impact of medical
inflation eventually diminishes because of the $3,000 per capita annual limit on medical benefits.An increase in
the assumed health care cost trend rate of one percentage point for all future years would increase the accumu-
lated postretirement benefit obligation at January 29, 2000 by about $868,000 and the total of the service cost
and interest cost components of net periodic postretirement cost for fiscal 2000, by about $151,000. Similarly,
decreasing the trend rate by one percentage point for all future years would decrease the accumulated postre-
tirement benefit obligation at January 29, 2000 by about $826,000 as well as the total of the service cost and
interest cost components of net periodic postretirement cost for fiscal 2000, by about $145,000.
Following are the components of net periodic benefit cost:
Pe n s i o n Po s t re t i r e m e n t M e di c al
Fi s c a l Ye a r E n d e d Fi s ca l Ye a r E n de d
Jan u a r y 2 9, Ja n u a r y 3 0 , Ja n u a r y 3 1, Jan u a r y 2 9, Ja n u a r y 3 0 , Ja n u a r y 3 1,
I n Th o u s a n d s 2000 1999 1998 2000 1999 1998
Service cost $ 11,781 $10,538 $ 8,372 $1,366 $1,405 $1,366
Interest cost 10,768 9,647 8,398 1,430 1,610 1,649
Expected return on plan assets (11,060) (9,991) (7,937) – – –
Amortization of transition obligation 75 75 75 – – –
Amortization of prior service cost 87 87 837 332 338 749
Recognized actuarial losses 415 2,702 206 – 103 –
Net periodic benefit cost $ 12,066 $13,058 $ 9,951 $3,128 $3,456 $3,764
During the fiscal year ended January 29, 2000, the Company and its then Chief Executive Officer entered into
an agreement whereby the executive waived his right to benefits under the Company’s nonqualified plan in
exchange for the Company’s funding of a split-dollar life insurance policy. The exchange was accounted for as a
settlement and the Company incurred a $1.5 million settlement loss, which is primarily the recognition of a
portion of the deferred losses under the plan.The benefit exchange was designed so that the after-tax cash expen-
ditures by the Company on the split-dollar policy are substantially equivalent on a present value basis to the
after-tax cash expenditures the Company would have incurred under the nonqualified plan.
The Company also sponsors an employee savings plan under Section 401(k) of the Internal Revenue Code
for all eligible U.S. employees. Employees may contribute up to 15% of eligible pay. The Company matches
employee contributions, up to 5% of eligible pay, at rates ranging from 25% to 50% based upon Company
performance. The Company contributed, for all 401(k) plans, $6.2 million in fiscal 2000, $6.4 million in fiscal
1999 and $5.7 million in fiscal 1998.
In the fourth quarter of fiscal 1999, the Company established a nonqualified savings plan for certain U.S.
employees.The Company matches employee contributions at various rates which amounted to $634,000 in fiscal
2000 and $210,000 in fiscal 1999. The Company transfers employee withholdings and the related company
match to a separate trust designated to fund the future obligations. The Company includes the trust assets in
other assets on the balance sheets.
In addition to the plans described above, the Company also maintains retirement/deferred savings plans for
all eligible associates at its foreign subsidiaries. The Company contributed for these plans $682,000, $534,000
and $440,000 in fiscal years 2000, 1999 and 1998, respectively.
19. J. A c c r u e d E x p e n s e s a n d O t h e r C u r r e n t L i a b i l i t i e s
The major components of accrued expenses and other current liabilities are as follows:
Ja nua ry 2 9, Ja nua ry 3 0,
I n Th o u s a n d s 2000 1999
Employee compensation and benefits $197,237 $173,630
Reserve for discontinued operations 27,304 29,660
Store closing and restructuring reserve, continuing operations 15,731 44,598
Insurance 26,436 44,654
Rent, utilities, advertising and other 383,630 396,451
Accrued expenses and other current liabilities $650,338 $688,993
The Company’s reserve for discontinued operations relates to obligations the Company retained or incurred in
connection with the sale of its former Zayre, Hit or Miss and Chadwick’s operations. During fiscal 2000, net
expenditures of $2.3 million, relating primarily to lease obligations, reduced the reserve. During fiscal 1999, the
reserve increased by a net amount of $11.9 million.The Company added $15 million to the reserve for additional
lease related obligations, primarily for Hit or Miss locations, which was offset by charges against the reserve in
fiscal 1999 of $3.1 million, primarily for charges for lease related costs associated with the former Zayre stores.
The balance in the discontinued operations reserve of $27.3 million as of January 29, 2000 is for lease related
obligations of the former Zayre and Hit or Miss locations, which are expected to reduce operating cash flows in
varying amounts over the next ten to fifteen years, as leases reach their expiration dates or are settled.
The reserve for store closings and restructurings is primarily for costs associated with the disposition and
settlement of leases for the T.J. Maxx and Marshalls closings anticipated as a result of the Marshalls acquisition.
The initial reserves established in fiscal 1996 were estimated at $244.1 million for the Marshalls store closing and
restructuring plan and $35.0 million for the closing of certain T.J. Maxx stores. The estimated cost of $244.1
million for the Marshalls closings, recorded in fiscal 1996, was reduced in subsequent years due to a reduction
in the number of planned closings and a reduction in the estimated cost of settling the related lease obligations.
Reflecting these changes, the Company reduced the total reserve by $85.9 million in fiscal 1997 with additional
adjustments reducing the reserve by $15.8 million in fiscal 1998 and $3.0 million in fiscal 2000.This reserve was
a component of the allocation of the purchase price for Marshalls and the reserve adjustments in each fiscal year
resulted in a corresponding reduction in the value assigned to the long-term assets acquired. The revised esti -
mated cost for the Marshalls closing and restructuring plan of $139.4 million, includes $67.8 million for lease
related obligations for 70 store and other facility closings, $9.6 million for property write-offs, $44.1 million for
inventory markdowns and $17.9 million for severance, professional fees and all other costs associated with the
restructuring plan. Property write-offs were the only non-cash charge to the reserve.The reserve established for
the closing of certain T.J. Maxx stores in connection with the Marshalls acquisition was initially estimated at
$35.0 million and was recorded as a pre-tax charge to income from continuing operations in fiscal 1996. Due to
lower than anticipated costs of the T.J. Maxx closings, the Company recorded a pre-tax credit to income from
continuing operations of $300,000 in fiscal 2000, $1.8 million in fiscal 1999 and $8.0 million in fiscal 1997.An
additional charge to continuing operations of $700,000 was recorded in fiscal 1998. The revised estimated cost
of the T.J. Maxx closings of $25.6 million, includes $13.5 million for lease related obligations of 32 store clos-
ings, non-cash charges of $9.8 million for property write-offs and $2.3 million for severance, professional fees
and all other costs associated with the closings.All of the Marshalls and T.J. Maxx stores identified in the plan
were closed as of January 30, 1998.
The remaining balance in the store closing and restructuring reserve as of January 29, 2000 is $15.7 million.
This balance is primarily for the estimated cost of the future lease obligations of the closed stores. The estimates
and assumptions used in developing the remaining reserve requirements are subject to change, however, TJX
believes it has adequate reserves for these obligations.The reserve also includes some activity relating to several
HomeGoods store closings, the impact of which is immaterial. The following is a summary of the activity in the
store closing and restructuring reserve for the last three fiscal years:
20. Fi sc al Ye ar E n ded
Ja nua ry 2 9, Ja nua r y 3 0, Ja nua r y 3 1 ,
I n Th o u s a n d s 2000 1999 1998
Balance at beginning of year $ 44,598 $ 57,966 $ 95,867
Additions to the reserve – 1,961 –
Reserve adjustments:
Adjust Marshalls restructuring reserve (3,000) – (15,843)
Adjust T.J. Maxx store closing reserve (300) (1,800) 700
Charges against the reserve:
Lease related obligations (23,734) (12,521) (13,593)
Severance and all other cash charges – (927) (1,876)
Net activity relating to HomeGoods closings (1,833) (81) (1,887)
Non-cash property write-offs – – (5,402)
Balance at end of year $ 15,731 $ 44,598 $ 57,966
The use of the reserve will reduce operating cash flows in varying amounts over the next ten to fifteen years as
the related leases reach their expiration dates or are settled.
K . S u p p l e m e n t a l C a s h F l o w s I n fo r m a t i o n
There were no cash flows attributable to the operating results of the Company’s discontinued operations during
the years ended January 29, 2000 or January 30, 1999. The cash provided by discontinued operations for fiscal
1998 represents the collection of the balance of the credit card receivables retained by the Company upon the
sale of its former Chadwick’s division. The Company is also responsible for certain leases related to, and other
obligations arising from, the sale of these operations, for which reserves have been provided in its reserve for
discontinued operations. These reserves are included in accrued expenses. The cash flow impact of these obliga-
tions is reflected as a component of cash provided by operating activities in the statements of cash flows.
The Company’s cash payments for interest and income taxes, including discontinued operations, and its non-
cash investing and financing activities are as follows:
Fi sc al Ye ar E n ded
Ja nua ry 2 9, Ja nua r y 3 0, Ja nua r y 3 1 ,
I n Th o u s a n d s 2000 1999 1998
( 5 3 we e k s )
Cash paid for:
Interest $ 19,018 $ 22,542 $ 26,359
Income taxes 332,622 275,538 199,025
Non-cash investing and financing activities:
Conversion of Series E cumulative convertible
preferred stock into common stock – $ 72,730 $ 77,020
Distribution of two-for-one stock split – 158,954 79,823
Change in accrued expenses due to:
Stock repurchase (3,300) 12,575 –
Dividends payable 977 1,246 1,973
L . D i s c o n t i n u e d O p e ra t i o n s a n d R e l a t e d C o n t i n g e n t L i a b i l i t i e s
In October 1988, the Company completed the sale of its former Zayre Stores division to Ames Department
Stores,Inc. (“Ames”). In April 1990,Ames filed for protection under Chapter 11 of the Federal Bankruptcy Code
and in December 1992,Ames emerged from bankruptcy under a plan of reorganization.
21. The Company remains contingently liable for the leases of most of the former Zayre stores still operated by
Ames. The Company believes that the Company’s contingent liability on these leases will not have a material
effect on the Company’s financial condition.
The Company is also contingently liable on certain leases of its former warehouse club operations (BJ’s Whole-
sale Club and HomeBase), which was spun-off by the Company in fiscal 1990 as Waban Inc. During fiscal 1998,
Waban Inc. was renamed HomeBase, Inc. and spun-off from its BJ’s Wholesale Club division (BJ’s Wholesale Club,
Inc.).HomeBase, Inc. and BJ’s Wholesale Club, I n c .a re primarily liable on their respective leases and have indem-
nified the Company for any amounts the Company may have to pay with respect to such leases. In addition,
HomeBase, Inc., BJ’s Wholesale Club, Inc. and the Company have entered into agreements under which BJ’s
Wholesale Club, Inc. has substantial indemnification responsibility with respect to such HomeBase, Inc.leases.The
Company is also contingently liable on certain leases of BJ’s Wholesale Club, Inc. for which both BJ’s Wholesale
Club, Inc. and HomeBase, Inc. remain liable.The Company believes that its contingent liability on the HomeBase,
Inc. and BJ’s Wholesale Club, Inc. leases will not have a material effect on the Company’s financial condition.
The Company is also contingently liable on approximately 24 store leases and the office and warehouse leases
of its former Hit or Miss division which was sold by the Company in September 1995. During the third quarter
of fiscal 1999, the Company increased its reserve for its discontinued operations by $15 million ($9 million after
tax), primarily for potential lease liabilities relating to guarantees on leases of its former Hit or Miss division.
The after-tax cost of $9 million, or $.02 per diluted share, was recorded as a loss from discontinued operations.
M . S e g m e n t I n fo r m a t i o n
The Company has two reportable segments. The off-price family apparel segment includes the T.J. Maxx,
Marshalls and A.J.Wright domestic store chains and the Company’s foreign store chains,Winners and T.K. Maxx.
The Company manages the results of its T.J. Maxx and Marshalls chains on a combined basis. The other chains,
whose operating results are managed separately, sell similar product categories and share similar economic and
other characteristics of the T.J. Maxx and Marshalls operations and are aggregated with the off-price family
apparel segment.This segment generated 8.9% of its fiscal 2000 revenue from its foreign operations.All of these
stores offer apparel for the entire family with limited offerings of giftware and domestics. The Company’s other
segment, the off-price home fashion stores, is made up of the Company’s HomeGoods stores, which offer a wide
variety of home furnishings.
The Company evaluates the performance of its segments based on pre-tax income before general corporate
expense, goodwill amortization and interest. For data on business segments for fiscal years 2000, 1999 and 1998,
see page 22.