1. News Release
Contacts:
Steve Dale Judith T. Murphy
Media Relations Investor Relations
(612) 303-0784 (612) 303-0783
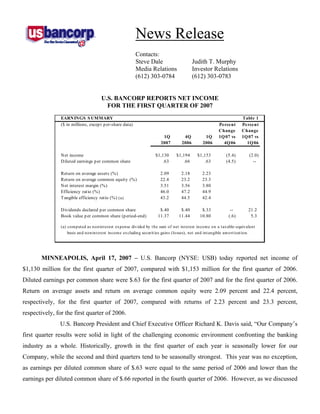
U.S. BANCORP REPORTS NET INCOME
FOR THE FIRST QUARTER OF 2007
EARNINGS S UMMARY Table 1
($ in millions, excep t p er-share data) Percent Percent
Change Change
1Q 4Q 1Q 1Q 07 vs 1Q 07 vs
2007 2006 2006 4Q 06 1Q 06
Net income $1,130 $1,194 $1,153 (5.4) (2.0)
Diluted earnings p er common share .63 .66 .63 (4.5) --
Return on average assets (%) 2.09 2.18 2.23
Return on average common equity (%) 22.4 23.2 23.3
Net interest margin (%) 3.51 3.56 3.80
Efficiency ratio (%) 46.0 47.2 44.9
T angible efficiency ratio (%) (a) 43.2 44.5 42.4
Dividends declared p er common share $.40 $.40 $.33 -- 21.2
Book value p er common share (p eriod-end) 11.37 11.44 10.80 (.6) 5.3
(a) com put ed as nonint erest expense divided by t he sum of net int erest incom e on a t axable-equivalent
basis and nonint erest incom e excluding securit ies gains (losses), net and int angible am ort izat ion.
MINNEAPOLIS, April 17, 2007 – U.S. Bancorp (NYSE: USB) today reported net income of
$1,130 million for the first quarter of 2007, compared with $1,153 million for the first quarter of 2006.
Diluted earnings per common share were $.63 for the first quarter of 2007 and for the first quarter of 2006.
Return on average assets and return on average common equity were 2.09 percent and 22.4 percent,
respectively, for the first quarter of 2007, compared with returns of 2.23 percent and 23.3 percent,
respectively, for the first quarter of 2006.
U.S. Bancorp President and Chief Executive Officer Richard K. Davis said, “Our Company’s
first quarter results were solid in light of the challenging economic environment confronting the banking
industry as a whole. Historically, growth in the first quarter of each year is seasonally lower for our
Company, while the second and third quarters tend to be seasonally strongest. This year was no exception,
as earnings per diluted common share of $.63 were equal to the same period of 2006 and lower than the
earnings per diluted common share of $.66 reported in the fourth quarter of 2006. However, as we discussed
2. U.S. Bancorp Reports First Quarter 2007 Results
April 17, 2007
Page 2
in January, our fourth quarter earnings benefited from a number of notable items, including a gain on the sale
of the Company’s 401(k) defined contribution recordkeeping business and incremental tax benefits from the
resolution of certain state and federal tax examinations. After consideration of these significant items, net
income in the first quarter of this year was actually slightly higher than the fourth quarter. Reflected in this
quarter’s results were continued strong growth in our fiduciary-related fee income businesses and double
digit year-over-year growth in payment services, as well as prudent balance sheet expansion, controlled
expenses and strong credit quality. Further, our profitability metrics remained among the best in the
industry, with return on average assets of 2.09 percent and return on average common equity of 22.4 percent.
These results, which did not include any unusual income or expense items, establish a strong base from
which our earnings will grow in the remaining quarters of 2007 and beyond.
“Although our fee-based businesses continued to show good growth, our net interest margin declined
to 3.51 percent in the first quarter. This was a 29 basis point decline from the first quarter of 2006 and a 5
basis point decline from the fourth quarter of 2006. On a linked quarter basis, the 5 basis point reduction
was slightly more than we had expected for a number of reasons, one of which was an accelerated stock
repurchase agreement that the Company initiated in February. We do expect the margin to decline slightly
over the next few quarters, but our fee-based businesses, efficient operations, balance sheet growth and
strong credit quality should mitigate the impact of the margin pressure.
“Credit quality was strong again this quarter. Total nonperforming assets declined from the balance
outstanding at year end, and net charge-offs were only slightly higher than the prior quarter at 50 basis points
of average loans outstanding. As we discussed in our recent Annual Report and Form 10K filing, our
exposure to the sub-prime residential real estate market, including related wholesale businesses, is minimal
and very manageable. We have worked very hard over the past number of years to reduce the overall risk
profile of the Company. Our objective going forward is to continue to grow our balance sheet, while
maintaining a prudent risk/reward profile.
“I would like to take this opportunity to recognize the many contributions our employees have made
during this past quarter. Specifically, we successfully converted the systems and operations of the acquired
corporate trust business of SunTrust. In addition, we completed the acquisition of United Financial Corp.,
the parent company of Heritage Bank. Further, I am very proud of our first quarter customer service loyalty
and satisfaction scores. We have been tracking customer satisfaction since the first quarter of 2002 and have
experienced steady improvement. The scores for the first quarter of 2007 were the highest we have seen to
(MORE)
3. U.S. Bancorp Reports First Quarter 2007 Results
April 17, 2007
Page 3
date. I want to thank all of our employees for their continued focus and dedication to serving our customers
so well.
“As a Company, we will continue to focus on organic growth and invest in businesses that enhance
our product and service offerings. I believe we are very well positioned to produce a consistent, predictable
and repeatable earnings stream going forward for the benefit of our customers, communities, employees and
shareholders.”
The Company’s results for the first quarter of 2007 declined modestly over the same period of 2006, as
growth in fee-based revenues was more than offset by increased credit costs reflecting the favorable impact a
year ago of changes in bankruptcy laws, lower net interest income due to the current yield curve and
operating costs of acquired businesses. On a linked quarter basis, net income declined $64 million, or $.03
per diluted common share, reflecting several notable items during the fourth quarter of 2006. These notable
items included a gain from the sale of the Company’s 401(k) recordkeeping business and tax benefits from
the resolution of federal and state tax examinations.
Total net revenue on a taxable-equivalent basis for the first quarter of 2007 was $3,362 million, $23
million (.7 percent) higher than the first quarter of 2006, primarily reflecting a 5.1 percent increase in
noninterest income, partially offset by a 3.4 percent decline in net interest income from a year ago.
Noninterest income growth was driven by organic business growth and expansion in payment processing and
trust businesses. Fee-based revenue growth was offset somewhat by the net impact in the first quarter of
2006 of $17 million from several previously reported items, including a $44 million trading gain related to
derivatives, a $10 million gain related to a favorable settlement in the merchant processing business and a
$37 million reduction in mortgage banking revenue due principally to the adoption of fair value accounting
standards for mortgage servicing rights. On a linked quarter basis, total net revenue declined $62 million,
primarily reflecting the gain of the sale of the 401(k) recordkeeping business and gains representing the
liquidation of securities previously acquired a part of a loan workout process. An improvement in mortgage
banking revenue was essentially offset by seasonally lower revenues compared with the prior quarter.
Total noninterest expense in the first quarter of 2007 was $1,545 million, $45 million (3.0 percent)
higher than the first quarter of 2006, principally due to investments in business initiatives, operating and
business integration costs associated with recent acquisitions and higher expenses related to incremental
investments in tax-advantaged projects from a year ago. On a linked quarter basis, total noninterest expense
was lower by $67 million (4.2 percent) reflecting a debt prepayment charge and costs related to the timing of
(MORE)
4. U.S. Bancorp Reports First Quarter 2007 Results
April 17, 2007
Page 4
business initiatives and certain tax advantaged investments in the fourth quarter of 2006, offset somewhat by
seasonally higher employee benefits costs.
Provision for credit losses for the first quarter of 2007 was $177 million, an increase of $62 million
from the first quarter of 2006 and $8 million higher than the fourth quarter of 2006. The lower provision for
credit losses in the first quarter of 2006 reflected the favorable impact on net charge-offs of changes in
bankruptcy laws in the fourth quarter of 2005. Net charge-offs in the first quarter of 2007 were $177
million, compared with fourth quarter of 2006 net charge-offs of $169 million and first quarter of 2006 net
charge-offs of $115 million. The Company’s credit quality continues to be strong. Total nonperforming
assets declined to $582 million at March 31, 2007, compared with $587 million at December 31, 2006, and
$619 million at March 31, 2006. The ratio of the allowance for credit losses to nonperforming loans was 498
percent at March 31, 2007, compared with 480 percent at December 31, 2006, and 432 percent at March 31,
2006.
INCO ME S TATEMENT HIGHLIGHTS Table 2
(T axable-equivalent basis, $ in millions, Percent Percent
excep t p er-share data) Change Change
1Q 4Q 1Q 1Q 07 vs 1Q 07 vs
2007 2006 2006 4Q 06 1Q 06
Net interest income $1,666 $1,695 $1,725 (1.7) (3.4)
Noninterest income 1,696 1,729 1,614 (1.9) 5.1
T otal net revenue 3,362 3,424 3,339 (1.8) .7
Noninterest exp ense 1,545 1,612 1,500 (4.2) 3.0
Income before p rovision and taxes 1,817 1,812 1,839 .3 (1.2)
Provision for credit losses 177 169 115 4.7 53.9
Income before taxes 1,640 1,643 1,724 (.2) (4.9)
T axable-equivalent adjustment 17 15 10 13.3 70.0
Ap p licable income taxes 493 434 561 13.6 (12.1)
Net income $1,130 $1,194 $1,153 (5.4) (2.0)
Net income ap p licable to common equity $1,115 $1,179 $1,153 (5.4) (3.3)
Diluted earnings p er common share $.63 $.66 $.63 (4.5) --
Net Interest Income
First quarter net interest income on a taxable-equivalent basis was $1,666 million, compared with
$1,725 million in the first quarter of 2006. Average earning assets for the period increased over the first
quarter of 2006 by $8.0 billion (4.4 percent), primarily driven by an increase of $6.9 billion (5.0 percent) in
(MORE)
5. U.S. Bancorp Reports First Quarter 2007 Results
April 17, 2007
Page 5
total average loans. The positive impact to net interest income from the growth in earning assets was more
than offset by a lower net interest margin. The net interest margin in the first quarter of 2007 was 3.51
percent, compared with 3.80 percent in the first quarter of 2006, reflecting the competitive environment and
the impact of changes in the yield curve from a year ago. Since the first quarter of 2006, credit spreads have
tightened by approximately 11 basis points across most lending products due to competitive loan pricing and
a change in mix reflecting growth in lower-spread credit products. Also, fewer interest recoveries from
loans are occurring given the stage of the business cycle. Funding costs have increased as rates on interest-
bearing deposits have risen and the mix continues to shift toward higher cost deposits and other funding
sources. An increase in the margin benefit of net free funds partially offset these factors.
Net interest income in the first quarter of 2007 decreased from the fourth quarter of 2006 by $29
million (1.7 percent). Net interest income generated by growth in average earning assets of $1.5 billion was
offset by the impact of fewer business days in the quarter, seasonally lower noninterest-bearing deposits in
trust and business demand accounts and higher funding costs. The net interest margin was 3.51 percent for
the first quarter of 2007, compared with 3.56 percent for the fourth quarter of 2006. Of this decrease,
approximately 3 basis points were related to specific management decisions, including incremental
investment in a bank-owned life insurance program and an accelerated share repurchase agreement executed
in February of 2007. Lower than expected interest recoveries reduced net interest margin by another basis
point for the first quarter of 2007. Given the current rate environment, the Company expects that net interest
margin could decline another five to ten basis points, in aggregate, during the next few quarters.
(MORE)
6. U.S. Bancorp Reports First Quarter 2007 Results
April 17, 2007
Page 6
NET INTERES T INCO ME Table 3
(T axable-equivalent basis; $ in millions)
Change Change
1Q 4Q 1Q 1Q 07 vs 1Q 07 vs
2007 2006 2006 4Q 06 1Q 06
Comp onents of net interest income
Income on earning assets $3,223 $3,236 $2,903 $(13) $320
Exp ense on interest-bearing liabilities 1,557 1,541 1,178 16 379
Net interest income $1,666 $1,695 $1,725 $(29) $(59)
Average y ields and rates p aid
Earning assets y ield 6.81% 6.79% 6.40% .02% .41%
Rate p aid on interest-bearing liabilities 3.88 3.84 3.10 .04 .78
Gross interest margin 2.93% 2.95% 3.30% (.02)% (.37)%
Net interest margin 3.51% 3.56% 3.80% (.05)% (.29)%
Average balances
Investment securities $40,879 $40,266 $39,680 $613 $1,199
Loans 144,693 143,686 137,779 1,007 6,914
Earning assets 191,135 189,660 183,101 1,475 8,034
Interest-bearing liabilities 162,682 159,469 153,911 3,213 8,771
Net free funds (a) 28,453 30,191 29,190 (1,738) (737)
(a) Represent s nonint erest -bearing deposit s, allowance for loan losses, unrealized gain (loss) on
available-for-sale securit ies, non-earning asset s, ot her nonint erest -bearing liabilit ies and equit y.
(MORE)
7. U.S. Bancorp Reports First Quarter 2007 Results
April 17, 2007
Page 7
AVERAGE LO ANS Table 4
($ in millions) Percent Percent
Change Change
1Q 4Q 1Q 1Q 07 vs 1Q 07 vs
2007 2006 2006 4Q 06 1Q 06
Commercial $41,470 $41,264 $38,847 .5 6.8
Lease financing 5,549 5,394 5,078 2.9 9.3
T otal commercial 47,019 46,658 43,925 .8 7.0
Commercial mortgages 19,672 19,897 20,269 (1.1) (2.9)
Construction and develop ment 8,960 9,029 8,347 (.8) 7.3
T otal commercial real estate 28,632 28,926 28,616 (1.0) .1
Residential mortgages 21,569 21,235 20,987 1.6 2.8
Credit card 8,635 8,242 7,120 4.8 21.3
Retail leasing 6,845 7,015 7,250 (2.4) (5.6)
Home equity and second mortgages 15,555 15,444 14,935 .7 4.2
Other retail 16,438 16,166 14,946 1.7 10.0
T otal retail 47,473 46,867 44,251 1.3 7.3
T otal loans $144,693 $143,686 $137,779 .7 5.0
Average loans for the first quarter of 2007 were $6.9 billion (5.0 percent) higher than the first quarter of
2006, driven by growth in average total retail loans of $3.2 billion (7.3 percent), total commercial loans of
$3.1 billion (7.0 percent), and residential mortgages of $582 million (2.8 percent). Average loans for the
first quarter of 2007 were higher than the fourth quarter of 2006 by $1.0 billion (.7 percent), primarily
reflecting growth in total retail loans due principally to an increase in average credit card balances. The
increase in the average credit card balances compared with the first quarter of 2006 and the fourth quarter of
2006 was the result of organic growth initiatives and portfolios acquired from financial partners. Residential
mortgages and total commercial loans also grew modestly in the first quarter of 2007 compared with the
fourth quarter of 2006. Total commercial real estate declined slightly from the fourth quarter of 2006,
reflecting customer refinancings in light of the liquidity available in the financial markets, a decision to
reduce condominium construction financing and a slowdown in residential homebuilding during 2006. At
the end of the first quarter of 2007, the residential and home equity and second mortgage portfolios included
approximately $3.1 billion and $900 million, respectively, of loans to customers that may be defined as sub-
prime borrowers. Together, these balances represent just 2.7 percent of the Company’s total loans
outstanding at March 31, 2007.
(MORE)
8. U.S. Bancorp Reports First Quarter 2007 Results
April 17, 2007
Page 8
Average investment securities in the first quarter of 2007 were $1.2 billion (3.0 percent) higher than the
first quarter of 2006, driven primarily by an increase in the municipal securities portfolio partially offset by a
reduction in mortgage-backed assets. These changes reflected asset/liability management decisions to
reduce the focus on residential mortgage-backed assets given the changing rate environment and mix of loan
growth.
AVERAGE DEPO S ITS Table 5
($ in millions) Pe rce nt Pe rce nt
Change Change
1Q 4Q 1Q 1Q 07 vs 1Q 07 vs
2007 2006 2006 4Q 06 1Q 06
Noninterest-bearing dep osits $27,677 $29,020 $28,837 (4.6) (4.0)
Interest-bearing dep osits
Interest checking 25,076 24,127 23,141 3.9 8.4
M oney market savings 25,712 26,214 27,378 (1.9) (6.1)
Savings accounts 5,401 5,392 5,689 .2 (5.1)
T otal of savings dep osits 56,189 55,733 56,208 .8 --
T ime certificates of dep osit less
than $100,000 14,775 13,974 13,505 5.7 9.4
T ime dep osits greater than $100,000 22,087 22,255 21,613 (.8) 2.2
T otal interest-bearing dep osits 93,051 91,962 91,326 1.2 1.9
T otal dep osits $120,728 $120,982 $120,163 (.2) .5
Average noninterest-bearing deposits for the first quarter of 2007 decreased $1.2 billion (4.0 percent)
compared with the first quarter of 2006, reflecting a decline in business demand deposits within most
business lines as these customers reduced excess liquidity to fund business growth. The decline in business
demand account balances was partially offset by higher corporate trust deposits driven by acquisitions and
business growth.
Average total savings deposits remained relatively flat year-over-year as an increase of $1.9 billion (8.4
percent) in interest checking balances due to higher broker dealer, government and institutional trust
balances was offset by a decline of $2.0 billion (5.9 percent) in average money market and savings balances
primarily due to a decline in balances within Consumer Banking. A portion of branch-based money market
savings accounts have migrated to fixed-rate time certificates, as customers take advantage of higher interest
rates for these products.
(MORE)
9. U.S. Bancorp Reports First Quarter 2007 Results
April 17, 2007
Page 9
Average time certificates of deposit less than $100,000 were higher in the first quarter of 2007 than in
the first quarter of 2006 by $1.3 billion (9.4 percent) and time deposits greater than $100,000 grew by $474
million (2.2 percent) over the same period. This year-over-year growth included increases in corporate trust
balances and consumer-based time deposits reflecting customer migration to higher rate deposit products.
Average noninterest-bearing deposits for the first quarter of 2007 decreased $1.3 billion (4.6 percent)
compared with the fourth quarter of 2006, primarily due to a seasonal decline in business demand deposits
and corporate trust deposits. Total savings deposits had a modest increase of $456 million (.8 percent) from
the fourth quarter of 2006, while time deposits increased $633 million (1.7 percent) from the prior quarter,
reflecting customer migration to these deposit products.
NO NINTERES T INCO ME Table 6
($ in millions) Pe rce nt Pe rce nt
Change Change
1Q 4Q 1Q 1Q 07 vs 1Q 07 vs
2007 2006 2006 4Q 06 1Q 06
Credit and debit card revenue $205 $210 $182 (2.4) 12.6
Corp orate p ay ment p roducts revenue 145 141 127 2.8 14.2
AT M p rocessing services 59 60 59 (1.7) --
M erchant p rocessing services 250 244 213 2.5 17.4
T rust and investment management fees 322 319 297 .9 8.4
Dep osit service charges 243 259 232 (6.2) 4.7
T reasury management fees 111 107 107 3.7 3.7
Commercial p roducts revenue 100 104 104 (3.8) (3.8)
M ortgage banking revenue 67 25 24 nm nm
Investment p roducts fees and commissions 34 36 38 (5.6) (10.5)
Securities gains (losses), net 1 11 -- (90.9) nm
Other 159 213 231 (25.4) (31.2)
T otal noninterest income $1,696 $1,729 $1,614 (1.9) 5.1
Noninterest Income
First quarter noninterest income was $1,696 million, an increase of $82 million (5.1 percent) from the
same quarter of 2006 and $33 million (1.9 percent) lower than the fourth quarter of 2006. The increase in
noninterest income over the first quarter of 2006 was driven by organic growth in the majority of fee income
categories and the benefit of acquired businesses. In addition, certain revenue categories were impacted by
accounting items in the first quarter of 2006.
(MORE)
10. U.S. Bancorp Reports First Quarter 2007 Results
April 17, 2007
Page 10
Credit and debit card revenue and corporate payment products revenue were higher in the first quarter
of 2007 than the first quarter of 2006 by $23 million and $18 million, or 12.6 percent and 14.2 percent,
respectively. The strong growth in credit and debit card revenue was primarily driven by higher customer
transaction volumes from a year ago. The corporate payment products revenue growth reflected organic
growth in sales volumes and card usage and acquired business expansion. Merchant processing services
revenue was higher in the first quarter of 2007 than the same quarter a year ago by $37 million (17.4
percent), reflecting an increase in sales volume driven by acquisitions and higher same store sales. Trust and
investment management fees increased by $25 million (8.4 percent) year-over-year due to favorable equity
market conditions and core account growth. Deposit service charges grew year-over-year by $11 million
(4.7 percent) primarily due to increased transaction-related fees and the impact of net new checking accounts
of 78,000 (5.3 percent annualized growth). Mortgage banking revenue increased $43 million in the first
quarter of 2007 compared with the same quarter of 2006. Included in the first quarter of 2006 were changes
in accounting for mortgage servicing rights and mortgage banking revenue of $37 million. The incremental
improvement in mortgage banking revenue was related to higher servicing income and mortgage production
gains. These favorable changes in fee-based revenue were partially offset by the decline in other income of
$72 million (31.2 percent) compared with the first quarter of 2006. The reduction in other income resulted
from a $44 million trading gain recognized in the first quarter of 2006 related to terminating certain interest
rate swaps previously designated as cash flow hedges that did not qualify as hedges in accordance with
SFAS 133, “Accounting for Derivatives” and a $10 million favorable settlement within the merchant
processing business recorded in 2006. In addition, revenues from equity investments and student loan sales
were lower in the first quarter of 2007 as compared with the same period of 2006.
Noninterest income was lower by $33 million (1.9 percent) in the first quarter of 2007 compared with
the fourth quarter of 2006 primarily due to seasonality and certain non-recurring gains in the previous
quarter. Credit and debit card revenue decreased $5 million (2.4 percent) and deposit service charges
declined $16 million (6.2 percent) primarily reflecting seasonally lower post-holiday customer transaction
volumes. Other income declined due to a $52 million gain on the sale of the Company’s 401(k)
recordkeeping business and $6 million in trading gains related to certain interest rate swaps, both of which
were recorded in the fourth quarter of 2006. In addition, there was a $10 million reduction in net securities
gains in the first quarter 2007 as compared with the fourth quarter of 2006, which included the sale of
securities from a business previously acquired through the loan workout process. Partially offsetting these
(MORE)
11. U.S. Bancorp Reports First Quarter 2007 Results
April 17, 2007
Page 11
unfavorable variances were increases in merchant processing and corporate payment products volumes
resulting in increases of $6 million (2.5 percent) and $4 million (2.8 percent), respectively. In addition,
mortgage banking revenue was higher than the fourth quarter of 2006 by $42 million, primarily due to an
adverse change in the fourth quarter of 2006 related to the valuation of MSR’s and the corresponding MSR
economic hedges. In addition, production gains and mortgage servicing revenue increased 4.9 percent as
compared with the fourth quarter of 2006.
NO NINTERES T EXPENS E Table 7
($ in millions) Pe rce nt Pe rce nt
Change Change
1Q 4Q 1Q 1Q 07 vs 1Q 07 vs
2007 2006 2006 4Q 06 1Q 06
Comp ensation $635 $621 $633 2.3 .3
Emp loy ee benefits 133 102 133 30.4 --
Net occup ancy and equip ment 165 166 165 (.6) --
Professional services 47 69 35 (31.9) 34.3
M arketing and business develop ment 48 61 40 (21.3) 20.0
T echnology and communications 125 133 117 (6.0) 6.8
Postage, p rinting and sup p lies 69 67 66 3.0 4.5
Other intangibles 94 92 85 2.2 10.6
Debt p rep ay ment -- 22 -- nm nm
Other 229 279 226 (17.9) 1.3
T otal noninterest exp ense $1,545 $1,612 $1,500 (4.2) 3.0
Noninterest Expense
First quarter noninterest expense totaled $1,545 million, an increase of $45 million (3.0 percent) from the
same quarter of 2006 and a decrease of $67 million (4.2 percent) from the fourth quarter of 2006.
Compensation expense remained relatively flat as compared with the same period of 2006 as increases in
salary costs related to business expansion were offset by lower stock-based compensation expense. In the
first quarter of 2006, the Company adopted new accounting standards for share-based compensation. Under
the new standard, the Company recorded incremental stock-based compensation expense to immediately
recognize the value of stock awards for employees that met retiree status, despite their continued active
employment service. Professional services expense increased by $12 million (34.3 percent) due primarily to
revenue enhancement-related business initiatives, including the cost involved with establishing a bank in
Ireland to support pan-European payment processing. Marketing and business development and technology
(MORE)
12. U.S. Bancorp Reports First Quarter 2007 Results
April 17, 2007
Page 12
and communications expenses both increased $8 million, 20.0 percent and 6.8 percent, respectively, year-
over year due to the timing of customer campaigns and increased volumes for business expansion initiatives
including prepaid card programs. Other intangibles expense increased by $9 million (10.6 percent) from
same period of 2006 due to recent acquisitions in Consumer Banking, Wealth Management and Payment
Services.
Noninterest expense in the first quarter of 2007 was lower than the fourth quarter of 2006 by $67
million (4.2 percent) primarily due to the timing of certain business initiatives and investments, offset
somewhat by seasonally higher employee benefits expenses. Professional services and marketing and
business development decreased $22 million (31.9 percent) and $13 million (21.3 percent), respectively, due
to the timing of business initiatives within the Consumer Banking and Payment Services business lines.
Technology and communications costs decreased by 6.0 percent, on a linked quarter basis, due to usage-
based expense credits that are typically determined in the first quarter of each year. The decrease in other
expense was driven, in part, by lower costs associated tax-advantaged investments given the timing of these
investments and a $22 million debt prepayment charge in the fourth quarter of 2006.
Provision for Income Taxes
The provision for income taxes for the first quarter of 2007 resulted in an effective tax rate of 30.4
percent compared with an effective tax rate of 32.7 percent in the first quarter of 2006. The effective tax rate
was 26.7 percent in fourth quarter of 2006. The reduction in the effective rate from the same quarter of the
prior year primarily reflected investments in tax-exempt municipal securities and bank-owned life insurance
as well as incremental tax credits from affordable housing projects and other tax-advantaged investments.
(MORE)
13. U.S. Bancorp Reports First Quarter 2007 Results
April 17, 2007
Page 13
ALLO WANCE FO R CREDIT LO S S ES Table 8
($ in millions) 1Q 4Q 3Q 2Q 1Q
2007 2006 2006 2006 2006
Balance, beginning of p eriod $2,256 $2,256 $2,251 $2,251 $2,251
Net charge-offs
Commercial 32 24 18 13 5
Lease financing 3 7 3 7 7
T otal commercial 35 31 21 20 12
Commercial mortgages 1 2 -- (1) 2
Construction and develop ment -- -- -- 1 --
T otal commercial real estate 1 2 -- -- 2
Residential mortgages 12 12 11 11 7
Credit card 74 68 56 50 46
Retail leasing 3 4 4 2 4
Home equity and second mortgages 16 13 12 13 12
Other retail 36 39 31 29 32
T otal retail 129 124 103 94 94
T otal net charge-offs 177 169 135 125 115
Provision for credit losses 177 169 135 125 115
Acquisitions and other changes 4 -- 5 -- --
Balance, end of p eriod $2,260 $2,256 $2,256 $2,251 $2,251
Comp onents
Allowance for loan losses $2,027 $2,022 $2,034 $2,039 $2,035
Liability for unfunded credit commitments 233 234 222 212 216
T otal allowance for credit losses $2,260 $2,256 $2,256 $2,251 $2,251
Gross charge-offs $237 $217 $195 $176 $175
Gross recoveries $60 $48 $60 $51 $60
Allowance for credit losses as a p ercentage of
Period-end loans 1.56 1.57 1.58 1.61 1.64
Nonp erforming loans 498 480 476 500 432
Nonp erforming assets 388 384 392 409 364
Credit Quality
The allowance for credit losses was $2,260 million at March 31, 2007, compared with $2,256 million at
December 31, 2006, and $2,251 million at March 31, 2006. The ratio of the allowance for credit losses to
period-end loans was 1.56 percent at March 31, 2007, compared with 1.57 percent at December 31, 2006,
and 1.64 percent at March 31, 2006. The ratio of the allowance for credit losses to nonperforming loans was
498 percent at March 31, 2007, compared with 480 percent at December 31, 2006, and 432 percent at March
31, 2006. Total net charge-offs in the first quarter of 2007 were $177 million, compared with the fourth
quarter of 2006 net charge-offs of $169 million and the first quarter of 2006 net charge-offs of $115 million.
(MORE)
14. U.S. Bancorp Reports First Quarter 2007 Results
April 17, 2007
Page 14
The year-over-year increase in total net charge-offs was due, in part, to the implementation of minimum
balance payment programs, as well as an expected increase in consumer bankruptcies. Bankruptcy levels
declined substantially in 2006 as a result of changes in bankruptcy legislation that went into effect in late
2005.
Commercial and commercial real estate loan net charge-offs increased to $36 million in the first quarter
of 2007 (.19 percent of average loans outstanding) compared with $33 million (.17 percent of average loans
outstanding) in the fourth quarter of 2006 and $14 million (.08 percent of average loans outstanding) in the
first quarter of 2006. The Company expects commercial net charge-offs to continue to increase somewhat
over the next several quarters, due to slightly higher gross charge-offs and lower commercial loan recoveries.
Retail loan net charge-offs were $129 million in the first quarter of 2007 compared with $124 million
in the fourth quarter of 2006 and $94 million in the first quarter of 2006. Retail loan net charge-offs
increased as compared with the fourth quarter of 2006 and from the first quarter of 2006, reflecting the
impact of the bankruptcy legislation changes that occurred in the fourth quarter of 2005 and implementing
the minimum balance payment requirements. Retail loan net charge-offs as a percent of average loans
outstanding were 1.10 percent in the first quarter of 2007, compared with 1.05 percent and .86 percent in the
fourth quarter of 2006 and first quarter of 2006, respectively. The Company anticipates modestly higher
delinquencies and net charge-offs in the retail portfolios during 2007.
(MORE)
15. U.S. Bancorp Reports First Quarter 2007 Results
April 17, 2007
Page 15
CREDIT RATIO S Table 9
(Percent) 1Q 4Q 3Q 2Q 1Q
2007 2006 2006 2006 2006
Net charge-offs ratios (a)
Commercial .31 .23 .18 .13 .05
Lease financing .22 .51 .23 .54 .56
T otal commercial .30 .26 .18 .18 .11
Commercial mortgages .02 .04 -- (.02) .04
Construction and develop ment -- -- -- .05 --
T otal commercial real estate .01 .03 -- -- .03
Residential mortgages .23 .22 .21 .21 .14
Credit card 3.48 3.27 2.85 2.72 2.62
Retail leasing .18 .23 .22 .11 .22
Home equity and second mortgages .42 .33 .31 .35 .33
Other retail .89 .96 .79 .77 .87
T otal retail 1.10 1.05 .90 .84 .86
T otal net charge-offs .50 .47 .38 .36 .34
Delinquent loan ratios - 90 day s or more p ast due e xcluding nonp erforming loans (b)
Commercial .07 .05 .06 .05 .05
Commercial real estate .04 .01 .01 -- --
Residential mortgages .46 .45 .36 .30 .31
Retail .54 .48 .41 .39 .38
T otal loans .27 .24 .21 .19 .18
Delinquent loan ratios - 90 day s or more p ast due including nonp erforming loans (b)
Commercial .46 .57 .55 .58 .64
Commercial real estate .69 .53 .54 .40 .51
Residential mortgages .63 .62 .53 .49 .53
Retail .63 .58 .52 .52 .54
T otal loans .59 .57 .54 .51 .56
(a) annualized and calculat ed on average loan balances
(b) rat ios are expressed as a percent of ending loan balances
(MORE)
16. U.S. Bancorp Reports First Quarter 2007 Results
April 17, 2007
Page 16
AS S ET Q UALITY Table 10
($ in millions)
Mar 31 De c 31 S e p 30 Jun 30 Mar 31
2007 2006 2006 2006 2006
Nonp erforming loans
Commercial $147 $196 $192 $203 $219
Lease financing 41 40 39 38 41
T otal commercial 188 236 231 241 260
Commercial mortgages 114 112 114 88 123
Construction and develop ment 71 38 40 25 23
T otal commercial real estate 185 150 154 113 146
Residential mortgages 38 36 36 39 45
Retail 43 48 53 57 70
T otal nonp erforming loans 454 470 474 450 521
Other real estate 113 95 79 77 71
Other nonp erforming assets 15 22 22 23 27
T otal nonp erforming assets (a) $582 $587 $575 $550 $619
Accruing loans 90 day s or more p ast due $397 $349 $295 $264 $251
Restructured loans that continue
to accrue interest $411 $405 $369 $370 $371
Nonp erforming assets to loans
p lus ORE (%) .40 .41 .40 .39 .45
(a) does not include accruing loans 90 days or m ore past due or rest ruct ured loans t hat cont inue t o accrue int erest
Nonperforming assets at March 31, 2007, totaled $582 million, compared with $587 million at
December 31, 2006, and $619 million at March 31, 2006. The ratio of nonperforming assets to loans and
other real estate was .40 percent at March 31, 2007, compared with .41 percent at December 31, 2006, and
.45 percent at March 31, 2006. Restructured loans that continue to accrue interest have increased from the
first quarter of 2006, reflecting the impact of implementing higher minimum balance payment requirements
for credit card customers in response to industry guidance issued by the banking regulatory agencies.
(MORE)
17. U.S. Bancorp Reports First Quarter 2007 Results
April 17, 2007
Page 17
CAPITAL PO S ITIO N Table 11
($ in millions) Mar 31 De c 31 S e p 30 Jun 30 Mar 31
2007 2006 2006 2006 2006
T otal shareholders' equity $20,800 $21,197 $20,926 $20,415 $20,256
T ier 1 cap ital 16,917 17,036 17,042 16,841 16,478
T otal risk-based cap ital 25,826 24,495 25,011 24,893 24,328
T ier 1 cap ital ratio 8.6 % 8.8 % 8.8 % 8.9 % 8.9 %
T otal risk-based cap ital ratio 13.1 12.6 13.0 13.1 13.1
Leverage ratio 8.0 8.2 8.3 8.2 8.2
Common equity to assets 8.9 9.2 9.2 9.1 9.2
T angible common equity to assets 5.3 5.5 5.4 5.6 5.4
Total shareholders’ equity was $20.8 billion at March 31, 2007, compared with $21.2 billion at
December 31, 2006, and $20.3 billion at March 31, 2006. The increase year-over-year was the result of
corporate earnings, partially offset by share buybacks, including the accelerated share repurchase agreement,
and dividends.
The Tier 1 capital ratio was 8.6 percent at March 31, 2007, compared with 8.8 percent at December
31, 2006, and 8.9 percent at March 31, 2006. The total risk-based capital ratio was 13.1 percent at March
31, 2007, compared with 12.6 percent at December 31, 2006, and 13.1 percent at March 31, 2006. The
leverage ratio was 8.0 percent at March 31, 2007, compared with 8.2 percent at December 31, 2006, and at
March 31, 2006. Tangible common equity to assets was 5.3 percent at March 31, 2007, compared with 5.5
percent at December 31, 2006, and 5.4 percent at March 31, 2006. All regulatory ratios continue to be in
excess of stated “well capitalized” requirements.
(MORE)
18. U.S. Bancorp Reports First Quarter 2007 Results
April 17, 2007
Page 18
CO MMO N S HARES Table 12
(M illions) 1Q 4Q 3Q 2Q 1Q
2007 2006 2006 2006 2006
Beginning shares outstanding 1,765 1,763 1,783 1,783 1,815
Shares issued for stock op tion and stock p urchase
p lans, acquisitions and other corp orate p urp oses 11 12 10 9 9
Shares rep urchased (34) (10) (30) (9) (41)
Ending shares outstanding 1,742 1,765 1,763 1,783 1,783
On August 3, 2006, the Company announced that the Board of Directors approved an authorization to
repurchase 150 million shares of common stock through December 31, 2008. During the first quarter of
2007, the Company repurchased 34 million shares of common stock which included approximately 25
million shares repurchased in connection with an accelerated stock repurchase agreement initiated in
February. As of March 31, 2007, there were approximately 88 million shares remaining to be repurchased
under the current authorization.
(MORE)
19. U.S. Bancorp Reports First Quarter 2007 Results
April 17, 2007
Page 19
LINE O F BUS INES S FINANCIAL PERFO RMANCE (a) Table 13
($ in millions)
Net Income Percent Change 1Q 2007
1Q 4Q 1Q 1Q 07 vs 1Q 07 vs Earnings
Business Line 2007 2006 2006 4Q 06 1Q 06 Composition
Wholesale Banking $275 $284 $307 (3.2) (10.4) 24 %
Consumer Banking 429 417 411 2.9 4.4 38
Wealth M anagement 153 156 137 (1.9) 11.7 14
Pay ment Services 229 237 225 (3.4) 1.8 20
T reasury and Corp orate Sup p ort 44 100 73 (56.0) (39.7) 4
Consolidated Comp any $1,130 $1,194 $1,153 (5.4) (2.0) 100 %
(a) prelim inary dat a
Lines of Business
Within the Company, financial performance is measured by major lines of business, which include
Wholesale Banking, Consumer Banking, Wealth Management, Payment Services, and Treasury and
Corporate Support. These operating segments are components of the Company about which financial
information is available and is evaluated regularly in deciding how to allocate resources and assess
performance. Noninterest expenses incurred by centrally managed operations or business lines that directly
support another business line’s operations are charged to the applicable business line based on its utilization
of those services primarily measured by the volume of customer activities, number of employees or other
relevant factors. These allocated expenses are reported as net shared services expense within noninterest
expense. Designations, assignments and allocations change from time to time as management systems are
enhanced, methods of evaluating performance or product lines change or business segments are realigned to
better respond to the Company’s diverse customer base. During 2007, certain organization and methodology
changes were made and, accordingly, prior period results have been restated and presented on a comparable
basis.
Wholesale Banking offers lending, equipment finance and small-ticket leasing, depository, treasury
management, capital markets, foreign exchange, international trade services and other financial services to
middle market, large corporate, commercial real estate, and public sector clients. Wholesale Banking
contributed $275 million of the Company’s net income in the first quarter of 2007, a 10.4 percent decrease
from the same period of 2006 and a 3.2 percent decrease as compared with the fourth quarter of 2006. The
(MORE)
20. U.S. Bancorp Reports First Quarter 2007 Results
April 17, 2007
Page 20
decrease in Wholesale Banking’s first quarter of 2007 contribution from the same quarter of 2006 was
primarily the result of an unfavorable variance in total net revenue (3.8 percent) and an increase in the
provision for credit losses from a year ago. The decrease in net interest income was due to tighter credit
spreads and a decline in average noninterest-bearing deposit balances as customers utilized their liquidity to
fund business growth, partially offset by growth in average loan balances and the margin benefit of deposits.
Total noninterest income remained relatively flat, as an increase in treasury management fees was offset by a
decline in equity investment revenue. Total noninterest expense also remained relatively flat as an increase
in compensation and benefits expense was offset by a decline in net shared services. The unfavorable
variance in the provision for credit losses was due to a $22 million increase in net charge-offs in the first
quarter of 2007 compared with a year ago. The change in net charge-offs reflected fewer wholesale loan
recoveries and an increase in gross charge-offs at this stage of the business cycle.
Wholesale Banking’s contribution to net income in the first quarter of 2007 compared with the fourth
quarter of 2006 was $9 million (3.2 percent) lower due to unfavorable variances in total net revenue (1.9
percent) and the provision for credit losses. Total net revenue was lower on a linked quarter basis due to
lower net interest income driven primarily by fewer business days in the quarter and seasonally lower
deposit balances offset somewhat by stronger fee-based income. Total noninterest income grew modestly
with increases in treasury management fees and equity investment revenue offset by a reduction in net
securities gains. Included in the fourth quarter of 2006 were securities gains associated with the sale of
shares previously received as part of a loan workout process. Total noninterest expense declined from the
fourth quarter of 2006 as an increase in compensation and employee benefits expense was more than offset
by a decline in net shared services expense. The provision for credit losses increased on a linked quarter
basis due to an increase in net charge-offs.
Consumer Banking delivers products and services through banking offices, telephone servicing and
sales, on-line services, direct mail and ATMs. It encompasses community banking, metropolitan banking,
in-store banking, small business banking, consumer lending, mortgage banking, consumer finance,
workplace banking, student banking, and 24-hour banking. Consumer Banking contributed $429 million of
the Company’s net income in the first quarter of 2007, a 4.4 percent increase from the same period of 2006
and a 2.9 percent increase from the prior quarter. Within Consumer Banking, the retail banking division
contributed $401 million of the total contribution, a 1.7 percent decrease for the division on a year-over-year
basis. Net interest income was higher than a year ago primarily due to growth in average loan balances,
(MORE)
21. U.S. Bancorp Reports First Quarter 2007 Results
April 17, 2007
Page 21
stronger loan fees and the margin benefit of deposits, somewhat offset by lower credit spreads given the
competitive lending environment. Total noninterest income for the retail banking division was relatively
unchanged from a year ago as growth in deposit service charges of 4.8 percent, driven by higher transaction
levels, was offset by the extent and timing of student loan sales. Total noninterest expense in the first
quarter of 2007 increased 3.4 percent compared with the same quarter of 2006 primarily due to an increase in
compensation and employee benefits expense related to recent acquisitions, professional services and
marketing and business development expense for various business initiatives and the timing of customer
marketing programs, partially offset by a reduction in net shared services expense. The business line
experienced a $6 million year-over-year increase in net charge-offs (9.5 percent) reflecting higher levels of
bankruptcy-related losses. Bankruptcies were generally lower in 2006 due to the lingering effects of changes
in bankruptcy laws in late 2005. In the first quarter of 2007, the mortgage banking division’s contribution
was $28 million. This division’s total net revenue increased $40 million (85.1 percent) from a year ago.
Included in the first quarter of 2006 was a $37 million reduction in mortgage banking revenue, principally
related to the adoption of fair value accounting for mortgage servicing rights. Total noninterest expense for
the mortgage banking division was essentially unchanged from the first quarter of 2006.
The increase in Consumer Banking’s contribution in the first quarter of 2007 from the fourth quarter of
2006 was principally due to higher fee-based revenues in the mortgage banking division. The retail banking
division’s contribution declined by 3.6 percent on a linked quarter basis due to lower net interest income
driven by fewer days in the first quarter of 2007 and seasonally lower deposit service charges (6.2 percent).
Total noninterest expense for the retail banking division on a linked quarter basis was essentially unchanged.
Seasonally higher compensation costs and the impact of costs associated with recent acquisitions were
substantially offset by lower net shared services expense from processing volumes and administrative costs.
The provision for credit losses during the quarter reflected a $3 million decrease in net charge-offs relative to
the fourth quarter of 2006. The contribution of the mortgage banking division increased $27 million from
the fourth quarter of 2006 driven by an increase in total noninterest income. This increase in revenue
reflected valuation changes of mortgage servicing rights and the corresponding derivatives economically
hedging the servicing rights due to market rates at year end. Mortgage production gains and servicing
income increased 4.9 percent as compared with the prior quarter. Total noninterest expense of the mortgage
banking division was essentially unchanged from the fourth quarter of 2006.
(MORE)
22. U.S. Bancorp Reports First Quarter 2007 Results
April 17, 2007
Page 22
Wealth Management provides trust, private banking, financial advisory, investment management, retail
brokerage services, insurance, custody and mutual fund servicing through six businesses: Private Client
Group, Corporate Trust, U.S. Bancorp Investments and Insurance, FAF Advisors, Institutional Trust and
Custody and Fund Services. Wealth Management contributed $153 million of the Company’s net income in
the first quarter of 2007, an 11.7 percent increase over the same period of 2006 and a 1.9 percent decrease
from the fourth quarter of 2006. The growth in the business line’s contribution in the first quarter of 2007
over the same quarter of 2006 was the result of core account fee growth and improved equity market
conditions relative to a year ago. Net interest income was unfavorably impacted year-over-year by deposit
pricing and tightening credit spreads partially offset by earnings from deposit growth. Total noninterest
income increased by 6.3 percent from the same quarter of 2006, primarily due to core account fee growth
and favorable equity market conditions. A decrease in total noninterest expense was primarily due to the
completion of certain acquisition integration activities and a reduction in net shared services expense.
The decrease in the business line’s contribution in the first quarter of 2007 as compared with the fourth
quarter of 2006, was due to a reduction in net interest income driven by a decline in average loan balances
and changes in the mix of deposits during the quarter.
Payment Services includes consumer and business credit cards, stored-value cards, debit cards,
corporate and purchasing card services, consumer lines of credit, ATM processing and merchant processing.
Payment Services contributed $229 million of the Company’s net income in the first quarter of 2007, a 1.8
percent increase over the same period of 2006 and a 3.4 percent decrease from the fourth quarter of 2006.
The increase in Payment Services’ contribution in the first quarter of 2007 from the same period of 2006 was
the result of higher total net revenue (9.7 percent), partially offset by an unfavorable variance in the
provision for credit losses (55.0 percent) and total noninterest expense (9.7 percent). The increase in total
net revenue year-over-year was due to growth in total noninterest income (11.4 percent) and net interest
income (3.7 percent), reflecting growth in higher yielding retail loan balances, partially offset by declining
spreads on retail credit cards. All revenue categories benefited from higher transaction volumes, rate
changes and business expansion initiatives. The increase in noninterest income was partially offset by the
merchant processing settlement recorded in the first quarter of 2006. The growth in total noninterest expense
year-over-year primarily reflected new business initiatives, including costs associated with acquisitions. The
increase in the provision for credit losses was driven by an increase of $33 million in net charge-offs, year-
over-year, reflecting the impact of implementing minimum balance payment requirements and a higher level
(MORE)
23. U.S. Bancorp Reports First Quarter 2007 Results
April 17, 2007
Page 23
of bankruptcy-related losses as the lingering favorable effects of changes in bankruptcy laws were realized
throughout 2006.
The decrease in Payment Services’ contribution in the first quarter of 2007 from the fourth quarter of
2006 was due to seasonally lower total net revenue (1.4 percent) and higher credit losses (9.4 percent),
partially offset by a decrease in total noninterest expense (1.8 percent). Total net revenue was lower as net
interest income declined due to fewer business days during the first quarter and a lower yield on retail credit
cards, while total noninterest income declined due to seasonally lower credit and debit card revenue. The
decrease in total noninterest expense was primarily due to the timing of marketing and professional service
costs from retail payment system and other business expansion initiatives.
Treasury and Corporate Support includes the Company’s investment portfolios, funding, capital
management and asset securitization activities, interest rate risk management, the net effect of transfer
pricing related to average balances and the residual aggregate of those expenses associated with corporate
activities that are managed on a consolidated basis. Treasury and Corporate Support recorded net income of
$44 million in the first quarter of 2007, compared with net income of $73 million in the first quarter of 2006
and $100 million in the fourth quarter of 2006. Net interest income decreased in the current quarter from the
first quarter of 2006 by $49 million, reflecting the adverse impact of a flatter yield curve and the issuance of
higher cost wholesale funding to support earning asset growth. Total noninterest income decreased due to
trading gains realized in the first quarter of 2006 related to terminating certain interest rate derivatives. Total
noninterest expense remained relatively flat year-over-year, as the decrease in compensation and benefits
expense due to the immediate recognition in the first quarter of 2006 of the value of stock awards for
employees that met retiree status was offset by an unfavorable change in net shared services allocated to the
lines of business. The favorable change in income taxes, compared with a year ago, resulted from
incremental investment in tax-exempt municipal securities, tax-advantaged investments and expansion of a
bank-owned life insurance program.
Net income in the first quarter of 2007 was lower than the fourth quarter of 2006 due to a decrease in
total net revenue and an unfavorable variance in income taxes, partially offset by a decrease in total
noninterest expense. Net interest income decreased primarily due to the higher cost of wholesale funding
and specific management decisions, including expanding the bank-owned life insurance program and an
accelerated share repurchase program initiated in February of 2007. Total noninterest income decreased $60
million due to the $52 million gain on the sale of the Company’s 401(k) recordkeeping business and $6
(MORE)
24. U.S. Bancorp Reports First Quarter 2007 Results
April 17, 2007
Page 24
million related to terminating a derivative in the fourth quarter of 2006. Total noninterest expenses
decreased by $52 million primarily due to a $22 million debt prepayment charge in the fourth quarter of
2006 and lower costs related to tax-advantaged investments given the timing of these investments in late
2006. The residual tax benefits recognized by the Treasury and Corporate Support business line decreased
during the first quarter of 2007 primarily due to lower levels of tax credits related to tax-advantaged
investments.
Additional schedules containing more detailed information about the Company’s business line results are
available on the web at usbank.com or by calling Investor Relations at 612-303-0781.
PRESIDENT AND CHIEF EXECUTIVE OFFICER, RICHARD K. DAVIS, AND VICE CHAIRMAN
AND CHIEF FINANCIAL OFFICER, ANDREW CECERE, WILL HOST A CONFERENCE CALL
TO REVIEW THE FINANCIAL RESULTS AT 1:00 P.M. (CDT) ON TUESDAY, APRIL 17, 2007.
The conference call will be available by telephone or on the internet. To access the conference call,
please dial 800-909-7113 and ask for the U.S. Bancorp earnings conference call. Participants calling
from outside the United States, please dial 785-830-1914. For those unable to participate during the
live call, a recording of the call will be available approximately one hour after the conference call ends
on Tuesday, April 17th, and will run through Tuesday, April 24th, at 11:00 p.m. (CDT). To access the
recorded message dial 800-839-1229. If calling from outside the United States, please dial 402-220-
0459 to access the recording. Find the recorded call via the internet at usbank.com.
Minneapolis-based U.S. Bancorp (“USB”), with $221 billion in assets, is the 6th largest financial holding
company in the United States. The Company operates 2,498 banking offices and 4,837 ATMs in 24 states,
and provides a comprehensive line of banking, brokerage, insurance, investment, mortgage, trust and
payment services products to consumers, businesses and institutions. U.S. Bancorp is the parent company of
U.S. Bank. Visit U.S. Bancorp on the web at usbank.com.
(MORE)
25. U.S. Bancorp Reports First Quarter 2007 Results
April 17, 2007
Page 25
Forward-Looking Statements
The following information appears in accordance with the Private Securities Litigation Reform Act of 1995:
This press release contains forward-looking statements about U.S. Bancorp. Statements that are not
historical or current facts, including statements about beliefs and expectations, are forward-looking
statements. These statements often include the words “may,” “could,” “would,” “should,” “believes,”
“expects,” “anticipates,” “estimates,” “intends,” “plans,” “targets,” “potentially,” “probably,” “projects,”
“outlook” or similar expressions. These forward-looking statements cover, among other things, anticipated
future revenue and expenses and the future plans and prospects of the Company. Forward-looking
statements involve inherent risks and uncertainties, and important factors could cause actual results to differ
materially from those anticipated, including changes in general business and economic conditions, changes
in interest rates, legal and regulatory developments, increased competition from both banks and non-banks,
changes in customer behavior and preferences, effects of mergers and acquisitions and related integration,
and effects of critical accounting policies and judgments. For discussion of these and other risks that may
cause actual results to differ from expectations, refer to our Annual Report on Form 10-K for the year ended
December 31, 2006, on file with the Securities and Exchange Commission, including the sections entitled
“Risk Factors” and “Corporate Risk Profile.” Forward-looking statements speak only as of the date they are
made, and the Company undertakes no obligation to update them in light of new information or future
events.
###
(MORE)
26. U.S. Bancorp
Consolidated Statement of Income
Three Months Ended
(Dollars and Shares in Millions, Except Per Share Data) March 31,
(Unaudited) 2007 2006
Interest Income
Loans $2,578 $2,307
Loans held for sale 59 51
Investment securities 516 490
Other interest income 34 43
Total interest income 3,187 2,891
Interest Expense
Deposits 675 503
Short-term borrowings 328 270
Long-term debt 535 403
Total interest expense 1,538 1,176
Net interest income 1,649 1,715
Provision for credit losses 177 115
Net interest income after provision for credit losses 1,472 1,600
Noninterest Income
Credit and debit card revenue 205 182
Corporate payment products revenue 145 127
ATM processing services 59 59
Merchant processing services 250 213
Trust and investment management fees 322 297
Deposit service charges 243 232
Treasury management fees 111 107
Commercial products revenue 100 104
Mortgage banking revenue 67 24
Investment products fees and commissions 34 38
Securities gains (losses), net 1 --
Other 159 231
Total noninterest income 1,696 1,614
Noninterest Expense
Compensation 635 633
Employee benefits 133 133
Net occupancy and equipment 165 165
Professional services 47 35
Marketing and business development 48 40
Technology and communications 125 117
Postage, printing and supplies 69 66
Other intangibles 94 85
Other 229 226
Total noninterest expense 1,545 1,500
Income before income taxes 1,623 1,714
Applicable income taxes 493 561
Net income $1,130 $1,153
Net income applicable to common equity $1,115 $1,153
Earnings per common share $.64 $.64
Diluted earnings per common share $.63 $.63
Dividends declared per common share $.40 $.33
Average common shares outstanding 1,752 1,801
Average diluted common shares outstanding 1,780 1,826
Page 26
27. U.S. Bancorp
Consolidated Ending Balance Sheet
March 31, December 31, March 31,
(Dollars in Millions) 2007 2006 2006
Assets (Unaudited) (Unaudited)
Cash and due from banks $6,287 $8,639 $7,050
Investment securities
Held-to-maturity 83 87 110
Available-for-sale 40,508 40,030 39,286
Loans held for sale 4,075 3,256 3,638
Loans
Commercial 47,315 46,190 43,844
Commercial real estate 28,530 28,645 28,782
Residential mortgages 21,765 21,285 20,656
Retail 47,235 47,477 43,915
Total loans 144,845 143,597 137,197
Less allowance for loan losses (2,027) (2,022) (2,035)
Net loans 142,818 141,575 135,162
Premises and equipment 1,818 1,835 1,817
Goodwill 7,585 7,538 7,267
Other intangible assets 3,215 3,227 3,128
Other assets 15,059 13,045 12,449
Total assets $221,448 $219,232 $209,907
Liabilities and Shareholders' Equity
Deposits
Noninterest-bearing $28,666 $32,128 $29,384
Interest-bearing 70,557 70,330 69,995
Time deposits greater than $100,000 18,837 22,424 22,365
Total deposits 118,060 124,882 121,744
Short-term borrowings 28,516 26,933 20,651
Long-term debt 44,698 37,602 39,327
Other liabilities 9,374 8,618 7,929
Total liabilities 200,648 198,035 189,651
Shareholders' equity
Preferred stock 1,000 1,000 1,000
Common stock 20 20 20
Capital surplus 5,745 5,762 5,819
Retained earnings 21,660 21,242 19,568
Less treasury stock (6,972) (6,091) (5,394)
Other comprehensive income (653) (736) (757)
Total shareholders' equity 20,800 21,197 20,256
Total liabilities and shareholders' equity $221,448 $219,232 $209,907
Page 27
29. U.S. Bancorp
Income Statement Highlights
Percent Change
Three Months Ended v. March 31, 2007
(Dollars and Shares in Millions, Except Per Share Data) March 31, December 31, March 31, December 31, March 31,
(Unaudited) 2007 2006 2006 2006 2006
Net interest income (taxable-equivalent basis) $1,666 $1,695 $1,725 (1.7) % (3.4) %
Noninterest income 1,696 1,729 1,614 (1.9) 5.1
Total net revenue 3,362 3,424 3,339 (1.8) .7
Noninterest expense 1,545 1,612 1,500 (4.2) 3.0
Income before provision and income taxes 1,817 1,812 1,839 .3 (1.2)
Provision for credit losses 177 169 115 4.7 53.9
Income before income taxes 1,640 1,643 1,724 (.2) (4.9)
Taxable-equivalent adjustment 17 15 10 13.3 70.0
Applicable income taxes 493 434 561 13.6 (12.1)
Net income $1,130 $1,194 $1,153 (5.4) (2.0)
Net income applicable to common equity $1,115 $1,179 $1,153 (5.4) (3.3)
Diluted earnings per common share $.63 $.66 $.63 (4.5) --
Revenue per diluted common share (a) $1.89 $1.91 $1.83 (1.0) 3.3
Financial Ratios
Net interest margin (b) 3.51 % 3.56 % 3.80 %
Interest yield on average loans (b) 7.23 7.19 6.79
Rate paid on interest-bearing liabilities (b) 3.88 3.84 3.10
Return on average assets 2.09 2.18 2.23
Return on average common equity 22.4 23.2 23.3
Efficiency ratio (c) 46.0 47.2 44.9
Tangible efficiency ratio (d) 43.2 44.5 42.4
(a) Computed as the sum of net interest income on a taxable-equivalent basis and noninterest income excluding securities gains
(losses), net divided by average diluted common shares outstanding
(b) On a taxable-equivalent basis
(c) Computed as noninterest expense divided by the sum of net interest income on a taxable-equivalent basis and noninterest income
excluding securities gains (losses), net
(d) Computed as noninterest expense divided by the sum of net interest income on a taxable-equivalent basis and noninterest income
excluding securities gains (losses), net and intangible amortization
Page 29
30. U.S. Bancorp
Quarterly Consolidated Statement of Income
Three Months Ended
(Dollars and Shares in Millions, Except Per Share Data) March 31, December 31, September 30, June 30, March 31,
(Unaudited) 2007 2006 2006 2006 2006
Interest Income
Loans $2,578 $2,596 $2,545 $2,425 $2,307
Loans held for sale 59 64 64 57 51
Investment securities 516 511 500 500 490
Other interest income 34 34 40 36 43
Total interest income 3,187 3,205 3,149 3,018 2,891
Interest Expense
Deposits 675 668 640 578 503
Short-term borrowings 328 342 321 270 270
Long-term debt 535 515 528 484 403
Total interest expense 1,538 1,525 1,489 1,332 1,176
Net interest income 1,649 1,680 1,660 1,686 1,715
Provision for credit losses 177 169 135 125 115
Net interest income after provision for credit losses 1,472 1,511 1,525 1,561 1,600
Noninterest Income
Credit and debit card revenue 205 210 206 202 182
Corporate payment products revenue 145 141 150 139 127
ATM processing services 59 60 63 61 59
Merchant processing services 250 244 253 253 213
Trust and investment management fees 322 319 305 314 297
Deposit service charges 243 259 268 264 232
Treasury management fees 111 107 111 116 107
Commercial products revenue 100 104 100 107 104
Mortgage banking revenue 67 25 68 75 24
Investment products fees and commissions 34 36 34 42 38
Securities gains (losses), net 1 11 -- 3 --
Other 159 213 190 179 231
Total noninterest income 1,696 1,729 1,748 1,755 1,614
Noninterest Expense
Compensation 635 621 632 627 633
Employee benefits 133 102 123 123 133
Net occupancy and equipment 165 166 168 161 165
Professional services 47 69 54 41 35
Marketing and business development 48 61 58 58 40
Technology and communications 125 133 128 127 117
Postage, printing and supplies 69 67 66 66 66
Other intangibles 94 92 89 89 85
Debt prepayment -- 22 -- 11 --
Other 229 279 220 227 226
Total noninterest expense 1,545 1,612 1,538 1,530 1,500
Income before income taxes 1,623 1,628 1,735 1,786 1,714
Applicable income taxes 493 434 532 585 561
Net income $1,130 $1,194 $1,203 $1,201 $1,153
Net income applicable to common equity $1,115 $1,179 $1,187 $1,184 $1,153
Earnings per common share $.64 $.67 $.67 $.66 $.64
Diluted earnings per common share $.63 $.66 $.66 $.66 $.63
Dividends declared per common share $.40 $.40 $.33 $.33 $.33
Average common shares outstanding 1,752 1,761 1,771 1,781 1,801
Average diluted common shares outstanding 1,780 1,789 1,796 1,805 1,826
Financial Ratios
Net interest margin (a) 3.51 % 3.56 % 3.56 % 3.68 % 3.80 %
Interest yield on average loans (a) 7.23 7.19 7.16 7.00 6.79
Rate paid on interest-bearing liabilities (a) 3.88 3.84 3.79 3.45 3.10
Return on average assets 2.09 2.18 2.23 2.27 2.23
Return on average common equity 22.4 23.2 23.6 24.3 23.3
Efficiency ratio (b) 46.0 47.2 45.0 44.4 44.9
Tangible efficiency ratio (c) 43.2 44.5 42.4 41.8 42.4
(a) On a taxable-equivalent basis
(b) Computed as noninterest expense divided by the sum of net interest income on a taxable-equivalent basis and noninterest income
excluding securities gains (losses), net
(c) Computed as noninterest expense divided by the sum of net interest income on a taxable-equivalent basis and noninterest income
excluding securities gains (losses), net and intangible amortization
Page 30
31. U.S. Bancorp
Consolidated Ending Balance Sheet
March 31, December 31, September 30, June 30, March 31,
(Dollars in Millions) 2007 2006 2006 2006 2006
Assets (Unaudited) (Unaudited) (Unaudited) (Unaudited)
Cash and due from banks $6,287 $8,639 $6,355 $7,234 $7,050
Investment securities
Held-to-maturity 83 87 91 98 110
Available-for-sale 40,508 40,030 39,429 38,364 39,286
Loans held for sale 4,075 3,256 4,126 3,992 3,638
Loans
Commercial 47,315 46,190 46,594 45,369 43,844
Commercial real estate 28,530 28,645 28,973 28,562 28,782
Residential mortgages 21,765 21,285 21,215 21,063 20,656
Retail 47,235 47,477 46,149 44,985 43,915
Total loans 144,845 143,597 142,931 139,979 137,197
Less allowance for loan losses (2,027) (2,022) (2,034) (2,039) (2,035)
Net loans 142,818 141,575 140,897 137,940 135,162
Premises and equipment 1,818 1,835 1,835 1,817 1,817
Goodwill 7,585 7,538 7,444 7,283 7,267
Other intangible assets 3,215 3,227 3,171 3,158 3,128
Other assets 15,059 13,045 13,507 13,519 12,449
Total assets $221,448 $219,232 $216,855 $213,405 $209,907
Liabilities and Shareholders' Equity
Deposits
Noninterest-bearing $28,666 $32,128 $30,554 $30,730 $29,384
Interest-bearing 70,557 70,330 69,095 69,302 69,995
Time deposits greater than $100,000 18,837 22,424 21,312 22,687 22,365
Total deposits 118,060 124,882 120,961 122,719 121,744
Short-term borrowings 28,516 26,933 24,783 20,570 20,651
Long-term debt 44,698 37,602 41,230 41,952 39,327
Other liabilities 9,374 8,618 8,955 7,749 7,929
Total liabilities 200,648 198,035 195,929 192,990 189,651
Shareholders' equity
Preferred stock 1,000 1,000 1,000 1,000 1,000
Common stock 20 20 20 20 20
Capital surplus 5,745 5,762 5,770 5,789 5,819
Retained earnings 21,660 21,242 20,770 20,164 19,568
Less treasury stock (6,972) (6,091) (6,093) (5,421) (5,394)
Other comprehensive income (653) (736) (541) (1,137) (757)
Total shareholders' equity 20,800 21,197 20,926 20,415 20,256
Total liabilities and shareholders' equity $221,448 $219,232 $216,855 $213,405 $209,907
Page 31