1. News Release
Contact:
Steve Dale Judith T. Murphy
Media Relations Investor Relations
(612) 303-0784 (612) 303-0783
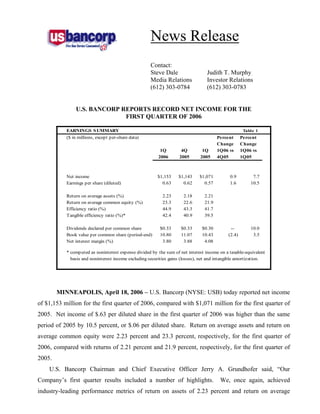
U.S. BANCORP REPORTS RECORD NET INCOME FOR THE
FIRST QUARTER OF 2006
EARNINGS S UMMARY Table 1
($ in millions, except per-share data) Percent Percent
Change Change
1Q 4Q 1Q 1Q06 vs 1Q06 vs
2006 2005 2005 4Q05 1Q05
Net income $1,153 $1,143 $1,071 0.9 7.7
Earnings per share (diluted) 0.63 0.62 0.57 1.6 10.5
Return on average assets (%) 2.23 2.18 2.21
Return on average common equity (%) 23.3 22.6 21.9
Efficiency ratio (%) 44.9 43.3 41.7
Tangible efficiency ratio (%)* 42.4 40.9 39.5
Dividends declared per common share $0.33 $0.33 $0.30 -- 10.0
Book value per common share (period-end) 10.80 11.07 10.43 (2.4) 3.5
Net interest margin (%) 3.80 3.88 4.08
* computed as noninterest expense divided by the sum of net interest income on a taxable-equivalent
basis and noninterest income excluding securities gains (losses), net and intangible amortization.
MINNEAPOLIS, April 18, 2006 – U.S. Bancorp (NYSE: USB) today reported net income
of $1,153 million for the first quarter of 2006, compared with $1,071 million for the first quarter of
2005. Net income of $.63 per diluted share in the first quarter of 2006 was higher than the same
period of 2005 by 10.5 percent, or $.06 per diluted share. Return on average assets and return on
average common equity were 2.23 percent and 23.3 percent, respectively, for the first quarter of
2006, compared with returns of 2.21 percent and 21.9 percent, respectively, for the first quarter of
2005.
U.S. Bancorp Chairman and Chief Executive Officer Jerry A. Grundhofer said, “Our
Company’s first quarter results included a number of highlights. We, once again, achieved
industry-leading performance metrics of return on assets of 2.23 percent and return on average
2. U.S. Bancorp Reports First Quarter 2006 Results
April 18, 2006
Page 2
common equity of 23.3 percent. In fact, the return on average common equity, along with earnings
of 63 cents per diluted share, were record highs for our Company. Further, we returned 158 percent
of our earnings to our shareholders through dividends and share buybacks, while exceeding our
capital targets for the quarter.
“Year-over-year, this quarter’s results were driven by very good growth in our fee-based
businesses, as well as lower credit costs. Fees, driven by payments, trust and investment
management and retail banking, grew year-over-year by 12 percent. This increase represented both
strong organic growth and the benefit of recent acquisitions in the payments and trust and
investment management business lines. Fee-based revenue growth was solid year-over-year and, as
you know, our first quarter is seasonally the weakest.
“We achieved good quality loan growth again this quarter, although competitive pricing and
mix did have an impact on our net interest margin. The net interest margin declined 28 basis points
from the first quarter of last year, 20 basis points of which were due to pricing and growth in lower
spread assets. At this point it appears as though credit spreads have stabilized. Going forward we
will continue to focus on high quality credits which carry the opportunity to cross-sell our great fee-
based products.
“Credit quality was outstanding this quarter. I am very proud of the improvements we have
seen over the past few years in the Company’s overall asset quality. We have worked hard to
reduce the overall risk profile of the Company and we are seeing the results. We will continue to
focus on growing a high-quality loan portfolio that will minimize the volatility of our credit costs
now and in the future.
“Finally, I am proud to announce that April marks the 10-year anniversary of the U.S. Bank
Five Star Service Guarantee. Over that ten year period we have used both internal and external
measurement tools to track and monitor our success in delivering five star service to our customers,
and I am very pleased with the results and how we compare to our major competitors. Our focus on
customer service is paying off, and I want to take this opportunity to thank every employee for their
dedication to serving their customers and representing our brand so well.
“We will continue to leverage our balanced business mix, advantaged scale, reduced risk
profile, low-cost leadership and dedication to customer service to produce high quality earnings for
our shareholders.”
(MORE)
3. U.S. Bancorp Reports First Quarter 2006 Results
April 18, 2006
Page 3
The Company’s results for the first quarter of 2006 improved over the same period of 2005, as
net income increased by $82 million (7.7 percent), primarily due to growth in a majority of fee-
based products and lower provision for credit losses due to strong credit quality and the near-term
favorable impact of bankruptcy legislation enacted in the fourth quarter of 2005. In addition, results
for the first quarter of 2006 were impacted by a few notable items. First, mortgage banking revenue
and noninterest expense were impacted by the Company’s adoption of Statement of Financial
Accounting Standards No. 156 “Accounting for Servicing of Financial Assets” (“SFAS 156”). This
statement, issued by the Financial Accounting Standards Board on March 17, 2006, allowed for the
adoption of the fair value method of accounting for servicing assets, including mortgage servicing
rights (“MSR”). SFAS 156 is effective as of the beginning of any fiscal year after September 15,
2006, with early adoption permitted as of January 1, 2006. The Company elected to retroactively
adopt the standard effective January 1, 2006, for its residential mortgage servicing rights resulting
in a reduction in mortgage banking revenue of approximately $64 million. This revenue reduction
consisted of several components including losses on principal-only securities reclassified as trading
securities, a hedging/MSR valuation mismatch due to the timing of the issuance of SFAS 156, and
the effect of repayments on the valuation of servicing rights that was previously recognized as part
of MSR amortization. This impact to mortgage banking revenue was offset somewhat by changes in
noninterest expense resulting in a favorable net effect of $24 million from eliminating mortgage
servicing rights amortization and reparation under the new standard. Secondly, during the first
quarter, the Company identified certain interest rate swaps that did not qualify for hedge
accounting. As a result, the value of these derivatives was recorded as a $44 million trading gain in
other noninterest income. Finally, during the first quarter of 2006, the Company implemented
Statement of Financial Accounting Standards No. 123R, “Share-Based Payment” (“SFAS 123R”),
a revision of an earlier stock-based compensation standard. As a result, the Company recognized
$13 million of incremental stock-based compensation expense due to certain provisions that require
immediate expense recognition of the value of stock awards to employees that meet retiree status,
despite their continued active employment service.
Total net revenue on a taxable-equivalent basis for the first quarter of 2006 was $206 million
(6.6 percent) higher than the first quarter of 2005, primarily reflecting a 16.8 percent increase in
noninterest income partially offset by a 1.5 percent decline in net interest income. Noninterest
income growth was due to 12.0 percent growth in fee-based revenue across the majority of fee
(MORE)
4. U.S. Bancorp Reports First Quarter 2006 Results
April 18, 2006
Page 4
categories driven by organic growth, the expansion in trust and payment processing businesses and
the recognition of the derivatives gain, partially offset by the impact of adopting SFAS 156. In
addition, there was a favorable change due to $59 million in securities losses in the first quarter of
2005. Total noninterest expense in the first quarter of 2006 was $169 million (12.7 percent) higher
than the first quarter of 2005, primarily reflecting operating expenses and business integration costs
principally associated with the trust and payment processing businesses, increased pension costs
and higher amortization for investments in tax-advantaged projects from a year ago.
Provision for credit losses for the first quarter of 2006 was $115 million, a decrease of $57
million from the first quarter of 2005. The decrease in the provision for credit losses year-over-year
primarily reflected strong credit quality and the near-term favorable impact of changes in
bankruptcy law in the fourth quarter of 2005. Net charge-offs in the first quarter of 2006 were $115
million, compared with the fourth quarter of 2005 net charge-offs of $213 million and the first
quarter of 2005 net charge-offs of $172 million. Net charge-offs in the fourth quarter of 2005
included approximately $56 million of additional bankruptcy related charge-offs and $8 million of
charge-offs related to a policy change to shorten the timeframe for charging off overdrawn deposit
accounts in accordance with regulatory guidance. Total nonperforming assets were $619 million at
March 31, 2006, compared with $644 million at December 31, 2005, and $665 million at March 31,
2005. The ratio of the allowance for credit losses to nonperforming loans was 432 percent at March
31, 2006, compared with 414 percent at December 31, 2005, and 404 percent at March 31, 2005.
(MORE)
5. U.S. Bancorp Reports First Quarter 2006 Results
April 18, 2006
Page 5
INCO ME S TATEMENT HIGHLIGHTS Tabl e 2
(T axable-equivalent basis, $ in millions, Pe rce nt Pe rce nt
excep t p er-share data) Change Change
1Q 4Q 1Q 1Q 06 vs 1Q 06 vs
2006 2005 2005 4Q 05 1Q 05
Net interest income $1,725 $1,785 $1,751 (3.4) (1.5)
Noninterest income 1,614 1,546 1,382 4.4 16.8
T otal net revenue 3,339 3,331 3,133 0.2 6.6
Noninterest exp ense 1,500 1,464 1,331 2.5 12.7
Income before p rovision and income taxes 1,839 1,867 1,802 (1.5) 2.1
Provision for credit losses 115 205 172 (43.9) (33.1)
Income before income taxes 1,724 1,662 1,630 3.7 5.8
T axable-equivalent adjustment 10 10 7 -- 42.9
Ap p licable income taxes 561 509 552 10.2 1.6
Net income $1,153 $1,143 $1,071 0.9 7.7
Diluted earnings p er share $0.63 $0.62 $0.57 1.6 10.5
Net Interest Income
First quarter net interest income on a taxable-equivalent basis was $1,725 million, compared
with $1,751 million recorded in the first quarter of 2005. Average earning assets for the period
increased over the first quarter of 2005 by $9.8 billion (5.7 percent), primarily driven by a $5.2
billion (32.6 percent) increase in residential mortgages, a $2.9 billion (7.1 percent) increase in total
commercial loans, a $2.5 billion (5.8 percent) increase in total retail loans and a $1.1 billion (4.0
percent) increase in total commercial real estate loans. This was partially offset by a $3.1 billion
(7.3 percent) decrease in investment securities. The positive impact to net interest income from the
growth in earning assets was more than offset by a lower net interest margin. The net interest
margin in the first quarter of 2006 was 3.80 percent, compared with 4.08 percent in the first quarter
of 2005. The decline in the net interest margin reflected the competitive lending environment
during 2005, asset/liability management decisions and the impact of changes in the yield curve from
a year ago. Since the first quarter of 2005, credit spreads have tightened by approximately 20 basis
points across most lending products due to competitive pricing and a change in mix due to growth
in lower-spread, fixed-rate credit products. The net interest margin also declined due to funding
incremental asset growth with higher cost wholesale funding, share repurchases and asset/liability
decisions designed to minimize the Company’s rate sensitivity position, including a 46.5 percent
(MORE)
6. U.S. Bancorp Reports First Quarter 2006 Results
April 18, 2006
Page 6
reduction in the net receive fixed swap position since March 31, 2005. An increase in the margin
benefit of net free funds and loan fees partially offset these factors.
Net interest income in the first quarter of 2006 was lower than the fourth quarter of 2005 by
$60 million (3.4 percent). While the Company experienced modest loan growth in most loan
categories, growth in lower-spread residential mortgages and fixed-rate retail products drove more
than 60 percent of the $1.3 billion increase in average loans from the prior quarter. The increase in
average loans was offset by a $1.8 billion decline in average investment securities. The net interest
margin of 3.80 percent in the first quarter of 2006 was 8 basis points lower than the net interest
margin of 3.88 percent in the fourth quarter of 2005. The decline in the net interest margin from the
fourth quarter of 2005 reflected the mix of loan growth toward fixed-rate products, higher short-
term rates and funding a higher percentage of earning assets with wholesale funding. During the
first quarter of 2006, credit spreads narrowed 3 basis points compared with the fourth quarter of
2005.
(MORE)
7. U.S. Bancorp Reports First Quarter 2006 Results
April 18, 2006
Page 7
NET INTERES T INC O ME Tabl e 3
(T axable-equivalent basis; $ in m illions)
C h an ge C h an ge
1Q 4Q 1Q 1Q 06 vs 1Q 06 vs
2006 2005 2005 4Q 05 1Q 05
Com ponent s of net int erest incom e
Incom e on earning asset s $2,903 $2,843 $2,442 $60 $461
Expense on int erest -bearing liabilit ies 1,178 1,058 691 120 487
Net int erest incom e $1,725 $1,785 $1,751 $(60) $(26)
Average yields and rat es paid
Earning asset s yield 6.40% 6.18% 5.69% 0.22% 0.71%
Rat e paid on int erest -bearing liabilit ies 3.10 2.77 1.97 0.33 1.13
Gross int erest m argin 3.30% 3.41% 3.72% (0.11%) (0.42%)
Net int erest m argin 3.80% 3.88% 4.08% (0.08%) (0.28%)
Average balances
Invest m ent securit ies $39,680 $41,494 $42,813 $(1,814) $(3,133)
Loans 139,379 138,069 127,654 1,310 11,725
Earning asset s 183,101 183,095 173,294 6 9,807
Int erest -bearing liabilit ies 153,911 151,500 142,052 2,411 11,859
Net free funds* 29,190 31,595 31,242 (2,405) (2,052)
* Represent s nonint erest -bearing deposit s, allowance for loan losses, unrealized gain (loss) on
available-for-sale securit ies, non-earnings asset s, ot her nonint erest -bearing liabilit ies and equit y.
(MORE)
8. U.S. Bancorp Reports First Quarter 2006 Results
April 18, 2006
Page 8
AVERAG E LO ANS Tabl e 4
($ in m illions) Pe rce n t Pe rce n t
C h an ge C h an ge
1Q 4Q 1Q 1Q 06 vs 1Q 06 vs
2006 2005 2005 4Q 05 1Q 05
Com m ercial $38,847 $38,816 $36,083 0.1 7.7
Lease financing 5,078 4,948 4,914 2.6 3.3
T ot al com m ercial 43,925 43,764 40,997 0.4 7.1
--
Com m ercial m ort gages 20,269 20,307 20,268 (0.2)
Const ruct ion and developm ent 8,347 8,256 7,236 1.1 15.4
T ot al com m ercial real est at e 28,616 28,563 27,504 0.2 4.0
Resident ial m ort gages 20,987 20,319 15,827 3.3 32.6
Credit card 7,120 6,825 6,417 4.3 11.0
Ret ail leasing 7,250 7,403 7,198 (2.1) 0.7
Hom e equit y and second m ort gages 14,935 14,946 14,844 (0.1) 0.6
Ot her ret ail 16,546 16,249 14,867 1.8 11.3
T ot al ret ail 45,851 45,423 43,326 0.9 5.8
T ot al loans $139,379 $138,069 $127,654 0.9 9.2
Average loans for the first quarter of 2006 were $11.7 billion (9.2 percent) higher than the first
quarter of 2005, driven by growth in average residential mortgages of $5.2 billion (32.6 percent),
total commercial loans of $2.9 billion (7.1 percent) and total retail loans of $2.5 billion (5.8
percent). Total commercial real estate loans also increased year-over-year by $1.1 billion (4.0
percent). Average loans for the first quarter of 2006 were higher than the fourth quarter of 2005 by
$1.3 billion (.9 percent), reflecting growth in the majority of loan categories.
Average investment securities in the first quarter of 2006 were $3.1 billion (7.3 percent) lower
than in the first quarter of 2005. The change in the balance of the investment securities portfolio
from a year ago principally reflected asset/liability risk management decisions to minimize the
Company’s rate sensitivity position given the changing rate environment and mix of loan growth.
Additionally, the Company reclassified approximately $460 million of principal-only securities to
its trading account effective as of January 1, 2006, in connection with the adoption of SFAS 156.
During the first quarter of 2006, the Company maintained a mix of approximately 41 percent
variable-rate securities.
(MORE)
9. U.S. Bancorp Reports First Quarter 2006 Results
April 18, 2006
Page 9
AVERAG E DEPO S ITS Tabl e 5
($ in m illions) Pe rce n t Pe rce n t
C h an ge C h an ge
1Q 4Q 1Q 1Q 06 vs 1Q 06 vs
2006 2005 2005 4Q 05 1Q 05
Nonint erest -bearing deposit s $28,837 $29,898 $28,417 (3.5) 1.5
Int erest -bearing deposit s
--
Int erest checking 23,141 22,473 23,146 3.0
M oney m arket savings 27,378 28,710 30,264 (4.6) (9.5)
Savings account s 5,689 5,648 5,968 0.7 (4.7)
Savings deposit s 56,208 56,831 59,378 (1.1) (5.3)
T im e cert ificat es of deposit less
t han $100,000 13,505 13,397 12,978 0.8 4.1
T im e deposit s great er t han $100,000 21,613 22,205 18,650 (2.7) 15.9
T ot al int erest -bearing deposit s 91,326 92,433 91,006 (1.2) 0.4
T ot al deposit s $120,163 $122,331 $119,423 (1.8) 0.6
Average noninterest-bearing deposits for the first quarter of 2006 increased $420 million (1.5
percent) compared with the first quarter of 2005 primarily reflecting growth in business demand
account balances within most lines of business.
Average total savings deposits declined year-over-year by $3.2 billion (5.3 percent) due to
reductions in average money market savings and savings accounts. Average money market savings
balances declined by $2.9 billion (9.5 percent) year-over-year, primarily due to a decline in
balances within the branches. This was partially offset by increases in corporate trust and
government banking balances. The overall decrease in average money market savings balances
year-over-year was primarily the result of the Company’s deposit pricing decisions for money
market products in relation to other fixed-rate deposit products offered. A portion of branch based
money market savings accounts have migrated to fixed-rate time certificates, while larger customer
money market savings accounts have migrated to time deposits greater than $100,000 as rates
increased on the time deposit products.
Average time certificates of deposit less than $100,000 were higher in the first quarter of 2006
than the first quarter of 2005 by $527 million (4.1 percent). The Company experienced year-over-
year growth in average time deposits greater than $100,000 of $3.0 billion (15.9 percent). This
growth was broad-based across most areas of the bank including; government banking, commercial
and branch banking, private client and corporate trust, as customers migrated balances to higher rate
deposits.
(MORE)
10. U.S. Bancorp Reports First Quarter 2006 Results
April 18, 2006
Page 10
Average noninterest-bearing deposits for the first quarter of 2006 were $1.1 billion (3.5
percent) lower than the fourth quarter of 2005, primarily due to seasonally lower corporate trust,
consumer, mortgage banking and title company balances. Average savings deposits declined by
$623 million (1.1 percent) in the current quarter from the fourth quarter of 2005. Time certificates
of deposit less than $100,000 increased modestly from the fourth quarter of 2005, while time
deposits greater than $100,000 declined by $592 million (2.7 percent).
(MORE)
11. U.S. Bancorp Reports First Quarter 2006 Results
April 18, 2006
Page 11
NO NINTERES T INCO ME Tabl e 6
($ in millions) Pe rce nt Pe rce nt
Change Change
1Q 4Q 1Q 1Q 06 vs 1Q 06 vs
2006 2005 2005 4Q 05 1Q 05
Credit and debit card revenue $182 $197 $154 (7.6) 18.2
Corp orate p ay ment p roducts revenue 127 126 107 0.8 18.7
AT M p rocessing services 59 61 47 (3.3) 25.5
M erchant p rocessing services 213 194 178 9.8 19.7
T rust and investment management fees 297 258 247 15.1 20.2
Dep osit service charges 232 238 210 (2.5) 10.5
T reasury management fees 107 104 107 2.9 --
Commercial p roducts revenue 104 101 96 3.0 8.3
M ortgage banking revenue 24 109 102 (78.0) (76.5)
Investment p roducts fees and commissions 38 37 39 2.7 (2.6)
Securities gains (losses), net -- (49) (59) nm nm
Other 231 170 154 35.9 50.0
T otal noninterest income $1,614 $1,546 $1,382 4.4 16.8
Noninterest Income
First quarter noninterest income was $1,614 million, an increase of $232 million (16.8 percent)
from the same quarter of 2005 and $68 million (4.4 percent) higher than the fourth quarter of 2005.
The increase in noninterest income over the first quarter of 2005 was driven by favorable variances
in the majority of fee income categories, an increase of $59 million due to net securities losses in
the prior year and the recognition of $44 million in trading gains related to interest rate swaps,
partially offset by the reduction in mortgage banking revenue. Credit and debit card revenue and
corporate payment products revenue were both higher in the first quarter of 2006 than the first
quarter of 2005 by $28 million and $20 million, or 18.2 percent and 18.7 percent, respectively. The
growth in credit and debit card revenue was primarily driven by higher transaction volumes. The
corporate payment products revenue growth reflected growth in sales and card usage, and the
acquisition of a small fleet card business. ATM processing services revenue was higher by $12
million (25.5 percent) in the first quarter of 2006 than the same quarter of the prior year, primarily
due to the acquisition of an ATM business in May of 2005. Merchant processing services revenue
was higher in the first quarter of 2006 than the same quarter of 2005 by $35 million (19.7 percent),
reflecting an increase in sales volume driven by new business growth and acquisitions and higher
(MORE)
12. U.S. Bancorp Reports First Quarter 2006 Results
April 18, 2006
Page 12
equipment fees. Trust and investment management fees increased by $50 million (20.2 percent)
year-over-year, primarily due to improved equity market conditions, account growth and the
acquisition of the corporate and institutional trust business of Wachovia Corporation. Deposit
service charges grew year-over-year by $22 million (10.5 percent) due to increased transaction-
related fees. Other income was higher by $77 million (50.0 percent) as compared to 2005,
primarily due to the gain on interest rate swaps that did not qualify as hedges ($44 million),
improving end-of-term retail lease residual values, higher student loan sales gains and the receipt of
a favorable settlement within the merchant processing business. These favorable changes in fee-
based revenue were offset by the decline in mortgage banking revenue, principally driven by the
adoption of the fair value method of accounting for mortgage servicing rights ($64 million) and
lower gains from the sale of mortgage loan production.
Noninterest income was higher in the first quarter of 2006 than the fourth quarter of 2005 by
$68 million (4.4 percent). This reflected a $49 million increase due to net securities losses in the
fourth quarter of 2005, business acquisitions and the net decrease in noninterest income of $20
million from the derivatives and adopting SFAS 156. Merchant processing services revenue
increased by $19 million (9.8 percent), due primarily to recent business acquisitions. Trust and
investment management fees increased during the first quarter of 2006 by $39 million (15.1
percent) due to core account growth and the Wachovia corporate and institutional trust acquisition.
In addition, other revenue increased principally due to the interest rate swap gains, increased levels
of student loan sales gains and the favorable settlement within the merchant processing business.
These gains were offset by an $85 million (78.0 percent) reduction in mortgage banking revenue
primarily due to the adoption of the fair value method of accounting for mortgage servicing rights
and lower mortgage loan production. Credit and debit card revenue and deposit service charges
decreased by $15 million (7.6 percent) and $6 million (2.5 percent) respectively, reflecting
seasonally lower consumer post-holiday spending and lower transaction-related fees from the fourth
quarter of 2005.
(MORE)
13. U.S. Bancorp Reports First Quarter 2006 Results
April 18, 2006
Page 13
NO NINTERES T EXPENS E Tabl e 7
($ in millions) Pe rce nt Pe rce nt
Change Change
1Q 4Q 1Q 1Q 06 vs 1Q 06 vs
2006 2005 2005 4Q 05 1Q 05
Comp ensation $633 $601 $567 5.3 11.6
Emp loy ee benefits 133 101 116 31.7 14.7
Net occup ancy and equip ment 165 166 154 (0.6) 7.1
Professional services 35 47 36 (25.5) (2.8)
M arketing and business develop ment 40 64 43 (37.5) (7.0)
T echnology and communications 117 129 106 (9.3) 10.4
Postage, p rinting and sup p lies 66 65 63 1.5 4.8
Other intangibles 85 81 71 4.9 19.7
Other 226 210 175 7.6 29.1
T otal noninterest exp ense $1,500 $1,464 $1,331 2.5 12.7
Noninterest Expense
First quarter noninterest expense totaled $1,500 million, an increase of $169 million (12.7
percent) from the same quarter of 2005 and a $36 million (2.5 percent) increase from the fourth
quarter of 2005. The increases from a year ago and the fourth quarter of 2005 reflected the impact
of business acquisitions and related integration costs and the adoption of the new accounting
standards. Compensation expense was higher year-over-year by $66 million (11.6 percent),
principally due to business expansion, including the Company’s payment processing businesses, the
corporate and institutional trust business of Wachovia Corporation and other growth initiatives and
the adoption of SFAS 123R. Employee benefits increased year-over-year by $17 million (14.7
percent), primarily as a result of higher pension costs, payroll taxes and 401(k) costs. Net
occupancy and equipment increased in the first quarter of 2006 from the same quarter of 2005 by
$11 million (7.1 percent) primarily due to business expansion. Technology and communications
expense rose by $11 million (10.4 percent) due to increased software expense and higher outside
data processing expense principally associated with expanding a prepaid gift card program.
Intangible expense increased year-over-year by $14 million (19.7 percent) primarily due to business
expansion in the payment processing and trust businesses. The impact of eliminating amortization
(MORE)
14. U.S. Bancorp Reports First Quarter 2006 Results
April 18, 2006
Page 14
of mortgage servicing rights was more than offset by MSR reparation of $54 million recognized in
the first quarter of 2005. Other expense increased in the first quarter of 2006 from the same quarter
of 2005 by $51 million (29.1 percent), primarily due to the increased investments in tax-advantaged
projects relative to a year ago, increased fraud losses and business integration costs.
Noninterest expense in the first quarter of 2006 was higher than the fourth quarter of 2005 by
$36 million (2.5 percent). The increase in noninterest expense in the first quarter of 2006 from the
fourth quarter of 2005 was primarily due to a $32 million increase in compensation expense due to
business expansion and other initiatives and an increase in benefits expense primarily related to
pension costs and seasonally higher payroll taxes and other benefits. In addition, other expense
increased during the quarter due to a reduction in the Company’s merchant airline exposure
recognized in the fourth quarter of 2005 and an increase in business integration costs, partially
offset by a decline in the amortization related to tax-advantaged projects. Offsetting these
unfavorable changes were lower costs due to marketing and business development and professional
services, primarily due to the timing of business initiatives. Additionally, technology and
communications expense decreased by $12 million (9.3 percent), quarter-over-quarter, primarily
due to seasonally lower processing costs for the prepaid gift card program and favorable volume-
based expense credits that occur seasonally in the first quarter of 2006.
Provision for Income Taxes
The provision for income taxes for the first quarter of 2006 resulted in an effective tax rate of
32.7 percent compared with an effective tax rate of 34.0 percent in the first quarter of 2005 and an
effective tax rate of 30.8 percent in fourth quarter of 2005. The decline in the effective rate from
the first quarter of 2005 is primarily due to higher tax exempt income and tax credit investments.
The increase in the effective rate from the fourth quarter of 2005 reflected the timing of tax-
advantaged investments in the fourth quarter of 2005.
(MORE)
15. U.S. Bancorp Reports First Quarter 2006 Results
April 18, 2006
Page 15
ALLO WANCE FO R CREDIT LO S S ES Tabl e 8
($ in millions) 1Q 4Q 3Q 2Q 1Q
2006 2005 2005 2005 2005
Balance, beginning of p eriod $2,251 $2,258 $2,269 $2,269 $2,269
Net charge-offs
Commercial 5 15 7 9 14
Lease financing 7 7 16 6 13
T otal commercial 12 22 23 15 27
Commercial mortgages 2 (1) 2 1 4
Construction and develop ment -- -- (2) (3) 2
T otal commercial real estate 2 (1) -- (2) 6
Residential mortgages 7 10 9 8 9
Credit card 46 86 63 64 65
Retail leasing 4 8 5 5 8
Home equity and second mortgages 12 21 14 16 17
Other retail 32 67 42 38 40
T otal retail 94 182 124 123 130
T otal net charge-offs 115 213 156 144 172
Provision for credit losses 115 205 145 144 172
Acquisitions and other changes -- 1 -- -- --
Balance, end of p eriod $2,251 $2,251 $2,258 $2,269 $2,269
Comp onents
Allowance for loan losses $2,035 $2,041 $2,055 $2,082 $2,082
Liability for unfunded credit commitments 216 210 203 187 187
T otal allowance for credit losses $2,251 $2,251 $2,258 $2,269 $2,269
Gross charge-offs $175 $267 $229 $222 $231
Gross recoveries $60 $54 $73 $78 $59
Net charge-offs to average loans (%) 0.33 0.61 0.46 0.44 0.55
Allowance as a p ercentage of
Period-end loans 1.62 1.63 1.65 1.70 1.76
Nonp erforming loans 432 414 413 441 404
Nonp erforming assets 364 350 351 372 341
(MORE)
16. U.S. Bancorp Reports First Quarter 2006 Results
April 18, 2006
Page 16
Credit Quality
The allowance for credit losses was $2,251 million at March 31, 2006, and at December 31,
2005, compared with $2,269 million at March 31, 2005. The ratio of the allowance for credit losses
to period-end loans was 1.62 percent at March 31, 2006, compared with 1.63 percent at December
31, 2005, and 1.76 percent at March 31, 2005. The ratio of the allowance for credit losses to
nonperforming loans was 432 percent at March 31, 2006, compared with 414 percent at December
31, 2005, and 404 percent at March 31, 2005. Total net charge-offs in the first quarter of 2006 were
$115 million, compared with the fourth quarter of 2005 net charge-offs of $213 million and the first
quarter of 2005 net charge-offs of $172 million. The decrease in total net charge-offs was
principally due to the impact of changes in bankruptcy legislation that went into effect during the
fourth quarter of 2005.
Retail loan net charge-offs were $94 million in the first quarter of 2006 compared with $182
million in the fourth quarter of 2005 and $130 million in the first quarter of 2005. The decrease in
retail loan net charge-offs reflected additional charge-offs in the fourth quarter of 2005 related to
the new bankruptcy legislation. Retail loan net charge-offs as a percent of average loans outstanding
were .83 percent in the first quarter of 2006, compared with 1.59 percent and 1.22 percent in the
fourth quarter of 2005 and first quarter of 2005, respectively. The Company anticipates that
bankruptcy charge-offs will return to more normal levels in future quarters.
Commercial and commercial real estate loan net charge-offs were $14 million for the first
quarter of 2006, or .08 percent of average loans outstanding, compared with $21 million, or .12
percent of average loans outstanding, in the fourth quarter of 2005 and $33 million, or .20 percent
of average loans outstanding, in the first quarter of 2005.
(MORE)
17. U.S. Bancorp Reports First Quarter 2006 Results
April 18, 2006
Page 17
CREDIT RATIO S Tabl e 9
(Percent) 1Q 4Q 3Q 2Q 1Q
2006 2005 2005 2005 2005
Net charge-offs ratios *
0.05 0.15 0.07 0.10 0.16
Commercial
0.56 0.56 1.29 0.49 1.07
Leas e financing
0.11 0.20 0.21 0.14 0.27
Total commercial
0.04 (0.02) 0.04 0.02 0.08
Commercial mortgages
-- -- (0.10) (0.16) 0.11
Cons truction and development
0.03 (0.01) -- (0.03) 0.09
Total commercial real es tate
0.14 0.20 0.19 0.19 0.23
Res idential mortgages
2.62 5.00 3.74 3.93 4.11
Credit card
0.22 0.43 0.27 0.27 0.45
Retail leas ing
0.33 0.56 0.37 0.43 0.46
Home equity and s econd mortgages
0.78 1.64 1.04 1.01 1.09
Other retail
0.83 1.59 1.09 1.12 1.22
Total retail
0.33 0.61 0.46 0.44 0.55
Total net charge-offs
Delinquent loan ratios - 90 days or more pas t due excluding nonperforming loans **
0.05 0.05 0.04 0.05 0.06
Commercial
-- -- 0.01 0.01 0.02
Commercial real es tate
0.31 0.32 0.30 0.32 0.41
Res idential mortgages
0.36 0.36 0.36 0.40 0.43
Retail
0.18 0.18 0.18 0.19 0.22
Total loans
Delinquent loan ratios - 90 days or more pas t due including nonperforming loans **
0.64 0.69 0.74 0.74 0.84
Commercial
0.51 0.55 0.57 0.59 0.68
Commercial real es tate
0.53 0.55 0.53 0.55 0.66
Res idential mortgages
0.52 0.50 0.45 0.43 0.47
Retail
0.56 0.58 0.58 0.58 0.66
Total loans
* a nn u a lize d a nd c a lc u la te d o n a v e ra ge lo a n b a la n c e s
** ra tio s a re e xpre s s e d a s a pe rc e nt o f e n d in g lo a n b a la n c e s
(MORE)
18. U.S. Bancorp Reports First Quarter 2006 Results
April 18, 2006
Page 18
AS S ET QUALITY Table 10
($ in millions)
Mar 31 Dec 31 S ep 30 Jun 30 Mar 31
2006 2005 2005 2005 2005
Nonperforming loans
Commercial $219 $231 $265 $238 $254
Lease financing 41 42 35 60 70
Total commercial 260 273 300 298 324
Commercial mortgages 123 134 144 140 159
Construction and development 23 23 16 21 21
Total commercial real estate 146 157 160 161 180
Residential mortgages 45 48 44 42 41
Retail 70 66 43 13 16
Total nonperforming loans 521 544 547 514 561
Other real estate 71 71 68 68 66
Other nonperforming assets 27 29 29 28 38
Total nonperforming assets* $619 $644 $644 $610 $665
Accruing loans 90 days or more past due $251 $253 $242 $258 $285
Restructured loans that continue
to accrue interest $371 $315 $301 $274 $145
Nonperforming assets to loans
plus ORE (%) 0.45 0.47 0.47 0.46 0.52
*does not include accruing loans 90 days or more past due
Nonperforming assets at March 31, 2006, totaled $619 million, compared with $644 million
at December 31, 2005, and $665 million at March 31, 2005. The ratio of nonperforming assets to
loans and other real estate was .45 percent at March 31, 2006, compared with .47 percent at
December 31, 2005, and .52 percent at March 31, 2005. Restructured loans that continue to accrue
interest have increased from the first and fourth quarters of 2005, reflecting the impact of
implementing higher minimum balance payment requirements for credit card customers in response
to industry guidance issued by the banking regulatory agencies.
(MORE)
19. U.S. Bancorp Reports First Quarter 2006 Results
April 18, 2006
Page 19
CAPITAL PO S ITIO N Tabl e 11
($ in millions) Mar 31 De c 31 S e p 30 Jun 30 Mar 31
2006 2005 2005 2005 2005
T otal shareholders' equity $20,256 $20,086 $19,864 $19,901 $19,208
T ier 1 cap ital 16,478 15,145 15,180 14,564 14,943
T otal risk-based cap ital 24,328 23,056 23,283 22,362 23,099
Common equity to assets 9.2 % 9.6 % 9.6 % 9.8 % 9.7 %
T angible common equity to assets 5.4 5.9 6.2 6.1 6.2
T ier 1 cap ital ratio 8.9 8.2 8.4 8.1 8.6
T otal risk-based cap ital ratio 13.1 12.5 12.8 12.5 13.3
Leverage ratio 8.2 7.6 7.7 7.5 7.9
Total shareholders’ equity was $20.3 billion at March 31, 2006, compared with $19.2
billion at March 31, 2005. The increase was the result of corporate earnings and the issuance of
$1.0 billion of non-cumulative, perpetual preferred stock on March 27, 2006, offset by share
buybacks and dividends.
Tangible common equity to assets was 5.4 percent at March 31, 2006, compared with 5.9
percent at December 31, 2005, and 6.2 percent at March 31, 2005. The Tier 1 capital ratio was 8.9
percent at March 31, 2006, compared with 8.2 percent at December 31, 2005, and 8.6 percent at
March 31, 2005. The total risk-based capital ratio was 13.1 percent at March 31, 2006, compared
with 12.5 percent at December 31, 2005, and 13.3 percent at March 31, 2005. The leverage ratio
was 8.2 percent at March 31, 2006, compared with 7.6 percent at December 31, 2005, and 7.9
percent at March 31, 2005. All regulatory ratios continue to be in excess of stated “well
capitalized” requirements.
(MORE)
20. U.S. Bancorp Reports First Quarter 2006 Results
April 18, 2006
Page 20
CO MMO N S HARES Tabl e 12
(M illions) 1Q 4Q 3Q 2Q 1Q
2006 2005 2005 2005 2005
Beginning shares outstanding 1,815 1,818 1,829 1,842 1,858
Shares issued for stock op tion and stock p urchase
p lans, acquisitions and other corp orate p urp oses 9 6 4 4 5
Shares rep urchased (41) (9) (15) (17) (21)
Ending shares outstanding 1,783 1,815 1,818 1,829 1,842
On December 21, 2004, the Board of Directors of U.S. Bancorp approved an authorization to
repurchase up to 150 million shares of outstanding common stock during the following 24 months.
During the first quarter of 2006, the Company repurchased 41 million shares of common stock. As
of March 31, 2006, there were approximately 43 million shares remaining to be repurchased under
the current authorization.
(MORE)
21. U.S. Bancorp Reports First Quarter 2006 Results
April 18, 2006
Page 21
LINE O F BUS INES S FINANCIAL PERFO RMANCE* Tabl e 13
($ in m illions)
Ne t In com e Pe rce n t C h an ge 1Q 06
1Q 4Q 1Q 1Q 06 vs 1Q 06 vs Earn i n gs
B u si n e s s Li n e 2006 2005 2005 4Q 05 1Q 05 C om pos i ti on
W holesale Banking $279 $282 $253 (1.1) 10.3 24 %
Consum er Banking 448 458 414 (2.2) 8.2 39
P rivat e Client , T rust
and Asset Managem ent 134 128 109 4.7 22.9 11
P aym ent Services 226 169 169 33.7 33.7 20
T reasury and Corporat e Support 66 106 126 (37.7) (47.6) 6
Consolidat ed Com pany $1,153 $1,143 $1,071 0.9 7.7 100 %
* prelim inary dat a
Lines of Business
Within the Company, financial performance is measured by major lines of business, which
include Wholesale Banking, Consumer Banking, Private Client, Trust and Asset Management,
Payment Services, and Treasury and Corporate Support. These operating segments are components
of the Company about which financial information is available and is evaluated regularly in
deciding how to allocate resources and assess performance. Noninterest expenses incurred by
centrally managed operations or business lines that directly support another business line’s
operations are charged to the applicable business line based on its utilization of those services
primarily measured by the volume of customer activities, number of employees or other relevant
factors. These allocated expenses are reported as net shared services expense within noninterest
expense. Designations, assignments and allocations change from time to time as management
systems are enhanced, methods of evaluating performance or product lines change or business
segments are realigned to better respond to our diverse customer base. During 2006, certain
organization and methodology changes were made and, accordingly, prior period results have been
restated and presented on a comparable basis.
Wholesale Banking offers lending, depository, treasury management and other financial
services to middle market, large corporate and public sector clients. Wholesale Banking
contributed $279 million of the Company’s net income in the first quarter of 2006, a 10.3 percent
(MORE)
22. U.S. Bancorp Reports First Quarter 2006 Results
April 18, 2006
Page 22
increase over the same period of 2005 and a 1.1 percent decrease from the fourth quarter of 2005.
The increase in Wholesale Banking’s first quarter 2006 contribution over the same quarter of 2005
was the result of favorable variances in total net revenue (4.0 percent) and the provision for credit
losses. The favorable variance in total net revenue year-over-year was the result of growth in net
interest income (5.9 percent), while the business line’s total noninterest income remained relatively
flat during the first quarter of 2006. Increases in commercial lease and foreign exchange trading
revenue were offset by an unfavorable variance in equity investment revenue. The increase in net
interest income was driven primarily by loan growth and the margin benefit of deposits partially
offset by tighter credit spreads. The lower provision for credit losses reflected strong economic
conditions resulting in an increase in net recoveries of $17 million compared with a year ago.
The decrease in Wholesale Banking’s contribution to net income in the first quarter of 2006
from the fourth quarter of 2005 was the result of an unfavorable variance in total net revenue (3.0
percent) partially offset by lower total noninterest expense (3.9 percent) and provision for credit
losses. Total net revenue was lower on a linked quarter basis with decreases in both net interest
income (2.1 percent) and noninterest income (4.6 percent). The unfavorable variance in net interest
income was primarily due to seasonally lower deposit balances partially offset by the benefit from
wider deposit spreads. The decrease in noninterest income on a linked quarter basis was primarily
due to decreases in capital markets revenue, commercial lease revenue and income related to equity
investments, partially offset by an increase in treasury management fees. Net recoveries of $14
million in the first quarter of 2006, compared with net recoveries of $7 million in the fourth quarter
of 2005, drove the favorable variance in the provision for credit losses quarter-over-quarter.
Consumer Banking delivers products and services through banking offices, telephone servicing
and sales, on-line services, direct mail and ATMs. It encompasses community banking,
metropolitan banking, in-store banking, small business banking, including lending guaranteed by
the Small Business Administration, small-ticket leasing, consumer lending, mortgage banking,
consumer finance, workplace banking, student banking, 24-hour banking, and investment product
and insurance sales. Consumer Banking contributed $448 million of the Company’s net income in
the first quarter of 2006, an 8.2 percent increase over the same period of 2005 and a 2.2 percent
decrease from the prior quarter. The favorable increase year-over-year was the result of higher total
net revenue (1.0 percent), a reduction in total noninterest expense (4.0 percent) and lower provision
for credit losses (13.8 percent). Total net revenue was higher than the same quarter of 2005 due to
(MORE)
23. U.S. Bancorp Reports First Quarter 2006 Results
April 18, 2006
Page 23
growth in net interest income (4.2 percent), partially offset by a reduction in noninterest income
(5.6 percent). Net interest income was higher year-over-year primarily due to growth in average
loan balances of 12.3 percent and the margin benefit of deposits, somewhat offset by lower spreads
on those assets given the competitive lending environment. Noninterest income decreased in the
first quarter of 2006 over the same period of 2005, principally due to a reduction in mortgage
banking revenue of $64 million due to adopting fair value accounting for mortgage servicing rights
as of January 1, 2006, and lower mortgage loan production given rising interest rates. The business
line generated strong growth from a year ago in deposit service charges (10.5 percent) and other
revenue (56.6 percent). The increase in other revenue included higher gains from the sales of
student loans and improving end-of-term retail lease residual values. Total noninterest expense in
the first quarter of 2006 was lower compared with the same quarter of 2005, due to the elimination
of MSR amortization under SFAS 156 which resulted in a decrease in other intangible expense of
nearly $50 million. This favorable variance was partially offset by an increase in compensation and
employee benefits (2.9 percent) and in net shared services expense (6.7 percent) based on
transaction volumes. An $11 million year-over-year decrease in net charge-offs (13.8 percent)
drove the favorable variance in the business line’s provision for credit losses.
The decrease in Consumer Banking’s contribution in the first quarter of 2006 from the fourth
quarter of 2005 was the result of an unfavorable variance in total net revenue (6.5 percent) partially
offset by lower total noninterest expense (8.6 percent) and provision for credit losses (24.2 percent).
The decline in total net revenue was due primarily to a decline in total noninterest income (15.3
percent) which reflected the impact of adopting SFAS 156 on mortgage banking revenue and
seasonally lower deposit service fees, partially offset by higher gains from the sales of student
loans. Noninterest expense was also impacted by the adoption of SFAS 156, as amortization of
servicing rights was nearly $50 million lower on a linked quarter basis. In addition, there were
favorable variances in travel and entertainment, other loan expense and marketing and business
development expense due to seasonality and the timing of business initiatives. These expense
reductions were partially offset by increased net shared services expense from the fourth quarter of
2005. The decrease in the provision for credit losses was due to a $22 million decrease in net
charge-offs, primarily related to the impact of new bankruptcy legislation in the fourth quarter of
2005.
(MORE)
24. U.S. Bancorp Reports First Quarter 2006 Results
April 18, 2006
Page 24
Private Client, Trust and Asset Management provides trust, private banking, financial advisory,
investment management and mutual fund servicing through five businesses: Private Client Group,
Corporate Trust, FAF Advisors, Institutional Trust and Custody and Fund Services. Private Client,
Trust and Asset Management contributed $134 million of the Company’s net income in the first
quarter of 2006, 22.9 percent higher than the same period of 2005 and 4.7 percent higher than the
fourth quarter of 2005. The increase in the business line’s contribution in the first quarter of 2006
over the same quarter of 2005 was the result of a favorable variance in total net revenue (22.4
percent) partially offset by an increase in total noninterest expense (22.8 percent). Net interest
income was favorably impacted year-over-year by wider deposit spreads and growth in deposit
balances. Noninterest income increased by 21.3 percent from the same quarter of 2005, primarily
due to the acquisition of the corporate and institutional trust business of Wachovia Corporation,
core account growth and improved equity market conditions. The increase in total noninterest
expense was primarily due to the acquisition. The increase in the business line’s contribution in the
first quarter of 2006, as compared with the fourth quarter of 2005, was due to similar factors
causing favorable total net revenue growth (11.9 percent) partially offset by an increase in total
noninterest expense (22.8 percent).
Payment Services includes consumer and business credit cards, stored-value cards, debit cards,
corporate and purchasing card services, consumer lines of credit, ATM processing and merchant
processing. Payment Services contributed $226 million of the Company’s net income in the first
quarter of 2006, a 33.7 percent increase from the same period of 2005 and from the fourth quarter of
2005. The increase in Payment Services’ contribution in the first quarter of 2006 from the same
period of 2005 was the result of higher total net revenue (19.0 percent) and a $29 million favorable
variance in the provision for credit losses (32.6 percent), partially offset by an increase in total
noninterest expense (21.2 percent). The increase in total net revenue year-over-year was due to
growth in total noninterest income (21.4 percent) and net interest income (11.0 percent), reflecting
growth in higher yielding retail loan balances, offset by increases in noninterest-bearing corporate
card balances and rebates. All categories benefited from higher transaction volumes, rate changes
and business expansion initiatives. In addition, noninterest income benefited from a favorable
settlement within the merchant processing business. The growth in total noninterest expense year-
over-year primarily reflected new business initiatives, including costs associated with acquisitions
and other business growth initiatives. The $29 million decrease in the provision for credit losses
(MORE)
25. U.S. Bancorp Reports First Quarter 2006 Results
April 18, 2006
Page 25
was driven by lower net charge-offs, year-over-year, reflecting the near-term impact of changes in
bankruptcy legislation in the fourth quarter of 2005.
The increase in Payment Services’ contribution in the first quarter of 2006 from the fourth
quarter of 2005 was due to improved noninterest income (3.0 percent), lower provision for credit
losses (48.7 percent) driven by bankruptcy-related net charge-offs in fourth quarter 2005 and
favorable total noninterest expense (4.0 percent). The increase in noninterest income was primarily
due to recent merchant processing business acquisitions. The decrease in total noninterest expense
from the linked quarter, included a $19 million write-off of a prepaid rewards program associated
with a co-branding relationship in the fourth quarter of 2005, seasonally lower costs associated with
the prepaid gift card program and the timing of marketing programs.
Treasury and Corporate Support includes the Company’s investment portfolios, funding,
capital management and asset securitization activities, interest rate risk management, the net effect
of transfer pricing related to average balances and the residual aggregate of those expenses
associated with corporate activities that are managed on a consolidated basis. In addition, prior to
the adoption of SFAS 156, changes in MSR valuations due to interest rate changes were managed at
a corporate level and, as such, reported within this business unit. Operational expenses incurred by
Treasury and Corporate Support on behalf of the other business lines are allocated back to the
appropriate business unit, primarily based on customer transaction volume and account activities,
deposit balances and employee levels and are identified as net shared services expense. Treasury
and Corporate Support recorded net income of $66 million in the first quarter of 2006, compared
with net income of $126 million in the first quarter of 2005 and $106 million in the fourth quarter of
2005. The decrease in net income in the current quarter from the first quarter of 2005 was caused
by an unfavorable change in net interest income ($131 million) reflecting the impact of a flatter
yield curve and asset/liability management decisions during the year, including issuing higher cost
wholesale funding and repositioning of the Company’s balance sheet during 2005 for changes in the
interest rate environment, and higher compensation costs related to incentives and the adoption of
SFAS 123R. The adverse impact of net interest income and compensation expense was offset
somewhat by growth in noninterest income resulting from the gain on derivatives that did not
qualify as hedges. In addition, lower income tax expense, year-over-year, for this line of business
reflected the benefit of higher levels of tax-exempt income from securities and insurance products
as well as incremental tax credits from tax-advantaged investments. Net income in the first quarter
(MORE)
26. U.S. Bancorp Reports First Quarter 2006 Results
April 18, 2006
Page 26
of 2006 was lower than net income in the fourth quarter of 2005 due to lower net interest income
($38 million) driven by the flatter yield curve and funding earning asset growth with wholesale
funding, higher compensation costs and other noninterest expenses. Additionally, income tax
expense in the fourth quarter of 2005 included higher levels of tax credits due to the timing of
investments in tax-advantaged projects.
Additional schedules containing more detailed information about the Company’s business line
results are available on the web at usbank.com or by calling Investor Relations at 612-303-0781.
CHAIRMAN AND CHIEF EXECUTIVE OFFICER, JERRY A. GRUNDHOFER, AND
VICE CHAIRMAN AND CHIEF FINANCIAL OFFICER, DAVID M. MOFFETT, WILL
REVIEW THE FINANCIAL RESULTS IN A PRE-RECORDED CALL ON TUESDAY,
APRIL 18, 2006. The call will be available by telephone or on the internet. The pre-recorded
call will be available from approximately 7:00 a.m. (CDT) on Tuesday, April 18th through
Tuesday, April 25th at 11:00 p.m. (CDT). To access the recorded call, please dial 800-839-5484.
Participants calling from outside the United States, please call 402-220-1522. Find the
recorded call via the internet at usbank.com.
Minneapolis-based U.S. Bancorp (“USB”), with $210 billion in assets, is the 6th largest financial
holding company in the United States. The Company operates 2,430 banking offices and 4,941
ATMs, and provides a comprehensive line of banking, brokerage, insurance, investment, mortgage,
trust and payment services products to consumers, businesses and institutions. U.S. Bancorp is the
parent company of U.S. Bank. Visit U.S. Bancorp on the web at usbank.com.
(MORE)
27. U.S. Bancorp Reports First Quarter 2006 Results
April 18, 2006
Page 27
Forward-Looking Statements
The following information appears in accordance with the Private Securities Litigation Reform Act
of 1995:
This press release contains forward-looking statements about U.S. Bancorp. Statements that
are not historical or current facts, including statements about beliefs and expectations, are forward-
looking statements. These statements often include the words “may,” “could,” “would,” “should,”
“believes,” “expects,” “anticipates,” “estimates,” “intends,” “plans,” “targets,” “potentially,”
“probably,” “projects,” “outlook” or similar expressions. These forward-looking statements cover,
among other things, anticipated future revenue and expenses and the future plans and prospects of
the Company. Forward-looking statements involve inherent risks and uncertainties, and important
factors could cause actual results to differ materially from those anticipated, including the
following: (i) general economic or industry conditions could be less favorable than expected,
resulting in a deterioration in credit quality, a change in the allowance for credit losses, or a reduced
demand for credit or fee-based products and services; (ii) changes in the domestic interest rate
environment could further reduce net interest income; (iii) changes in the extensive laws,
regulations and policies governing financial services companies could alter the Company's business
environment or affect operations; (iv) competitive pressures could further intensify and affect the
Company's profitability, including as a result of continued industry consolidation, the increased
availability of financial services from non-banks, technological developments requiring additional
capital expenditure, or bank regulatory reform; (v) changes in consumer spending and savings
habits could adversely affect the Company’s results of operations. For other factors that cause
actual results to differ from expectations, refer to our most recent Annual Report on Form 10-K on
file with the SEC, for example the sections entitled “Risk Factors” and “Corporate Risk Profile.”
Forward-looking statements speak only as of the date they are made, and the Company undertakes
no obligation to update them in light of new information or future events.
###
(MORE)
28. U.S. Bancorp
Consolidated Statement of Income
Three Months Ended
(Dollars and Shares in Millions, Except Per Share Data) March 31,
(Unaudited) 2006 2005
Interest Income
Loans $2,332 $1,911
Loans held for sale 26 21
Investment securities 490 476
Other interest income 43 27
Total interest income 2,891 2,435
Interest Expense
Deposits 503 308
Short-term borrowings 270 112
Long-term debt 403 271
Total interest expense 1,176 691
Net interest income 1,715 1,744
Provision for credit losses 115 172
Net interest income after provision for credit losses 1,600 1,572
Noninterest Income
Credit and debit card revenue 182 154
Corporate payment products revenue 127 107
ATM processing services 59 47
Merchant processing services 213 178
Trust and investment management fees 297 247
Deposit service charges 232 210
Treasury management fees 107 107
Commercial products revenue 104 96
Mortgage banking revenue 24 102
Investment products fees and commissions 38 39
Securities gains (losses), net -- (59)
Other 231 154
Total noninterest income 1,614 1,382
Noninterest Expense
Compensation 633 567
Employee benefits 133 116
Net occupancy and equipment 165 154
Professional services 35 36
Marketing and business development 40 43
Technology and communications 117 106
Postage, printing and supplies 66 63
Other intangibles 85 71
Other 226 175
Total noninterest expense 1,500 1,331
Income before income taxes 1,714 1,623
Applicable income taxes 561 552
Net income $1,153 $1,071
Earnings per share $.64 $.58
Diluted earnings per share $.63 $.57
Dividends declared per share $.33 $.30
Average common shares outstanding 1,801 1,852
Average diluted common shares outstanding 1,826 1,880
Page 28
29. U.S. Bancorp
Consolidated Ending Balance Sheet
March 31, December 31, March 31,
(Dollars in Millions) 2006 2005 2005
Assets (Unaudited) (Unaudited)
Cash and due from banks $7,050 $8,004 $5,881
Investment securities
Held-to-maturity 110 109 121
Available-for-sale 39,286 39,659 42,982
Loans held for sale 2,053 1,686 1,635
Loans
Commercial 43,844 42,942 41,540
Commercial real estate 28,782 28,463 27,363
Residential mortgages 20,656 20,730 16,572
Retail 45,500 45,671 43,430
Total loans 138,782 137,806 128,905
Less allowance for loan losses (2,035) (2,041) (2,082)
Net loans 136,747 135,765 126,823
Premises and equipment 1,817 1,841 1,877
Goodwill 7,267 7,005 6,277
Other intangible assets 3,128 2,874 2,533
Other assets 12,449 12,522 10,337
Total assets $209,907 $209,465 $198,466
Liabilities and Shareholders' Equity
Deposits
Noninterest-bearing $29,384 $32,214 $28,880
Interest-bearing 69,995 70,024 71,751
Time deposits greater than $100,000 22,365 22,471 19,087
Total deposits 121,744 124,709 119,718
Short-term borrowings 20,651 20,200 14,273
Long-term debt 39,327 37,069 38,071
Other liabilities 7,929 7,401 7,196
Total liabilities 189,651 189,379 179,258
Shareholders' equity
Preferred stock 1,000 -- --
Common stock 20 20 20
Capital surplus 5,819 5,907 5,889
Retained earnings 19,568 19,001 17,276
Less treasury stock (5,394) (4,413) (3,590)
Other comprehensive income (757) (429) (387)
Total shareholders' equity 20,256 20,086 19,208
Total liabilities and shareholders' equity $209,907 $209,465 $198,466
Page 29
31. U.S. Bancorp
Income Statement Highlights
Financial Results and Ratios
Percent Change
Three Months Ended v. March 31, 2006
(Dollars and Shares in Millions, Except Per Share Data) March 31, December 31, March 31, December 31, March 31,
(Unaudited) 2006 2005 2005 2005 2005
Net interest income (taxable-equivalent basis) $1,725 $1,785 $1,751 (3.4) % (1.5) %
Noninterest income 1,614 1,546 1,382 4.4 16.8
Total net revenue 3,339 3,331 3,133 .2 6.6
Noninterest expense 1,500 1,464 1,331 2.5 12.7
Income before provision and income taxes 1,839 1,867 1,802 (1.5) 2.1
Provision for credit losses 115 205 172 (43.9) (33.1)
Income before income taxes 1,724 1,662 1,630 3.7 5.8
Taxable-equivalent adjustment 10 10 7 -- 42.9
Applicable income taxes 561 509 552 10.2 1.6
Net income $1,153 $1,143 $1,071 .9 7.7
Diluted earnings per share $.63 $.62 $.57 1.6 10.5
Revenue per diluted share (a) $1.83 $1.84 $1.70 (.5) 7.6
Financial Ratios
Net interest margin (b) 3.80 % 3.88 % 4.08 %
Interest yield on average loans (b) 6.79 6.57 6.08
Rate paid on interest-bearing liabilities 3.10 2.77 1.97
Return on average assets 2.23 2.18 2.21
Return on average common equity 23.3 22.6 21.9
Efficiency ratio (c) 44.9 43.3 41.7
Tangible efficiency ratio (d) 42.4 40.9 39.5
(a) Computed as the sum of net interest income on a taxable-equivalent basis and noninterest income excluding securities gains
(losses), net divided by average diluted common shares outstanding
(b) On a taxable-equivalent basis
(c) Computed as noninterest expense divided by the sum of net interest income on a taxable-equivalent basis and noninterest income
excluding securities gains (losses), net
(d) Computed as noninterest expense divided by the sum of net interest income on a taxable-equivalent basis and noninterest income
excluding securities gains (losses), net and intangible amortization
Page 31
32. U.S. Bancorp
Quarterly Consolidated Statement of Income
Three Months Ended
(Dollars and Shares in Millions, Except Per Share Data) March 31, December 31, September 30, June 30, March 31,
(Unaudited) 2006 2005 2005 2005 2005
Interest Income
Loans $2,332 $2,276 $2,167 $2,027 $1,911
Loans held for sale 26 31 30 24 21
Investment securities 490 500 492 486 476
Other interest income 43 26 29 28 27
Total interest income 2,891 2,833 2,718 2,565 2,435
Interest Expense
Deposits 503 476 414 361 308
Short-term borrowings 270 230 205 143 112
Long-term debt 403 352 317 307 271
Total interest expense 1,176 1,058 936 811 691
Net interest income 1,715 1,775 1,782 1,754 1,744
Provision for credit losses 115 205 145 144 172
Net interest income after provision for credit losses 1,600 1,570 1,637 1,610 1,572
Noninterest Income
Credit and debit card revenue 182 197 185 177 154
Corporate payment products revenue 127 126 135 120 107
ATM processing services 59 61 64 57 47
Merchant processing services 213 194 200 198 178
Trust and investment management fees 297 258 251 253 247
Deposit service charges 232 238 246 234 210
Treasury management fees 107 104 109 117 107
Commercial products revenue 104 101 103 100 96
Mortgage banking revenue 24 109 111 110 102
Investment products fees and commissions 38 37 37 39 39
Securities gains (losses), net -- (49) 1 1 (59)
Other 231 170 134 135 154
Total noninterest income 1,614 1,546 1,576 1,541 1,382
Noninterest Expense
Compensation 633 601 603 612 567
Employee benefits 133 101 106 108 116
Net occupancy and equipment 165 166 162 159 154
Professional services 35 47 44 39 36
Marketing and business development 40 64 61 67 43
Technology and communications 117 129 118 113 106
Postage, printing and supplies 66 65 64 63 63
Other intangibles 85 81 125 181 71
Debt prepayment -- -- -- 54 --
Other 226 210 190 199 175
Total noninterest expense 1,500 1,464 1,473 1,595 1,331
Income before income taxes 1,714 1,652 1,740 1,556 1,623
Applicable income taxes 561 509 586 435 552
Net income $1,153 $1,143 $1,154 $1,121 $1,071
Earnings per share $.64 $.63 $.63 $.61 $.58
Diluted earnings per share $.63 $.62 $.62 $.60 $.57
Dividends declared per share $.33 $.33 $.30 $.30 $.30
Average common shares outstanding 1,801 1,816 1,823 1,833 1,852
Average diluted common shares outstanding 1,826 1,841 1,849 1,857 1,880
Financial Ratios
Net interest margin (a) 3.80 % 3.88 % 3.95 % 3.99 % 4.08 %
Interest yield on average loans (a) 6.79 6.57 6.38 6.21 6.08
Rate paid on interest-bearing liabilities 3.10 2.77 2.49 2.23 1.97
Return on average assets 2.23 2.18 2.23 2.23 2.21
Return on average common equity 23.3 22.6 22.8 22.7 21.9
Efficiency ratio (b) 44.9 43.3 43.8 48.3 41.7
Tangible efficiency ratio (c) 42.4 40.9 40.0 42.8 39.5
(a) On a taxable-equivalent basis
(b) Computed as noninterest expense divided by the sum of net interest income on a taxable-equivalent basis and noninterest income
excluding securities gains (losses), net
(c) Computed as noninterest expense divided by the sum of net interest income on a taxable-equivalent basis and noninterest income
excluding securities gains (losses), net and intangible amortization
Page 32
33. U.S. Bancorp
Consolidated Ending Balance Sheet
March 31, December 31, September 30, June 30, March 31,
(Dollars in Millions) 2006 2005 2005 2005 2005
Assets (Unaudited) (Unaudited) (Unaudited) (Unaudited)
Cash and due from banks $7,050 $8,004 $6,918 $6,442 $5,881
Investment securities
Held-to-maturity 110 109 114 116 121
Available-for-sale 39,286 39,659 41,402 42,183 42,982
Loans held for sale 2,053 1,686 1,695 1,734 1,635
Loans
Commercial 43,844 42,942 43,237 43,180 41,540
Commercial real estate 28,782 28,463 28,521 27,743 27,363
Residential mortgages 20,656 20,730 19,469 17,966 16,572
Retail 45,500 45,671 45,400 44,555 43,430
Total loans 138,782 137,806 136,627 133,444 128,905
Less allowance for loan losses (2,035) (2,041) (2,055) (2,082) (2,082)
Net loans 136,747 135,765 134,572 131,362 126,823
Premises and equipment 1,817 1,841 1,850 1,864 1,877
Goodwill 7,267 7,005 6,372 6,372 6,277
Other intangible assets 3,128 2,874 2,586 2,584 2,533
Other assets 12,449 12,522 11,386 11,324 10,337
Total assets $209,907 $209,465 $206,895 $203,981 $198,466
Liabilities and Shareholders' Equity
Deposits
Noninterest-bearing $29,384 $32,214 $30,871 $33,401 $28,880
Interest-bearing 69,995 70,024 69,478 69,690 71,751
Time deposits greater than $100,000 22,365 22,471 20,446 18,732 19,087
Total deposits 121,744 124,709 120,795 121,823 119,718
Short-term borrowings 20,651 20,200 23,061 20,434 14,273
Long-term debt 39,327 37,069 36,257 34,788 38,071
Other liabilities 7,929 7,401 6,918 7,035 7,196
Total liabilities 189,651 189,379 187,031 184,080 179,258
Shareholders' equity
Preferred stock 1,000 -- -- -- --
Common stock 20 20 20 20 20
Capital surplus 5,819 5,907 5,913 5,903 5,889
Retained earnings 19,568 19,001 18,457 17,849 17,276
Less treasury stock (5,394) (4,413) (4,318) (3,984) (3,590)
Other comprehensive income (757) (429) (208) 113 (387)
Total shareholders' equity 20,256 20,086 19,864 19,901 19,208
Total liabilities and shareholders' equity $209,907 $209,465 $206,895 $203,981 $198,466
Page 33