1. UAL Investor Update: September 17, 2008
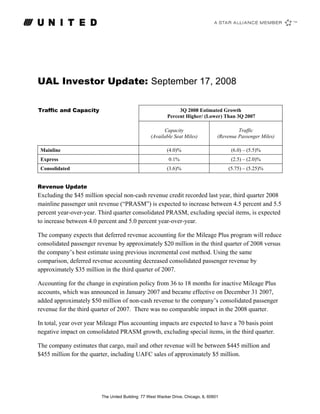
Traffic and Capacity 3Q 2008 Estimated Growth
Percent Higher/ (Lower) Than 3Q 2007
Capacity Traffic
(Available Seat Miles) (Revenue Passenger Miles)
(4.0)% (6.0) – (5.5)%
Mainline
0.1% (2.5) – (2.0)%
Express
(3.6)% (5.75) – (5.25)%
Consolidated
Revenue Update
Excluding the $45 million special non-cash revenue credit recorded last year, third quarter 2008
mainline passenger unit revenue (“PRASM”) is expected to increase between 4.5 percent and 5.5
percent year-over-year. Third quarter consolidated PRASM, excluding special items, is expected
to increase between 4.0 percent and 5.0 percent year-over-year.
The company expects that deferred revenue accounting for the Mileage Plus program will reduce
consolidated passenger revenue by approximately $20 million in the third quarter of 2008 versus
the company’s best estimate using previous incremental cost method. Using the same
comparison, deferred revenue accounting decreased consolidated passenger revenue by
approximately $35 million in the third quarter of 2007.
Accounting for the change in expiration policy from 36 to 18 months for inactive Mileage Plus
accounts, which was announced in January 2007 and became effective on December 31 2007,
added approximately $50 million of non-cash revenue to the company’s consolidated passenger
revenue for the third quarter of 2007. There was no comparable impact in the 2008 quarter.
In total, year over year Mileage Plus accounting impacts are expected to have a 70 basis point
negative impact on consolidated PRASM growth, excluding special items, in the third quarter.
The company estimates that cargo, mail and other revenue will be between $445 million and
$455 million for the quarter, including UAFC sales of approximately $5 million.
The United Building: 77 West Wacker Drive, Chicago, IL 60601
2. Revenue Outlook
The company expects year-over-year PRASM growth to accelerate in the fourth quarter of 2008,
driven by strong yield improvements from previously announced capacity reductions.
Unit Costs
The company estimates that mainline operating cost per available seat mile (“CASM”),
excluding fuel and the impact of certain primarily non-cash accounting charges incurred in the
third quarter as described below, will be up 1.0 percent to 1.5 percent for the third quarter of
2008 from the same period in 2007.
Fuel
Third quarter total estimated mainline fuel consumption is 563 million gallons.
Three Months
Estimated Mainline Fuel Price Ending Sept 30,
2008
Price Per Gallon
Mainline Fuel price including taxes and excluding impact of hedges $3.87
Mainline Fuel price including taxes and cash net gains on settled hedges* $3.81
Mainline Fuel price including taxes and impact of mark to market net losses on settled and
unsettled hedges* $4.44
* Includes only the hedge gains/losses that are accounted for in the fuel expense line
Fuel Hedge Position Third Quarter Hedge Positions as of September 15, 2008
Hedging Instrument % of Expected Average Price Average Price Average Price
Mainline where Payment where Protection where Protection
Consumption Obligations Begins is Capped
Begin
Collars 10% $100bbl $111bbl N/A
3-Way Collars 36% $107bbl $112bbl $128bbl
Total 46% N/A N/A N/A
The United Building: 77 West Wacker Drive, Chicago, IL 60601
3. Estimated Fuel Hedge Gains/Losses Three Months Ending Sept 30, 2008
(in millions)
Included In Fuel Included in Non- Total
Expense Operating
Expense
Unrealized mark to market gains/(losses) ($282) ($190) ($472)
Realized mark to market gains/(losses) ($37) ($35) ($72)
Total mark to market gains/(losses) ($319) ($225) ($544)
Cash gains/(losses) on settled contracts $36 ($28) $8
All open hedge positions at the end of the third quarter are estimated to have a total market value
of ($294) million based on the forward fuel curve as of September 15th. The actual value will be
determined based on market prices prevailing at the end of the quarter.
Non-Operating Income / Expense
The company estimates that non-operating expense will be between $90 million to $100 million
for the quarter, excluding the impact of any fuel hedging gains or losses that may be recorded in
the non-operating income / expense line. The company estimates that a $225 million fuel
hedging loss will be recorded in non-operating income / expense at the end of the quarter based
on September 15th forward curve prices. The actual gain or loss will be determined based on
market prices prevailing at the end of the quarter.
Impairment, Severance and Other Similar Charges
The company anticipates that it will record non-cash accounting adjustments in the third quarter
including adjustments to the intangible asset impairment estimates that were recorded in the
second quarter. The company also expects to record additional accounting adjustments
associated with its previously announced capacity reductions.
The United Building: 77 West Wacker Drive, Chicago, IL 60601
4. Liquidity
The company expects to end the quarter with unrestricted cash, cash equivalents and short-term
investments of $2.9 billion and $0.6 billion of restricted cash. These estimated amounts include
the impact of previously disclosed financing transactions, including the impacts of our recently
announced agreement-in-principle with Chase. These amounts also include an estimated $0.4
billion transferred from unrestricted cash to restricted cash associated with deposits made to fuel
hedge counterparties. The fuel hedge deposit estimates are based on September 15th forward
curve prices.
Tax Rate
The company expects to have an effective income tax rate of zero for the third quarter of 2008
and therefore will not record a tax benefit for the quarter.
Share Count
Shown below, for illustrative purposes only, are estimated basic and dilutive share counts for the
third quarter of 2008 and full year 2008. The calculation of share counts is based on a number of
assumptions including, but not limited to, an assumed market stock price, number of shares
outstanding and a statutory tax rate of 37%. Actual share counts may be different from those
shown below.
3Q 2008
Net Income (Estimated)
Basic Share Count Diluted Share Count Interest Add-back
(in millions) (in millions) (in millions)
Less than or equal to $0 127.1 127.1 $ -
$1million - $30 million 127.1 127.2 $ -
$31 million- $47 million 127.1 151.7 $ 5.2
Greater than $48 million 127.1 155.1 $ 6.3
Full Year 2008
Net Income (Estimated)
Basic Share Count Diluted Share Count Interest Add-back
(in millions) (in millions) (in millions)
Less than or equal to $3 million 125.6 125.6 $ -
$4 million -$120 million 125.6 126.0 $ -
$121 million 125.6 148.2 $ 20.6
$122 million- $190 million 125.6 151.9 $ 20.6
Greater than $191 million 125.6 155.3 $ 25.4
The United Building: 77 West Wacker Drive, Chicago, IL 60601
5. Safe Harbor Statement under the Private Securities Litigation Reform Act of 1995: Certain statements
included in this investor update are forward-looking and thus reflect the company’s current expectations and beliefs
with respect to certain current and future events and financial performance. Such forward-looking statements are
and will be subject to many risks and uncertainties relating to the operations and business environment of the
company that may cause actual results to differ materially from any future results expressed or implied in such
forward-looking statements. Factors that could significantly affect net earnings, revenues, expenses, costs, load
factor and capacity include, without limitation, the following: the company’s ability to comply with the terms of its
credit facility; the costs and availability of financing; the company’s ability to execute its business plan; the
company’s ability to realize benefits from its resource optimization efforts and cost reduction initiatives; the
company’s ability to use its net operating losses; the company’s ability to attract, motivate and/or retain key
employees; the company’s ability to attract and retain customers; demand for transportation in the markets in which
the company operates; general economic conditions (including interest rates, foreign currency exchange rates, crude
oil prices and energy refining capacity in relevant markets); the effects of any hostilities or act of war or any
terrorist attack; the ability of other air carriers with whom the company has alliances or partnerships to provide the
services contemplated by the respective arrangements with such carriers; the costs and availability of aircraft
insurance; the costs of jet fuel; our ability to cost-effectively hedge against increases in the price of jet fuel; the costs
associated with security measures and practices; labor costs; industry consolidation; competitive pressures on
pricing and on demand; capacity decisions of United and/or our competitors; U.S. or foreign governmental
legislation, regulation and other actions, including open skies agreements; the ability of the company to maintain
satisfactory labor relations and our ability to avoid any disruptions to operations due to any potential actions by our
labor groups; weather conditions; and other risks and uncertainties set forth from time to time in UAL’s reports to
the United States Securities and Exchange Commission. Consequently, the forward-looking statements should not
be regarded as representations or warranties by the company that such matters will be realized. The company
disclaims any intent or obligation to update or revise any of the forward-looking statements, whether in response to
new information, unforeseen events, changed circumstances or otherwise.
The United Building: 77 West Wacker Drive, Chicago, IL 60601
6. Non-GAAP To GAAP Reconciliations
Pursuant to SEC Regulation G, the Company has included the following reconciliation of
reported non-GAAP financial measures to comparable financial measures reported on a GAAP
basis. The Company believes that excluding fuel costs from certain measures is useful to
investors because it provides an additional measure of management's performance excluding the
effects of a significant cost item over which management has limited influence.
Three Months Ending Sept 30,
Operating expense per ASM - CASM Year-over-Year
2008 Estimate 2007
(cents) % Change
Low High Actual
Low High
Mainline operating expense 14.92 14.96 11.28 32.3% 32.6%
Less: fuel expense & cost of third party
(7.13) (7.13) (3.63) 96.4% 96.4%
sales – UAFC
Mainline excluding fuel & UAFC 7.79 7.83 7.65 1.8% 2.3%
Add: income from special items - - 0.06 (100)% (100)%
Mainline excluding fuel, UAFC and
7.83 7.71
7.79 1.0% 1.5%
special items
Three Months Ending Sept 30,
Mainline Passenger Revenue per ASM Year-over-Year
2008 Estimate 2007
- PRASM (cents) % Change
Low High Actual
Low High
Mainline passenger revenue 12.08 12.20 11.67 3.5% 4.5%
Less: special operating credit - - (0.10) (100)% (100)%
Mainline passenger revenue excluding
12.08 12.20 11.57 4.5% 5.5%
special items
Less: Mileage Plus Impacts 0.05 0.05 (0.04) - -
Mainline passenger revenue excluding
12.25 11.53
12.13 5.2% 6.2%
special items and Mileage Plus
The United Building: 77 West Wacker Drive, Chicago, IL 60601
7. Three Months Ending Sept 30,
Consolidated Passenger Revenue per Year-over-Year
2008 Estimate 2007
ASM - PRASM (cents) % Change
Low High Actual
Low High
Consolidated passenger revenue 12.88 13.00 12.49 3.1% 4.1%
Less: special operating credit - - (0.11) (100)% (100)%
Consolidated passenger revenue
12.88 13.00 12.38 4.0% 5.0%
excluding special items
Less: Mileage Plus Impacts 0.05 0.05 (0.03) - -
Consolidated passenger revenue
13.05 12.35
12.93 4.7% 5.7%
excluding special items and Mileage Plus
The United Building: 77 West Wacker Drive, Chicago, IL 60601