
Empfohlen
Weitere ähnliche Inhalte
Was ist angesagt?
Ähnlich wie AMR 1998 Annual Report Highlights
Ähnlich wie AMR 1998 Annual Report Highlights (20)
Mehr von finance11
Mehr von finance11 (20)
Kürzlich hochgeladen
Kürzlich hochgeladen (20)
AMR 1998 Annual Report Highlights
- 1. AMR CORPORATION 1998 ANNUAL REPORT
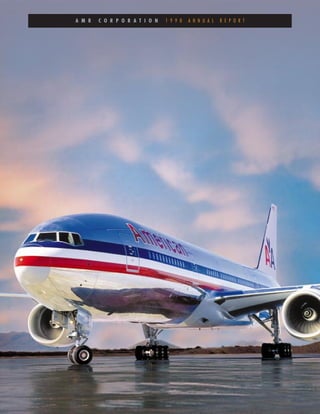
- 2. AMR Corporation is a worldwide leader in scheduled air transportation, in the development and application of information technology for aviation, travel and tourism, and in a wide range of other aviation-related activities. CONTENTS Consolidated Highlights 1 Letter from the Chairman 2 1998 Quarterly Highlights 6 Shareholder Essay 8 Customer Essay 12 Employee Essay 16 The Sabre Group Essay 20 Financial Information 23 Eleven-Year Comparative Summary 58 Board of Directors and AMR Officers 60 Management–Divisions and Subsidiaries 61 Corporate Information 62 COVER American Airlines’ new Boeing 777
- 3. C O N S O L I D AT E D H I G H L I G H T S (Dollars in millions, except per share amounts) Percent Year Ended December 31, 1998 1997 Change Total operating revenues $ 19,205 $ 18,184 5.6 Total operating expenses $ 16,867 $ 16,277 3.6 Operating income $ 2,338 $ 1,907 22.6 Operating margin 12.2% 10.5% 1.7 pts. Income from continuing operations $ 1,306 $ 973 34.2 Net earnings $ 1,314 $ 985 33.4 Average shares of common stock outstanding (in thousands) 168,750 178,304 (5.4) Earnings per common share (basic) From continuing operations $ 7.73 $ 5.45 41.8 Net earnings $ 7.78 $ 5.52 40.9 Earnings per common share (diluted) From continuing operations $ 7.48 $ 5.32 40.6 Net earnings $ 7.52 $ 5.39 39.5 Return on equity 20.4% 16.6% 3.8 pts. Ratio of current assets to current liabilities at year-end 0.86 0.89 (3.4) 1 Average equivalent number of employees 116,300 113,900 2.1 Approximate number of common shareholders of record at year-end 14,000 14,300 (2.1) AMR EMPLOYEE PROFILE Increase/(Decrease) Increase/(Decrease) Increase/(Decrease) From From From Average Equivalent Headcount 1998 Previous Year 1997 Previous Year 1996 Previous Year Management/Specialist 19,300 5.5% 18,300 7.0% 17,100 5.6% Agent/Support Staff 32,600 1.6% 32,100 (1.2)% 32,500 2.2% Pilots* 10,900 (0.9)% 11,000 (1.8)% 11,200 (1.8)% Attendants* Flight 19,000 3.3% 18,400 (0.5)% 18,500 (3.1)% Mechanics, Ramp Service, Other Ground Personnel* 34,500 1.2% 34,100 6.6% 32,000 1.6% Total 116,300 2.1% 113,900 2.3% 111,300 1.2% *The majority are represented by a labor union. Following is a list of the status of major existing contracts: Allied Pilots Association. Contract amendable August 31, 2001. Association of Professional Flight Attendants. Contract became amendable November 1, 1998. Flight Engineers International Association. Contract amendable August 31, 2001. Transport Workers Union. Contract amendable March 1, 2001. AMR is an equal opportunity employer.
- 4. L F T C ETTER ROM HE HAIRMAN To our Stockholders, Customers and Employees: I am pleased to report that 1998 was a very good likely familiar with the Transition Plan — the AMR year for AMR Corporation. From a financial strategy launched in the early 1990s, while the airline perspective, the company’s net earnings of $1.3 industry was in the midst of a depression. The Transition billion were by far its best ever, a result which Plan had three main tenets. The first tenet was to reflects the commitment of every member of the AMR strengthen our airline businesses — American Airlines family to our customers and to our shareholders. and our regional affiliate American Eagle — wherever we Our record financial performance was also a func- could do so profitably. The second part of the plan was tion, in part, of a very favorable economic environment to withdraw from airline markets where our financial enjoyed by AMR’s largest business, American Airlines. performance was unsatisfactory and where we did not 2 The continued health of the U.S. economy resulted in believe we could compete effectively. And the third strong demand for air travel, in turn enabling American tenet was to invest in and grow our profitable and most other carriers to fill their aircraft without non-airline businesses. dramatic fare discounting. Full aircraft and stable ticket The Transition Plan had some very positive results. prices led to a very good year on the revenue side of By focusing on our areas of strength, AMR was able to the ledger, while lower fuel prices helped offset cost survive some very difficult years and become profitable increases in other areas. again. Another very important result was that during The improved economic fundamentals of the this period, we developed a stable of successful non- airline industry have given us greater confidence airline businesses. in the future success of our largest business, and that While the Transition Plan served AMR well, by confidence is reflected in a new strategic plan we 1998, the time had come for a new strategic plan. The launched in 1998. plan we have put in place has four key objectives. Long-time observers of our company are The first objective is to invest in and grow
- 5. American and American Eagle — consistent with market information technology solutions business while sustain- conditions — to preserve and enhance our leadership in ing its leadership in electronic travel distribution. For the U.S. airline industry. To that end, we have committed the year, Sabre’s revenues increased by 29 percent to billions of investment dollars for the new jet aircraft, $2.3 billion, and its pre-tax margin was 16.1 percent. facilities, technology and training we think we will need Since its 1996 initial public offering, The Sabre Group’s to keep American and American Eagle at the industry revenues have grown by more than 40 percent, and as forefront. However, while our capital commitments are it has grown, American Airlines — Sabre’s largest significant, the flip side of our plan’s first objective is that customer — has benefited from the group’s new-found we will return to shareholders any capital in excess of market efficiencies. 3 what we think is necessary for prudent growth. Our fourth major objective is to create a corporate Our second objective is to offer our customers the culture within AMR that involves and excites every world’s most comprehensive and powerful airline employee in every one of our businesses. Involving and network through a combination of the industry’s exciting every member of the AMR team is fundamentally strongest domestic route system, the premier regional important to providing outstanding customer service carrier, increased international flying, and the broadest — which, in turn, is critically important to delivering — and best-executed — set of airline alliances. top-notch financial performance. The third objective of our plan is to make AMR’s new strategic plan is sharply focused on The Sabre Group — which is the largest of AMR’s non- our core airline and technology businesses. In keeping airline businesses — the world’s leading provider of with that focus, we decided, in the fall of 1998, to sell information technology for the travel and transportation three of the company’s smaller, less-strategically impor- industry. In its second full year as a publicly traded tant businesses: AMR Services, AMR Combs and company, Sabre attracted many new clients for its TeleService Resources. These three businesses — each
- 6. of which we expect will have been sold by the end of the take care of each other. first quarter in 1999 — are all viable companies with Doing our jobs well means constantly trying to good prospects for success, but their activities, in our balance the needs of all three constituencies, and it is a view, were non-strategic, or not fundamental to meeting real challenge. But I hope you will find, as you read the our four key objectives. following essays, that we made significant progress in When it comes to setting and meeting objectives 1998 with regard to all three groups. for our company, there are three groups of people we For our shareholders, we delivered, among other keep in the front of our minds: AMR’s customers, things, record earnings, a two-for-one stock split, and an employees, and of course, our shareholders. Clearly, as aggressive share repurchase program. For our customers, 4 the company’s managers, it is our duty to reward our we improved the quality of our products by strengthen- shareholders by producing the best financial results pos- ing our network, upgrading our fleet and offering a sible. However, in any service business, the best way to myriad of other enhancements. And for our employees, ensure a satisfactory level of profitability is to attract the we distributed an industry-record profit-sharing fund largest possible share of the market — and in particular, and forged a renewed commitment to building the the higher paying customers who demand outstanding industry’s best corporate culture. service. Thus, to take care of the shareholders, we must In the pages to come, you will read about these first take care of our customers. initiatives and a lot more, and as you do so, I hope it At the same time, the quality of any airline’s becomes clear that the creation, enhancement and product is greatly dependent on the performance of its preservation of value for our shareholders, customers people. We have to make sure our people are focused, and employees is the impetus behind everything we do motivated, enthusiastic and enjoy their work. Thus, in — whether it’s buying back stock, building the industry’s order to take excellent care of our customers, we must premier airline network, investing in new aircraft and
- 7. technology, or tending to the spirit and motivation of transform American into one of the world’s leading our people. airlines. We owe him many thanks, and we wish Bob Upon review of this annual report, I hope you will and his wife Jan a retirement filled with smooth sailing share my assessment that 1998 was a very good year for and good fortune. our company. For our part, all of us at AMR are working hard to All of AMR’s successes are the result of a team build on our 1998 accomplishments, to make each of effort, and in closing this letter, I’d like to recognize two our businesses the leader in its field, and to make 1999 men who have helped lead the AMR team for many and each subsequent year even better. years. Charles T. “Chick” Fisher, III, a member of the 5 AMR Board of Directors for more than three decades, has Sincerely, decided not to stand for re-election in 1999. Chick con- tinued the legacy begun by his father, Charles T. “Chuck” Fisher, Jr., who was an AMR board member himself for more than a decade. I want to personally thank Chick for the important role he has played in AMR’s success. Finally, I would be remiss if I did not recognize the enormous contributions of Robert L. Crandall, my predecessor as Chairman and Chief Executive Officer of AMR, who retired in May of 1998. During his 25 years with American, Bob led our company through an era that can safely be characterized as the most difficult in the history of the airline industry. His leadership helped
- 8. 1998 Q H UARTERLY IGHLIGHTS FIRST QUARTER • Boeing 737-800 orders increase to 100 aircraft. • American Eagle inaugurates regional jet service. • American announces extensive service additions, includ- • New international service begins between Chicago ing new flights between Boston and San Diego, San O’Hare-Tokyo; Chicago O’Hare-Monterrey, Mexico; and Francisco and San Jose; Dallas/Fort Worth-Manchester, Dallas/Fort Worth-Panama City, Panama. U.K.; and Newark-London Heathrow. • AMR earns a record $409 million in the second quarter. • American reveals plans to increase the first class section from 14 to 20 seats on more than 100 Super 80 aircraft. THIRD QUARTER • American and Japan Airlines announce a broad codeshare program. • American joins with British Airways, Canadian Airlines, • AA Cargo reports record revenue ton miles for the Cathay Pacific and Qantas to announce the oneworld 6 first quarter in Latin American markets. global airline alliance. • The Sabre Group wins a 10-year, $165-million informa- • AMR announces plans to sell AMR Services, AMR Combs, tion technology outsourcing agreement with Gulf Air. and TeleService Resources subsidiaries. • Commuter World names American Eagle “Regional Airline • Second $500-million stock repurchase program completed. of the Year.” American Eagle announces the • American welcomes Finnair into codeshare network; transition from four airlines to a single carrier. expands codeshares with Grupo Taca and Iberia; and • AMR earns $290 million in the first quarter. begins codesharing with Asiana and China Eastern. • Boeing 777 orders increase to 34 aircraft. SECOND QUARTER • American Eagle orders 75 new 37-seat ERJ-135 jets. • Donald J. Carty succeeds Robert L. Crandall as • AMR earns a record $433 million in the third quarter. AMR’s chairman and CEO. FOURTH QUARTER • $500-million stock repurchase program and 2-for-1 stock split completed. • American completes the tender offer for Reno Air and • American and US Airways announce an innovative American Eagle announces it will buy Business Express. marketing alliance, linking frequent flyer programs and • AMR begins another $500-million stock repurchase. offering reciprocal access to airport clubs.
- 9. • US Airways’ migration to Sabre systems is completed, year with defibrillators AA is placing aboard entire fleet. part of a 25-year, multi-billion dollar arrangement. • In 1998, American is first in on-time dependability among • As part of an $11.5-million service initiative for Latin the big-six U.S. carriers. customers, American Airlines Publishing announces • Travelocity enrolls four millionth member and is rated the Nexos – a new Spanish and Portuguese language Internet’s “Best Travel Site” by the People’s Voice Award. in-flight magazine. • American Eagle adds 17th regional jet destination. At • AMR completes Aerolineas Argentinas equity transaction. San Juan, it opens new $6-million gate facility and wins • American begins Dallas/Fort Worth-Osaka service. FAA over-water flight certification. • American Eagle’s regional jet fleet grows to 20 aircraft. • AMR earns $182 million in fourth quarter; 1998 earnings • Flight attendants save the life of the third passenger this of $1.3 billion are an all-time record. 7 AMR senior executives, from left to right: Daniel P. Garton, Senior Vice President, Customer Services-American Airlines; Gerard J. Arpey, Senior Vice President and Chief Financial Officer-AMR Corp., Senior Vice President, Finance and Planning and Chief Financial Officer-American Airlines; David L. Kruse, Senior Vice President, Maintenance and Engineering-American Airlines; Thomas J. Kiernan, Senior Vice President, Human Resources-American Airlines; Robert W. Baker, Executive Vice President, Operations-American Airlines; Peter M. Bowler, President-AMR Eagle Holding Corp.; Peter J. Dolara, Senior Vice President, Miami, Caribbean and Latin America-American Airlines; Michael W. Gunn, Senior Vice President, Marketing-American Airlines; Anne H. McNamara, Senior Vice President and General Counsel-AMR Corp. and American Airlines; Michael J. Durham, President and Chief Executive Officer-The Sabre Group Holdings, Inc.
- 10. 8 Record earnings, share repurchases, a stock split, and debt reduction enhanced AMR shareholder value in 1998. IN 1998, AMR SHAREHOLDERS rewarded for their investment with the best financial perfor- WERE mance in the company’s history. AMR’s after tax earnings of $1.3 billion were a record and a 33 percent improvement over 1997. Earnings per share, at $7.52 (diluted), was up approximately 40 percent, reflecting the dual benefits of improved earnings and an aggressive share repurchase program. The biggest driver of AMR’s 1998 financial success was the strong performance of American Airlines. For the year, American’s passenger traffic was up 1.8 percent, and the airline’s load factor, or percentage of total seats filled, was — at 70.2 percent — up 0.7 points versus the prior year. A stable pricing environment helped American increase its yield — or the average amount collected per passenger mile — by 0.9 percent.
- 11. 9 In addition to the strong revenue performance, American benefited on the cost side of the ledger from the low price of fuel. After labor, fuel is the airline’s largest expense, and lower prices shaved more than $300 million off the company’s fuel bill for the year. AMR’s regional carrier, American Eagle, performed well in 1998. Driven in part by the introduction of regional jet service in several key markets, passenger traffic increased by 9.2 percent, and generated revenues 10.2 percent higher than 1997. The airline business has traditionally been a very cyclical business, highly impacted by the economies of the markets it serves. As this annual report goes to press, it is unclear whether the U.S. economy in 1999 will grow at a pace comparable to 1997 and 1998. However, while American’s fortunes in 1999 will be tied
- 12. somewhat to the fate of all the economies it serves, recent changes in the airline industry argue for less volatility in our financial performance than has historically been the case. The airline industry remains intensely competitive. However, each of the major carriers today has a route system well adjusted to its individual strengths. As a result, the major carriers have — for the most part — focused their attention and resources on their major hubs and on other markets where they’ve done well historically. A second factor that argues for more stability is the fact that we have fewer carriers today in the kind of financial disarray that we saw in the 1980s and early 1990s. We are seeing fewer carriers in, or on the verge of, bankruptcy. Thus, carriers are operating with a more long-term focus. It is also worth noting that while the industry has a substantial number of new aircraft on the way, there have not been excessive commitments for new capacity. American and other carriers have incorporated a great deal of flexibility into their aircraft deals. The industry has a lot of older, fully depreciated aircraft that may become retirement candidates should the growth in the demand for air travel slow. In the fall of 1998, American announced that it will retire eight DC10s and two 727s in 1999, several years earlier than originally planned. American’s planned systemwide capacity growth for 1999 was pared 10 down from approximately six percent to roughly four percent. The rationale behind reducing American’s planned capacity growth is to avoid a situation in which too many seats are chasing too few customers, as was the case throughout the airline industry in the early 1990s. A nice side benefit of the 10 early aircraft retirements will be approximately $40 million worth of maintenance savings. American has showed, and continues to show, great restraint in the addition of capacity. By the end of 1999, our annual growth will have averaged just one percent for the four-year period 1995 to 1999. Our domestic capacity will have grown even more slowly at 0.2 percent. However, as we head into 1999, the improved economic fundamentals of the airline industry have given us the confidence to invest in the new aircraft, new facilities, and other investments necessary to meet the high expectations of our customers. We think our limited growth plans for 1999 and beyond are both prudent and necessary. But we are fortunate that — should demand fail to keep up with supply — we have the ability to adjust our fleet plans
- 13. much more quickly than we could in years past. To illustrate, even with the retirements previously mentioned, 11 percent of American’s 1999 capacity will be in DC10s and 727s, and should demand slow, some of those aircraft could be retired earlier than originally planned. AMR is making the investments necessary to responsibly and profitably grow both its airline and non-airline businesses in order to create and enhance shareholder value. Another way the company has enhanced value for shareholders in recent months has been by shoring up its capital structure. Following the completion of American’s pilot contract in 1997, the company repurchased 11.5 million shares of AMR common stock to offset any dilution resulting from the options included in that agreement. This was followed by the repurchase of an additional $500 million worth of AMR common stock between July 1997 and June 1998. In July 1998, 11 the company launched an additional $500 million repurchase plan, which was completed in early September, and a month later initiated a third $500 million stock repurchase, completing roughly $100 million of it by year-end. Also, in June, AMR’s stock split two-for-one, bringing the price of AMR more in line with other airline stocks and stocks in general, making it easier for small investors to participate in the company’s success while broadening our shareholder base and increasing our stock’s liquidity. Much of the company’s strong cash flow in recent years has been devoted to the strengthening of AMR’s balance sheet. Since 1995, the company has paid off more than $5 billion in debt and lease obligations. AMR’s debt to total capitalization ratio — which as recently as 1995 was at 83 percent — was, at the end of 1998, down to 61 percent. And at year-end 1998, AMR had cash and short-term investments of $2.1 billion. Share repurchases, stock splits and debt reductions are some of the ways we have sought to deliver value to our shareholders. But the most important thing we can do to create and protect shareholder value is to do an outstanding job serving our customers. The following essay describes some of our 1998 efforts to do just that.
- 14. 12 American Eagle’s new ERJ-145 regional jets are attracting new customers to the American Airlines network. AS , our ability to produce the financial performance our sharehold- IN ANY COMPETITIVE BUSINESS ers expect will always be dependent upon our ability to meet the demands of our customers. An important element of providing quality airline service is having world-class aircraft, and both American and American Eagle are in the process of upgrading their fleets. In 1998, American received the first 10 planes of the innovative 20-year agreement reached with Boeing in 1997. In 1999, American will add another 45 new aircraft, while simultaneously retiring 16 older aircraft, for a net fleet addition of 29 jets. American Eagle entered a new era in 1998 with its first regional jet service. American Eagle received 20 of these faster and smoother aircraft in 1998 and retired two of its turboprops. The carrier will deploy an additional
- 15. 13 31 regional jets in 1999 and continue turboprop retirement. In addition to a top-notch fleet, providing the industry’s best service means having a network that best matches the demands of our airline customers. Despite the overall strength of American and American Eagle’s domestic networks, they have been weaker in the West Coast and upper Northeast mar- kets. To rectify this, American announced in November its decision to purchase Reno Air, the West Coast carrier with which it has had a marketing relationship since 1993. Reno’s integration into American Airlines will strengthen the network on the West Coast and provide connecting traffic to our east-west and transcontinental flights. In December, American Eagle announced it would purchase Business Express to extend our reach into a number of new markets in the northeastern United States.
- 16. On the international front, American has a three-pronged strategy. In Latin America, American is leveraging its powerful franchise by enhancing Miami as the premier gateway to that region, and establishing Dallas/Fort Worth and New York as alternative gateways. In Europe, American has strengthened its overall network by capitalizing on Adjustable Headrest its strength to the United Kingdom. Today, more than 40 percent of American’s Personal Reading European service begins or ends at London Heathrow and Light Telephone Satellite Communications about two-thirds is in or out of the United Kingdom. Service additions to the U.K. in 1998 included Newark to London Heathrow and DFW to Manchester. In Asia, American has established a greater presence by securing new access to Japan, gaining the right to fly to Tokyo from Chicago, Boston and New York, and to Osaka from DFW. The Boston and New York services have been deferred due to a lack of avail- Power Ports able take-off and landing slots in Tokyo, while 14 the Chicago-Tokyo service began in May and New business class seats on international flights DFW-Osaka was launched in December. We have also broadened our services by forming numerous alliances to offer our customers access to thousands of markets where adding our own service is either impossible or commercially unattractive. Alliances are a capital-efficient way to offer the most service to the most places possible. Our alliance includes relationships with 16 airlines around the world, and the biggest and most important element is the oneworld alliance announced in the fall of 1998. The oneworld alliance, which was implemented in early 1999, links our network and frequent flyer program with those of British Airways, Canadian Airlines, Cathay Pacific and Qantas. Finnair and Iberia are expected to introduce oneworld benefits during the second half of 1999. The oneworld alliance offers service to approximately 600 cities in 138 countries on more than 1,500 aircraft. Closer to home, in April of 1998, American formed a domestic marketing agreement with US Airways, which includes a combined frequent flyer program and reciprocal access to each carrier’s clubs and lounges. And in December, American signed a letter of intent to enter into a marketing relationship with Alaska Air Group, the holding company for Alaska Airlines and its regional affiliate, Horizon Air.
- 17. Because there is more to good service than just network breadth, American and American Eagle are also focused on improving the basics of customer service. In 1998, American placed first in on-time dependability among the big six U.S. carriers. We also introduced ways to make the travel experience of our frequent busi- ness customers easier and upgraded our in-flight product, particularly in international markets. We also con- tinued to explore new ways to cater to ever-more technologically savvy customers. Service differentiation for premium customers has been a key strategy for American since it introduced the AAdvantage program in 1981. Our efforts to attract the high frequency business traveler continued in 1998 with the introduction of a new top-tier level in the AAdvantage program called Executive Platinum and the expansion of the first class cabin from 14 to 20 seats on more than 100 Super 80 aircraft deployed in key business markets. Facility enhancements included the introduction of Platinum Service Centers and of new Flagship Lounges for our international customers at several airports. American also opened a new Admirals Club in Tokyo in 1998 and has plans to expand or renovate several Clubs in 1999. American is also in the midst of the largest and most dramatic aircraft interior refurbishment program in its history. In the next few years, more than 55 percent of the seats on American’s current fleet will be replaced with next-generation “slimline” seats. Many of those seats not replaced will be upgraded with power ports for 15 personal computers, adjustable leather headrests, and personal reading lights. The refurbishment will also include new carpet, curtains, bulkhead tapestries and sidewalls. An increasingly important element of a top-quality airline product is ubiquitous availability. As a consequence, American is focused on making its AA.com Internet web site the best in the airline industry. In June, we relaunched the site, giving it a new look and making it easier to navigate. Rated the most popular airline site on the World Wide Web, AA.com at the end of 1998 was receiving more than 35,000 fare requests daily with more than one million customers looking at six million computer-generated page screens per week. In addition, American’s NetSAAver fares are transmitted via electronic mail to 2.1 million people twice a week, making this e-mail list the largest on the Internet. New aircraft, the industry’s broadest network, modern technology and enhanced facilities are all very important to sustaining American and American Eagle’s strong brand images and reputations for providing high-quality customer service. But none of our initiatives could succeed without the dedication and outstand- ing performance of our people, who are the subject of the following essay.
- 18. 16 The AMR team is a global one, with over 116,300 employees in 52 countries. THE some of our efforts to ensure that American and American Eagle PRECEDING E S S AY DESCRIBED are providing the kind of service that sustains our strong brand image and the loyalty of our customers. While each of the initiatives described is important, the truest reflection of the quality, value and integrity of the American and American Eagle brands has always been our people. We believe there is an unbreakable chain of cause and effect that links how our employees behave, to how our customers respond, to the company’s profitability. And how our employees behave is closely tied to the trust, respect and appreciation imbedded in the company’s culture. In short, if we are successful in making our company the best possible place to work, that will have an enormously positive impact on customer service, which will, in turn,
- 19. 17 produce greater customer loyalty and improved profitability. Obviously, compensation is an important element of employee satisfaction for any company. In 1998, American distributed more than $250 million in profit-sharing and incentive awards to its employees, an industry record. Those awards were based on the airline’s 1997 perfor- mance. In 1999, profit-sharing and incentive awards, based on 1998 earnings, topped $300 million. We realize it takes more than money to create a motivated and enthusiastic workforce, determined to do its very best for the company’s customers and shareholders. Recognition for a job well done is also important, and American has a myriad of award programs designed to
- 20. recognize and thank the “best of the best.” Communicating with employees is also critical to ensuring that every member of the team understands and is on board with the company’s plans. Formal communication tools include a daily electronic news bulletin sent to employees, a weekly hotline recorded by Chairman Don Carty, a monthly newspaper mailed to employees’ homes and a year-round series of Employee Conferences held at locations throughout the American network. Because one-directional management-to-employee commu- nication is not enough, the company has a variety of programs designed to ensure that employees’ voices are heard. In recent years, we have established a number of employee councils and other organizations intended to give them a voice in the decisions impacting our company. With more than 116,300 employees around the world, our employees are certainly a diverse group, becoming more so every day. In 1995, AMR estab- lished a Diversity Advisory Council – comprised of employees representing various racial, ethnic, cultural, 18 religious and social backgrounds – to bring the viewpoints of diverse employee groups to bear on company business issues. The Council, whose motto is “Respecting Differences,” meets regularly with executives at the highest levels of the company. Our employees bring a wealth of knowledge and an abundance of good ideas to their jobs. IdeAAs in Action, our widely acclaimed employee suggestion program, was created 12 years ago to tap into those ideas, the rewards of which are shared by our customers, shareholders and the employees themselves. Since the program’s inception, employee ideas have generated more than $530 million in benefit to the company, and the employees behind the ideas have received more than $75 million in rewards. As is the case in most companies, our employees face daunting challenges both on the job and at home. In August, American introduced LifeBalance, an around-the-clock, 365-day service operated by an outside company to help employees balance the
- 21. demands of work and the stresses of their personal lives. AMR employees can use the program for all kinds of help, from locating quality child care to learning how to manage their finances to dealing with a landlord. LifeBalance complements the comprehensive medical benefits and numerous employee wellness initiatives launched in recent years. In September, a new Employee Health Clinic was opened at Dallas/Fort Worth International Airport, site of American’s biggest hub. At the clinic, American employees can receive on-the- spot treatment for injuries and illnesses, free of charge and on a completely confidential basis. 19 American Airlines, American Eagle and the other businesses within AMR all strive to be industry leaders in every aspect of their business, including employee relations. And while formal programs like those mentioned above are important, creating a winning culture that excites and involves every member of the team depends even more on the day-to-day interaction employees have with their co-workers and managers. To meet our goals, we believe that fostering positive employee relations and creating the industry’s best corporate culture – a culture based on a commitment to customer service, mutual respect and appreciation, productivity, personal and professional growth, two-way communication and fun – must be among our top strategic priorities. Being a preferred employer goes hand in hand with being a preferred airline for our customers, as well as a preferred and rewarding investment for our shareholders.
- 22. 20 Today, more than 40,000 travel agencies in over 100 countries subscribe to the Sabre system. F O R T H E S A B R E G R O U P (TSG), the largest of AMR’s non-airline enterprises, 1998 was a year of continued leadership in its electronic travel distribution business and of robust growth in its other principal business, information technology solutions. Since its legal separation from American Airlines, and an initial public offering of just less than 20 percent in 1996, The Sabre Group’s revenues have grown by more than 40 percent. In 1998, TSG had pre-tax earnings of $371 million and an operating margin of 15.2 percent. Electronic Travel Distribution The Sabre Group is the world leader in electronic travel distribution. The Sabre computer reservation system handles more airline bookings than any other system. The Sabre Group’s electronic travel distribution
- 23. 21 customers, including travel agents, corporations and on-line consumers, can use the Sabre system to make reservations with more than 420 airlines, more than 50 car rental companies and nearly 40,000 hotel properties worldwide. As of the end of 1998, over 40,000 travel agencies in more than 100 coun- tries subscribed to the Sabre system. The explosive growth of Internet commerce has brought challenges and opportunities to The Sabre Group. As one of the pioneers in electronic commerce, The Sabre Group is in the forefront of exploring and realizing the potential of the Internet to travel distribution. Travelocity, with its easy-to-use graphical application, provides consumers with travel and destination information from suppliers around the world. Launched in 1996, Travelocity had registered more than four
- 24. million members by the end of 1998. It was rated the Best Travel Site by the People’s Voice Award and recorded its first $8-million sales week in December, one of many sales records that were set during the year only to be broken shortly after- ward. With the capabilities of the Sabre system behind it, Travelocity provides reservation capabilities for more travel providers than any other Internet site. Another important and successful Internet-based product is Sabre Business Travel Solutions. This suite of applications enables corporate travel managers to give their individual travelers the convenience of desktop access to the Sabre system, to monitor travel policies more comprehensively, and to use automated methods of collecting, analyzing and controlling travel expenses. Information Technology Solutions On the other side of Sabre’s business — Information Technology Solutions — the company maintains a leading portfolio of airline software solutions that attracted important new outsourcing clients in 1998. In February, Gulf Air signed a 10-year, $165-million agreement with The Sabre Group. In November, Aerolineas Argentinas signed a 10-year, $120-million agreement and Pakistan International Airlines signed a 15-year outsourcing agreement in December. 22 To date, The Sabre Group’s largest outsourcing contract outside of American Airlines is the 25-year, multi-billion dollar arrangement it formed with US Airways in 1997, whereby The Sabre Group will manage the airline’s information technology infrastructure, including facilities, hardware, applications and desktop. The successful cutover to Sabre systems took place in December 1998. It was the largest systems migration ever in the aviation industry, involving more than three million man-hours. While new outsourcing agreements will remain an important source of revenue growth in the years to come, The Sabre Group’s largest information technol- ogy client is likely to remain American Airlines. A long-term service agreement outsources American’s data processing, network, desktop and applications development to The Sabre Group, fulfilling, at market prices, virtually all of the airline’s information technology requirements.
- 25. CONTENTS Management’s Discussion and Analysis 24 Consolidated Statements of Operations 37 Consolidated Balance Sheets 38 Consolidated Statements of Cash Flows 40 Consolidated Statements of Stockholders’ Equity 41 Notes to Consolidated Financial Statements 42 Report of Independent Auditors 57 Report of Management 57 F I N A N C I A L I N F O R M AT I O N 23
- 26. M A N A G E M E N T ’ S D I S C U S S I O N A N D A N A LY S I S AMR Corporation (AMR or the Company) was incor- BUSINESS SEGMENT FINANCIAL HIGHLIGHTS porated in October 1982. AMR’s principal subsidiary, American Airlines, Inc. (American), was founded in 1934. Airline Group Following the announcement of AMR’s plans to sell the Year Ended December 31, (dollars in millions) 1998 1997 1996 companies that comprised the majority of what was previ- Revenues ously the Management Services Group, AMR’s operations Passenger - American Airlines, Inc. $ 14,695 $ 14,310 $ 13,645 fall within two major lines of business: the Airline Group - AMR Eagle 1,121 1,017 1,047 Cargo 656 687 682 and The Sabre Group. Additional segment information is Other 977 889 837 included in Note 15 to the consolidated financial state- 17,449 16,903 16,211 ments. Operating Expenses Wages, salaries and benefits 5,763 5,480 5,191 Aircraft fuel 1,604 1,923 1,936 R E S U LT S O P E R AT I O N S OF Commissions to agents 1,226 1,278 1,252 Depreciation and amortization 1,038 1,038 1,018 AMR’s net earnings in 1998 were $1.3 billion, or $7.78 Maintenance, materials and repairs 934 861 686 per common share ($7.52 diluted). These results represent Other operating expenses 4,933 4,754 4,686 Total operating expenses 15,498 15,334 14,769 the strongest net earnings ever reported by AMR for a fis- Operating Income 1,951 1,569 1,442 cal year. AMR’s net earnings in 1997 were $985 million, or Other Expense (160) (266) (428) $5.52 per common share ($5.39 diluted). The Company’s Earnings Before Income Taxes 24 and Extraordinary Loss $ 1,791 $ 1,303 $ 1,014 1997 results were adversely affected by (i) a brief strike 92,000 90,600 88,900 Average number of equivalent employees and the strike threat from members of the Allied Pilots Association (APA) during the first quarter of 1997, which Operating Statistics Year Ended December 31, negatively impacted the Company’s net earnings by an 1998 1997 1996 estimated $70 million, and (ii) the reinstatement of the American Airlines Jet Operations airline transportation tax in March of 1997. Revenue passenger miles (millions) 108,955 107,026 104,710 Available seat miles (millions) 155,297 153,917 152,886 The following sections provide a discussion of AMR’s Cargo ton miles (millions) 1,974 2,032 2,028 results by reporting segment. The gain on the sale of stock Passenger load factor 70.2% 69.5% 68.5% by a subsidiary of $497 million in 1996 and minority inter- Breakeven load factor 59.9% 61.0% 60.2% Passenger revenue yield est expense of $40 million, $36 million and $2 million in per passenger mile (cents) 13.49 13.37 13.03 1998, 1997 and 1996, respectively, have not been allocated Passenger revenue to a reporting segment. Additional segment information is per available seat mile (cents) 9.46 9.30 8.92 Cargo revenue yield included in Note 15 to the consolidated financial statements. per ton mile (cents) 32.85 33.78 33.14 Operating expenses per available seat mile (cents) 9.25 9.27 8.91 Operating aircraft at year-end 648 641 642 AMR Eagle Revenue passenger miles (millions) 2,788 2,553 2,590 Available seat miles (millions) 4,471 4,218 4,431 Passenger load factor 62.4% 60.5% 58.5% Operating aircraft at year-end 209 199 205
- 27. AMR CORPORATION REVENUES administrative service charges, higher employee travel service charges and increased service contracts, primarily Airline Group revenues of 1 9 9 8 C O M PA R E D 1997 TO related to ramp and consulting services. $17.4 billion in 1998 were up $546 million, or 3.2 percent, versus 1997. American’s passenger revenues increased 2.7 Airline Group revenues of 1 9 9 7 C O M PA R E D 1996 TO percent, or $385 million. The increase in passenger rev- $16.9 billion in 1997 were up $692 million, or 4.3 percent, enues resulted from a 0.9 percent increase in passenger versus 1996. American’s passenger revenues increased yield (the average amount one passenger pays to fly one 4.9 percent, or $665 million. The increase in passenger mile) from 13.37 to 13.49 cents, and a 1.8 percent increase revenues resulted from a 2.6 percent increase in passenger in passenger traffic. For the year, domestic yields increased yield from 13.03 to 13.37 cents, and a 2.2 percent increase 3.1 percent, while Latin American, Pacific and European in passenger traffic. For the year, domestic yields increased yields decreased 5.8 percent, 3.9 percent and 1.0 percent, 1.8 percent, Latin American yields increased 4.5 percent, respectively. The decrease in international yields was due European yields increased 3.8 percent and Pacific yields primarily to an increase in industry capacity and a decline increased 1.0 percent. In 1997, American derived 69 per- in economic conditions. In 1998, American derived approx- cent of its passenger revenues from domestic operations imately 70 percent of its passenger revenues from domestic and 31 percent from international operations. operations and approximately 30 percent from international American’s domestic traffic increased 2.0 percent operations. to 74.3 billion RPMs, while domestic capacity increased 0.8 25 American’s domestic traffic increased 0.7 percent to percent. International traffic grew 2.6 percent to 32.7 billion 74.9 billion revenue passenger miles (RPMs), while domes- RPMs on a capacity increase of 0.4 percent. The increase in tic capacity, as measured by available seat miles (ASMs), international traffic was led by a 7.2 percent increase in decreased 1.4 percent. International traffic grew 4.3 percent Latin America on capacity growth of 5.5 percent. This to 34.1 billion RPMs on a capacity increase of 6.4 percent. increase was partially offset by a 1.7 percent decrease in the The increase in international traffic was led by a 17.1 per- Pacific on a capacity decline of 2.9 percent and a 1.5 per- cent increase in the Pacific on capacity growth of 29.3 cent decrease in Europe on a capacity decline of 5.3 percent, a 4.9 percent increase in Latin America on capacity percent, primarily due to the cancellation of several routes growth of 6.6 percent and a 1.8 percent increase in Europe during 1997. on capacity growth of 2.7 percent. The Airline Group benefited from several external AMR Eagle’s revenues increased $104 million, or factors in 1997. First, a healthy U.S. economy produced 10.2 percent. The increase in passenger revenues resulted strong demand for air travel. Second, industry capacity grew from a 0.9 percent increase in passenger yield and a 9.2 at a more modest rate than demand, which led to higher percent increase in traffic. AMR Eagle’s traffic increased to industry load factors and a healthy pricing environment. 2.8 billion RPMs while capacity increased to 4.5 billion However, these benefits were adversely impacted by a brief ASMs, up 6.0 percent. strike and the strike threat by members of the APA during The Airline Group’s other revenues increased $88 mil- the first quarter of 1997, which negatively impacted the lion, or 9.9 percent, primarily as a result of increased Company’s net earnings by an estimated $70 million.
- 28. O P E R AT I N G E X P E N S E S due to a 1.6 percent decrease in American’s average price per gallon, including taxes, partially offset by a 1.4 percent Airline Group operating 1 9 9 8 C O M PA R E D 1997 TO increase in American’s fuel consumption. Commissions to expenses of $15.5 billion in 1998 were up $164 million, agents increased 2.1 percent, or $26 million, due primarily or 1.1 percent, versus 1997. American’s Jet Operations to increased passenger revenues. This increase was offset by cost per ASM decreased 0.2 percent to 9.25 cents. Wages, changes in the Company’s travel agency commission pay- salaries and benefits increased $283 million, or 5.2 per- ment structure implemented in September 1997 which cent, due primarily to an increase in the average number lowered the base commission paid to travel agents from of equivalent employees, contractual wage rate and senior- 10 percent to eight percent on all tickets purchased in the ity increases that are built into the Company’s labor U.S. and Canada for both domestic and international travel. contracts and an increase in the provision for profit shar- Maintenance, materials and repairs expense increased ing. Fuel expense decreased $319 million, or 16.6 percent, 25.5 percent, or $175 million, due to an increase in air- due to an 18.2 percent decrease in American’s average frame and engine maintenance check volumes at American’s price per gallon, including taxes, partially offset by a 1.9 maintenance bases as a result of the maturing of its fleet. percent increase in American’s fuel consumption. Other operating expenses increased $68 million, or 1.5 per- Commissions to agents decreased 4.1 percent, or $52 mil- cent, due primarily to an increase in outsourced services, lion, despite a 3.2 percent increase in passenger revenues, additional airport security requirements, and higher costs, due to the continued benefit from the commission rate such as credit card fees, resulting from higher passenger 26 reduction initiated during September 1997. Maintenance, revenues. Other operating expenses in 1996 included a $26 materials and repairs expense increased 8.5 percent, or million charge to write down the value of aircraft interiors. $73 million, due to an increase in airframe and engine maintenance volumes at American’s maintenance bases as OTHER EXPENSE a result of the maturing of its fleet. Other operating expenses increased $179 million, or 3.8 percent, due pri- Other expense consists of interest income and expense, marily to spending on the Company’s Year 2000 Readiness interest capitalized and miscellaneous - net. program, an increase in outsourced services and higher Interest expense decreased 1 9 9 8 C O M PA R E D 1997 TO costs, such as credit card fees, resulting from higher pas- $48 million, or 11.3 percent, due primarily to scheduled senger revenues. debt repayments of approximately $400 million in 1998. Airline Group operating Interest capitalized increased $84 million, to $104 million, 1 9 9 7 C O M PA R E D 1996 TO expenses of $15.3 billion in 1997 were up $565 million, or due primarily to the increase in purchase deposits for 3.8 percent, versus 1996. American’s Jet Operations cost per flight equipment. ASM increased 4.0 percent to 9.27 cents. Wages, salaries Interest expense decreased 1 9 9 7 C O M PA R E D 1996 TO and benefits increased $289 million, or 5.6 percent, due 18.3 percent, or $95 million, due primarily to scheduled primarily to an increase in the average number of equivalent debt repayments and the repurchase and/or retirement employees, contractual wage rate and seniority increases prior to scheduled maturity of approximately $469 million that are built into the Company’s labor contracts, including and $1.1 billion of long-term debt in 1997 and 1996, a three percent rate increase granted to pilots effective respectively, and a reduction of $850 million of American’s August 31, 1997, and an increase in the provision for profit long-term debt owed to AMR as part of the reorganization sharing. Fuel expense decreased $13 million, or 0.7 percent, of The Sabre Group. Also, in 1996, the Company’s
- 29. AMR CORPORATION convertible debentures were converted into AMR common an overall increase in the price per booking charged to stock, resulting in an $834 million decrease in long-term associates. Revenues from information technology solu- debt. Interest capitalized increased $10 million due to tions increased approximately $65 million, or 12.1 additional aircraft purchase deposits. Interest income percent. Revenues from unaffiliated customers increased increased approximately 29.1 percent, or $30 million, due approximately $39 million due to an increase in software primarily to higher investment balances. Miscellaneous - development, consulting and software license fee revenues. net for 1996 included a $21 million provision for a cash Revenues from other AMR units increased $24 million due payment representing American’s share of a multi-carrier to an increase in software development revenue and data travel agency class action litigation settlement. processing volumes, offset by a decrease in data network revenue from the sale, in July 1996, of data network The Sabre Group equipment to a third party which began direct billing Year Ended December 31, certain items to American. (dollars in millions) 1998 1997 1996 Revenues $ 2,306 $ 1,789 $ 1,625 Operating Expenses 1,956 1,476 1,295 O P E R AT I N G E X P E N S E S Operating Income 350 313 330 Other Income (Expense) 21 11 (24) Operating expenses increased 1 9 9 8 C O M PA R E D 1997 TO Earnings Before Income Taxes $ 371 $ 324 $ 306 32.5 percent, or $480 million, due primarily to increases 11,400 8,500 7,900 Average number of equivalent employees in salaries, benefits and employee-related costs, subscriber 27 incentive expenses, depreciation and amortization expense REVENUES and other operating expenses. Salaries, benefits and Revenues for The Sabre 1 9 9 8 C O M PA R E D 1997 TO employee-related costs increased due to an increase in the Group increased $517 million, or 28.9 percent. Electronic average number of employees necessary to support The travel distribution revenues increased approximately $120 Sabre Group’s business growth, and wage and salary million, or 10.0 percent, due to growth in bookings and increases for existing employees. Subscriber incentive an overall increase in the average price per booking. expenses increased in order to maintain and expand The Revenues from information technology solutions increased Sabre Group’s travel agency subscriber base. The increase approximately $397 million, or 68.4 percent, primarily in depreciation and amortization expense is primarily due due to the services performed under the information tech- to the acquisition of information technology assets to sup- nology services agreement with US Airways, and Year port the US Airways’ contract, and normal additions. 2000 testing and readiness enhancements for certain AMR Other operating expenses increased primarily due to units and Canadian Airlines International Limited equipment maintenance costs, other software development (Canadian). expenses related to The Sabre Group’s Year 2000 Readiness program, and increased data processing costs, other ser- Revenues for The Sabre 1 9 9 7 C O M PA R E D 1996 TO vices purchased and facility costs. Group increased 10.1 percent, or $164 million. Electronic travel distribution revenues increased approximately $99 million, or 8.9 percent, primarily due to growth in booking fees. The growth in booking fees was due to an increase in booking volumes primarily attributable to international expansion in Europe and Latin America and
- 30. Operating expenses increased American took delivery of 10 jet aircraft – six Boeing 757- 1 9 9 7 C O M PA R E D 1996 TO 14.0 percent, or $181 million, due primarily to increases 200s and four Boeing 767-300ERs. American Eagle took in salaries, benefits and employee-related costs and sub- delivery of 20 Embraer EMB-145s and five Super ATR air- scriber incentive expenses. Salaries, benefits and craft. These expenditures, as well as the expansion of employee-related costs increased due to an increase in the certain airport facilities, were funded primarily with inter- average number of equivalent employees necessary to sup- nally generated cash, except for (i) the Embraer aircraft port The Sabre Group’s revenue growth, and wage and acquisitions which were funded through secured debt salary increases for existing employees. Subscriber incen- agreements, and (ii) five Boeing 757-200 aircraft which tive expenses increased in order to maintain and expand were financed through sale-leaseback transactions. During The Sabre Group’s travel agency subscriber base. 1998, The Sabre Group invested approximately $140 mil- lion for a 35 percent interest in ABACUS International Ltd. The Company made acquisitions and other investments of OTHER INCOME (EXPENSE) $137 million, which relate primarily to the acquisition of Other income (expense) 1 9 9 8 C O M PA R E D 1997 TO Reno Air in December 1998. Proceeds from the sale of increased $10 million due primarily to a favorable equipment and property of $293 million in 1998 include court judgment. proceeds received upon the delivery of two of American’s Other income (expense) McDonnell Douglas MD-11 aircraft to Federal Express 1 9 9 7 C O M PA R E D 1996 TO increased $35 million due to an increase in interest Corporation (FedEx) in accordance with the 1995 agree- 28 income of $17 million due to higher investment balances, ment between the two parties, 10 ATR 42 aircraft, and an increase in other income of $13 million primarily due other aircraft equipment sales. to losses in 1996 from a subsidiary of The Sabre Group At December 31, 1998, the Company had commit- not active in 1997, and a decrease in interest expense of ments to acquire the following aircraft: 100 Boeing approximately $6 million primarily due to a lower princi- 737-800s, 34 Boeing 777-200IGWs, six Boeing 757-200s, pal balance outstanding on the subordinated debenture four Boeing 767-300ERs, 75 Embraer EMB-135s, 30 payable to AMR and lower interest rates. Embraer EMB-145s and 25 Bombardier CRJ-700s. Deliveries of these aircraft commence in 1999 and will continue through 2005. Future payments, including esti- LIQUIDITY C A P I TA L R E S O U R C E S AND mated amounts for price escalation through anticipated Operating activities provided net cash of $3.2 billion in delivery dates for these aircraft and related equipment, will 1998, $2.9 billion in 1997 and $2.7 billion in 1996. The approximate $2.7 billion in 1999, $2.0 billion in 2000, $326 million increase from 1997 to 1998 resulted primarily $1.6 billion in 2001 and an aggregate of approximately from an increase in net earnings. The $181 million increase $1.5 billion in 2002 through 2005. In addition to these from 1996 to 1997 resulted primarily from an increase in commitments for aircraft, the Company expects to spend the air traffic liability due to higher advanced sales. approximately $1.5 billion related to modifications to air- Capital expenditures in 1998 totaled $2.7 billion, craft, renovations of -- and additions to -- airport and compared to $1.4 billion in 1997 and $523 million in office facilities, and the acquisition of various other equip- 1996, and included purchase deposits on new aircraft ment and assets in 1999, of which approximately $625 orders of $870 million, aircraft acquisitions of approxi- million has been authorized by the Company’s Board of mately $850 million, and purchases of computer-related Directors. The Company expects to fund the majority of equipment totaling approximately $360 million. In 1998, its 1999 capital expenditures from the Company’s existing
- 31. AMR CORPORATION cash and short-term investments, internally generated traded market value of Equant common stock. In connec- cash, and some new financing depending upon capital tion with a secondary offering of Equant, the Company market conditions and the Company’s evolving view of its sold approximately 900,000 depository certificates in long-term needs. February 1999 for net proceeds of $66 million. The For the year ended December 31, 1998, a total of remaining depository certificates are subject to a final real- approximately 14.3 million shares of the Company’s com- location between the owners of the certificates during mon stock were purchased by the Company under three 1999 and thus, the number of certificates owned by the separate share repurchase programs at a total cost of Company is subject to change. approximately $945 million. The Company expects to American has a $1.0 billion credit facility agreement spend approximately $400 million by the end of the first which expires December 19, 2001. At American’s option, quarter of 1999 to complete the $500 million share interest on the agreement can be calculated on one of repurchase program initiated in October 1998. On several different bases. For most borrowings, American March 17, 1999, the Company’s Board of Directors autho- would anticipate choosing a floating rate based upon the rized management to repurchase up to an additional $500 London Interbank Offered Rate (LIBOR). At December 31, million of the Company’s outstanding common stock. 1998, no borrowings were outstanding under the agreement. Share repurchases may be made from time to time, AMR (principally American Airlines) historically depending on market conditions, and may be discontin- operates with a working capital deficit as do most other ued at any time. airline companies. The existence of such a deficit has not 29 In 1997, the Board of Directors of The Sabre Group in the past impaired the Company’s ability to meet its approved a stock repurchase program for The Sabre obligations as they become due and is not expected to Group, under which The Sabre Group will repurchase, do so in the future. subject to certain business and market conditions, up to 1.5 million shares of The Sabre Group’s Class A common O T H E R I N F O R M AT I O N stock. During 1998, a total of approximately 1.4 million Subsidiaries of AMR have E N V I R O N M E N TA L M AT T E R S shares were purchased by The Sabre Group at a total cost been notified of potential liability with regard to several of approximately $49 million. In addition, on March 16, environmental cleanup sites and certain airport locations. 1999, the Board of Directors of The Sabre Group approved At sites where remedial litigation has commenced, poten- an additional stock repurchase program for The Sabre tial liability is joint and several. AMR’s alleged volumetric Group, under which The Sabre Group will repurchase, contributions at these sites are minimal. AMR does not subject to certain business and market conditions, up to expect these matters, individually or collectively, to have one million shares of The Sabre Group’s Class A a material impact on its results of operations, financial common stock. position or liquidity. Additional information is included At December 31, 1998, the Company owned in Note 3 to the consolidated financial statements. approximately 3.1 million depository certificates convert- ible, subject to certain restrictions, into the common stock YEAR 2000 READINESS of Equant N.V. (Equant), which completed an initial public In 1995, the Company imple- S TAT E READINESS OF offering in July 1998. As of December 31, 1998, the esti- mented a project (the Year 2000 Project) intended to mated fair value of these depository certificates was ensure that hardware and software systems operated by the approximately $210 million, based upon the publicly- Company, including software licensed to or operated for
- 32. third parties by The Sabre Group, are designed to operate upgrading of certain hardware and software that supports its and properly manage dates beyond December 31, 1999 IT Systems by June 30, 1999. (Year 2000 Readiness). The Company has assessed (i) the The Company has substantially com- NON-IT SYSTEMS Company’s over 1,000 information technology and operat- pleted the testing and validation phase of its critical Non-IT ing systems that will be utilized after December 31, 1999 Systems, such as aircraft avionics and flight simulators, (IT Systems); (ii) non-information technology systems, and expects to complete the remainder of the testing and including embedded technology, facilities, and other sys- validation phase and the quality assurance review phase by tems (Non-IT Systems); and (iii) the Year 2000 Readiness of June 30, 1999. In addition, the Company expects to com- its critical third party service providers. The Year 2000 plete the quality assurance review phase for substantially Project consists of six phases: (i) awareness, (ii) assessment, all of its other Non-IT Systems by June 30, 1999. The (iii) analysis, design and remediation, (iv) testing and valida- Company believes that its business, financial condition tion, (v) quality assurance review (to ensure consistency and results of operations would not be materially throughout the Year 2000 Project) and (vi) creation of busi- adversely affected, and that it has adequate contingency ness continuity strategy, including plans in the event of Year plans to ensure business continuity if its other Non-IT 2000 failures. In developing the Company’s proprietary soft- Systems are not Year 2000 ready. ware analysis, remediation and testing methodology for Year 2000 Readiness, it studied the best practices of the Institute The Company relies on third T H I R D PA RT Y S E RV I C E S of Electrical and Electronics Engineers and the British party service providers for many items, such as the Federal 30 Standards Institution. Aviation Administration, the Department of Transportation, airport authorities, telecommunications, electrical power, The Company has completed the first three IT SYSTEMS and data and credit card transaction processing. Those ser- phases of the Year 2000 Project for all of its IT Systems. The vice providers depend on their hardware and software Company has completed the testing and validation phase systems and on interfaces with the Company’s IT Systems. and quality assurance review phase for 94 percent of its The Company has polled its critical service providers IT Systems, including its computer reservations and flight regarding their Year 2000 plans and state of readiness. The operating systems that perform such “mission critical” func- Company has received responses from approximately 68 tions as passenger bookings, ticketing, passenger check-in, percent of its critical service providers, other than providers aircraft weight and balance, flight planning and baggage and of discretionary services that will not materially adversely cargo processing. As of February 28, 1999, approximately affect the Company’s business, financial condition, and 38 percent of the IT Systems (including the computer results of operations. Most of the respondees assured the reservations systems) are already processing Year 2000 Company that their software and hardware is or will be Year dates correctly. 2000 ready. To the extent practical, the Company intends to Using dedicated testing environments and applying seek alternatives for third party service providers that have rigorous test standards, the Company is actively testing its not responded to their Year 2000 Readiness by June 30, 1999. other IT Systems to determine if they are Year 2000 ready or if further remediation is necessary. The Company expects to The Company expects to COSTS YEAR 2000 PROJECT OF complete the testing and validation phase and quality assur- incur significant hardware, software and labor costs, as well ance review phase for its remaining IT Systems, and the as consulting and other expenses, in its Year 2000 Project.
- 33. AMR CORPORATION The Company’s total estimated cost of the project is approx- derived utilizing numerous assumptions of future events imately $215 to $250 million, of which approximately $180 including the continued availability of certain resources, million was incurred as of December 31, 1998. Costs asso- third party modification plans and other factors. However, ciated with the Year 2000 Project are expensed as incurred, there can be no guarantee that these estimates will be other than capitalized hardware costs, and have been achieved, and actual results could differ materially from funded through cash from operations. these estimates. Specific factors that might cause such material differences include, but are not limited to, the The economy in RISKS YEAR 2000 NON-READINESS OF availability and cost of personnel trained in this area, the general, and the travel and transportation industries in par- ability to locate and correct all relevant computer codes, the ticular, may be adversely affected by risks associated with failure of third parties to be Year 2000 ready and similar the Year 2000. The Company’s business, financial condition uncertainties. and results of operations could be materially adversely affected if systems that it operates or systems that are oper- In January 1999, certain NEW EUROPEAN CURRENCY ated by third party service providers upon which the European countries established fixed conversion rates Company relies are not Year 2000 ready in time. There can between their currencies and a new common currency unit be no assurance that these systems will continue to properly called the “euro”. The transition period for the introduction function and interface and will otherwise be Year 2000 of the euro is between January 1, 1999 and June 30, 2002. ready. Management believes that its most likely Year 2000 In 1997, the Company implemented a project intended to 31 risks relate to the failure of third parties with whom it has ensure that software systems operated by the Company’s material relationships to be Year 2000 ready. businesses as well as software licensed to or operated for third parties by The Sabre Group were designed to properly To the extent practical, the BUSINESS CONTINUITY PLANS handle the euro. The Company completed the project Company is identifying the most likely Year 2000 failures in in 1998. an effort to develop and refine plans to continue its business in the event of failures of the Company’s or third parties’ In 1968, as part of an agreement DALLAS LOVE FIELD systems to be Year 2000 ready. These plans include per- between the cities of Fort Worth and Dallas to build and forming certain processes manually; maintaining operate Dallas/Fort Worth Airport (DFW), a bond ordinance dedicated staff to be available at crucial dates to remedy was enacted by both cities (the Bond Ordinance). The Bond unforeseen problems; installing defensive code to protect Ordinance required both cities to direct all scheduled inter- real-time systems from improperly formatted date data sup- state passenger operations to DFW and was an integral part plied by third parties; repairing or obtaining replacement of the bonds issued for the construction and operation of systems; and reducing or suspending certain aspects of the DFW. In 1979, as part of a settlement to resolve litigation Company’s services or operations. Because of the pervasive- with Southwest Airlines, the cities agreed to expand the ness and complexity of the Year 2000 issue, and in scope of operations allowed under the Bond Ordinance particular the uncertainty concerning the efforts and success at Dallas’ Love Field. Congress enacted the Wright of third parties to be Year 2000 ready, the Company will Amendment to prevent the federal government from acting continue to refine its contingency plans during 1999. inconsistent with this agreement. The Wright Amendment The costs of the project and the date on which the limited interstate operations at Love Field to the four states Company plans to complete the Year 2000 Readiness pro- contiguous to Texas (New Mexico, Oklahoma, Arkansas and gram are based on management’s best estimates, which were Louisiana) and prohibited through ticketing to any destina-