
Empfohlen
Weitere ähnliche Inhalte
Was ist angesagt?
Was ist angesagt? (19)
Ähnlich wie conoco phillips 2006First Quarter
Ähnlich wie conoco phillips 2006First Quarter (20)
Mehr von finance1
Mehr von finance1 (20)
Kürzlich hochgeladen
Kürzlich hochgeladen (20)
conoco phillips 2006First Quarter
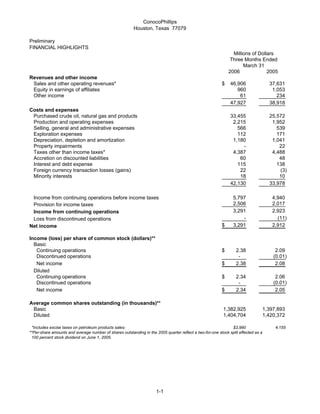
- 1. ConocoPhillips Houston, Texas 77079 Preliminary FINANCIAL HIGHLIGHTS Millions of Dollars Three Months Ended March 31 2006 2005 Revenues and other income Sales and other operating revenues* $ 46,906 37,631 Equity in earnings of affiliates 960 1,053 Other income 61 234 47,927 38,918 Costs and expenses Purchased crude oil, natural gas and products 33,455 25,572 Production and operating expenses 2,215 1,952 Selling, general and administrative expenses 566 539 Exploration expenses 112 171 Depreciation, depletion and amortization 1,180 1,041 Property impairments - 22 Taxes other than income taxes* 4,387 4,488 Accretion on discounted liabilities 60 48 Interest and debt expense 115 138 Foreign currency transaction losses (gains) 22 (3) Minority interests 18 10 42,130 33,978 Income from continuing operations before income taxes 5,797 4,940 2,506 2,017 Provision for income taxes 3,291 2,923 Income from continuing operations - (11) Loss from discontinued operations $ 3,291 2,912 Net income Income (loss) per share of common stock (dollars)** Basic Continuing operations $ 2.38 2.09 Discontinued operations - (0.01) Net income $ 2.38 2.08 Diluted Continuing operations $ 2.34 2.06 Discontinued operations - (0.01) Net income $ 2.34 2.05 Average common shares outstanding (in thousands)** Basic 1,382,925 1,397,893 Diluted 1,404,704 1,420,372 *Includes excise taxes on petroleum products sales: $3,990 4,155 **Per-share amounts and average number of shares outstanding in the 2005 quarter reflect a two-for-one stock split effected as a 100 percent stock dividend on June 1, 2005. 1-1
- 2. ConocoPhillips Houston, Texas 77079 Preliminary SELECTED FINANCIAL DATA Millions of Dollars Three Months Ended March 31 2006 2005 INCOME (LOSS) FROM CONTINUING OPERATIONS E&P United States $ 1,181 892 International 1,372 895 Total E&P 2,553 1,787 Midstream 110 385 R&M United States 297 570 International 93 130 Total R&M 390 700 LUKOIL Investment 249 110 Chemicals 149 133 Emerging Businesses 8 (8) Corporate and other (168) (184) Consolidated $ 3,291 2,923 INCOME (LOSS) FROM DISCONTINUED OPERATIONS Corporate and other - (11) SUMMARY OF NET INCOME (LOSS) E&P United States $ 1,181 892 International 1,372 895 Total E&P 2,553 1,787 Midstream 110 385 R&M United States 297 570 International 93 130 Total R&M 390 700 LUKOIL Investment 249 110 Chemicals 149 133 Emerging Businesses 8 (8) Corporate and other (168) (195) Net Income $ 3,291 2,912 1-2
- 3. ConocoPhillips Houston, Texas 77079 Preliminary SELECTED FINANCIAL DATA Three Months Ended March 31 2006 2005 INCOME FROM CONTINUING OPERATIONS Effective tax rate % 43.2 % 40.8 Millions of Dollars FOREIGN CURRENCY GAINS (LOSSES) AFTER-TAX E&P $ 7 12 Midstream - - R&M 6 (18) LUKOIL Investment - - Chemicals - - Emerging Businesses - - Corporate and other (8) 7 $ 5 1 CASH FLOWS FROM OPERATING ACTIVITIES Income from continuing operations $ 3,291 2,923 Depreciation, depletion and amortization 1,180 1,041 Property impairments - 22 Dry hole costs and leasehold impairment 38 109 Accretion on discounted liabilities 60 48 Deferred income taxes 168 123 Undistributed equity earnings (67) (805) Net gain on asset dispositions (3) (177) Other (203) (78) Working capital changes 336 888 Net cash provided by continuing operations 4,800 4,094 Net cash provided by discontinued operations - (5) Net cash provided by operating activities $ 4,800 4,089 CAPITAL EXPENDITURES AND INVESTMENTS E&P United States $ 419 322 International 1,787 884 2,206 1,206 Midstream 1 1 R&M 1,635 275 LUKOIL Investment 612 324 Chemicals - - Emerging Businesses 12 (4) Corporate and other 48 20 $ 4,514 1,822 OTHER At March 31, 2006 At December 31, 2005 Total debt $32,193 12,516 Common stockholders' equity $72,193 52,731 1-3
- 4. ConocoPhillips Houston, Texas 77079 Preliminary OPERATING HIGHLIGHTS BY SEGMENT Three Months Ended March 31 2006 2005 Thousands of Barrels Daily E&P Crude oil produced United States Alaska 283 309 Lower 48 64 62 347 371 Norway 188 207 United Kingdom 62 61 Canada 22 23 China 25 22 Indonesia 14 21 Vietnam 31 27 Timor Sea 39 36 Other 49 54 Total consolidated 777 822 Equity affiliates 126 120 Total Worldwide 903 942 Syncrude 16 14 Natural gas liquids produced United States Alaska* 22 24 Lower 48 29 27 51 51 Norway 11 10 Canada 9 10 Timor Sea 20 17 Other 6 6 Total Worldwide 97 94 14 13 *Includes reinjected volumes sold lease-to-lease. Millions of Cubic Feet Daily Natural gas produced* United States Alaska 163 185 Lower 48 1,264 1,169 1,427 1,354 Norway 269 298 United Kingdom 851 824 Canada 424 417 Timor Sea 144 35 Indonesia 294 273 Vietnam 24 18 Other 121 76 Total consolidated 3,554 3,295 Equity affiliates 11 5 Total Worldwide 3,565 3,300 *Represents quantities available for sale. Excludes gas equivalent of NGL shown above. Liquefied natural gas sales 264 132 LUKOIL Investment Production (MBOE/D)* 322 201 Refinery crude oil throughput (MB/D)* 163 92 *Represents our estimated net share of LUKOIL 1-4
- 5. ConocoPhillips Houston, Texas 77079 Preliminary OPERATING HIGHLIGHTS Three Months Ended March 31 2006 2005 E&P Per Unit Average sales prices Crude oil (per barrel) United States Alaska $ 58.87 44.15 Lower 48 52.21 41.29 Total U.S. 57.70 43.69 International 60.08 45.93 Total consolidated 58.97 44.89 Equity affiliates * 43.38 30.38 Total Worldwide 56.63 43.15 Natural gas-lease (per MCF) United States Alaska 3.58 2.96 Lower 48 7.50 5.66 Total U.S. 7.42 5.57 International 7.16 5.03 Total consolidated 7.26 5.24 Equity affiliates * 0.23 0.25 Total Worldwide 7.24 5.24 *Excludes our equity share of LUKOIL reported in the LUKOIL Investment segment Midstream Thousands of Barrels Daily Natural gas liquids extracted Consolidated United States 23 23 International - 53 Equity affiliates United States** 178 110 International 6 6 207 192 **Represents 30.3 percent interest in Duke Energy Field Services LLC (DEFS), through June 30, 2005, and 50 percent interest beginning in July 2005. Per Barrel U.S. product prices Weighted average NGL** Consolidated $ 37.64 31.95 DEFS 37.29 30.61 **Prices are based on index prices from the Mont Belvieu and Conway market hubs that are weighted by naural-gas-liquids component and location mix. 1-5
- 6. ConocoPhillips Houston, Texas 77079 Preliminary OPERATING HIGHLIGHTS Three Months Ended March 31 2006 2005 Thousands of Barrels Daily R&M United States Crude oil capacity 2,208 2,173 Crude oil runs 1,840 1,957 Refinery production 1,988 2,147 International* Crude oil capacity 523 428 Crude oil runs 490 428 Refinery production 500 443 U.S. Petroleum products outside sales Gasoline 1,258 1,302 Distillates 626 642 Aviation fuels 187 198 Other products 517 461 2,588 2,603 International 549 495 3,137 3,098 Per Gallon U.S. Average sales prices** Automotive gasoline-wholesale $ 1.79 1.44 Automotive gasoline-retail 1.90 1.55 Distillates-wholesale 1.89 1.48 *Includes ConocoPhillips' share of equity affiliates. **Excludes excise taxes. 1-6