Beginners Guide to TikTok for Search - Rachel Pearson - We are Tilt __ Bright...
FHO Partners 3Q 2009 Market Watch Report
1. Market Watch
“The economy is stabilized. You can see signs of growth here and around the world…It’s going to be
very hard going forward still…Recovery’s going to have to be led by the private sector and it’s going
to have to be driven by private companies...”
Commercial - Timothy Geithner, Secretary of the Treasury, October 2009
Real Estate
Value-Addvisors
THIRD QUARTER 2009
OVERALL MARKET STATISTICS 3Q 2009 SUMMARY EXECUTIVE OVERVIEW
Asking Rent Vacancy Absorption
After being hammered by the consequences of multiple calamities in the financial system
Boston for much of 2009, the global economy is beginning to show signs of improvement amid
the turmoil. Regardless of these early indications that things are getting better, through the
first three quarters of 2009 the commercial real estate market in greater Boston continues
Cambridge to feel the negative effects of the downturn in the national and local economies.
Suburbs The United States and Massachusetts economies are finally experiencing modest growth,
indicating that the recession is likely coming to an end. In the third quarter the stock
market was on an upward trajectory and levels of residential real estate sales increased.
Unfortunately, the damage done to the economy continues to have a severe negative im-
THE STATE OF THE ECONOMY BY THE NUMBERS pact on both the employment picture and consumer confidence. The venture capital and
3Q 2008 3Q 2009 IPO markets are beginning to come back to life, but relative to recent years, they continue
to be hampered by the current economic conditions. Despite the potential of an imminent
DJIA 10,831.07 9,509.28 economic recovery, it is likely that the greater Boston office market will remain significantly
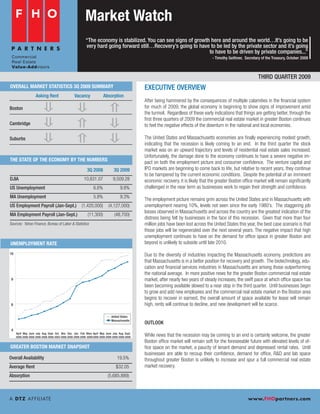
US Unemployment 6.6% 9.8% challenged in the near term as businesses work to regain their strength and confidence.
MA Unemployment 5.8% 9.3%
The employment picture remains grim across the United States and in Massachusetts with
US Employment Payroll (Jan-Sept.) (1,420,000) (4,127,000) unemployment nearing 10%, levels not seen since the early 1980’s. The staggering job
losses observed in Massachusetts and across the country are the greatest indication of the
MA Employment Payroll (Jan-Sept.) (11,300) (48,700)
distress being felt by businesses in the face of this recession. Given that more than four
Sources: Yahoo Finance, Bureau of Labor & Statistics million jobs have been lost across the United States this year, the best case scenario is that
those jobs will be regenerated over the next several years. The negative impact that high
unemployment continues to have on the demand for office space in greater Boston and
UNEMPLOYMENT RATE beyond is unlikely to subside until late 2010.
10 Due to the diversity of industries impacting the Massachusetts economy, predictions are
that Massachusetts is in a better position for recovery and growth. The biotechnology, edu-
cation and financial services industries in Massachusetts are among those outperforming
the national average. In more positive news for the greater Boston commercial real estate
8 market, after nearly two years of steady increases, the swift pace at which office space has
been becoming available slowed to a near stop in the third quarter. Until businesses begin
to grow and add new employees and the commercial real estate market in the Boston area
begins to recover in earnest, the overall amount of space available for lease will remain
6 high, rents will continue to decline, and new development will be scarce.
United States
Massachusetts
OUTLOOK
4
April May June July Aug. Sept. Oct. Nov. Dec. Jan. Feb. Marc April May June July Aug. Sept.
2008 2008 2008 2008 2008 2008 2003 2008 2008 2009 2009 2009 2009 2009 2009 2009 2009 2009 While news that the recession may be coming to an end is certainly welcome, the greater
Boston office market will remain soft for the foreseeable future with elevated levels of of-
GREATER BOSTON MARKET SNAPSHOT fice space on the market, a paucity of tenant demand and depressed rental rates. Until
businesses are able to recoup their confidence, demand for office, R&D and lab space
Overall Availability 19.5% throughout greater Boston is unlikely to increase and spur a full commercial real estate
Average Rent $32.05 market recovery.
Absorption (5,685,889)
A DT Z A FFI L I ATE www.FHOpartners.com
2. MARKET WATCH | THIRD QUARTER 2009
ABSORPTION / VACANCY 1999-YTD 2009 BOSTON OVERVIEW
Square Feet % Vacancy
2000000 18% Thus far in 2009, the office market in downtown Boston continues to be impacted by the
1500000 16% challenges in the national and global economies. The downtown Boston office market is
1000000 14% struggling in the face of stagnant demand for office space as businesses attempt to re-
500000 12%
bound from a difficult year. With little new growth happening in any sector, the deal activity
that is occurring downtown is mainly being driven by looming lease expirations. Landlord
0 10%
concessions and “blend and extend” lease restructures are more prevalent as tenants
-500000 8%
capitalize on the soft market to maximize value. Despite improvement in the stock market
-1000000 6% and the positive impact that is having on Boston’s financial service heavy business com-
-1500000 4% munity, the prospect for job creation is unlikely to materialize until late 2010 at the earliest.
-2000000 Net Absorption 2%
Vacancy Rate
-2500000 0%
Though the percentage of available space decreased slightly this quarter from 16.7% to
1999 2000 2001 2002 2003 2004 2005 2006 2007 2008 YTD 2009
16.4%, it still is a nearly 3.5% increase since the beginning of 2009. This slight decline
in available space reflects a considerable slowing of the pace at which space is being
made available for lease.
The amount of space available for sublease remains high with more than 1.5 million
MARKET HIGHLIGHTS square feet available, nearly double the amount available at this time in 2008. There
was a 10,737 square foot decline in the amount of space available for sublease in the
Inventory 58,261,767 SF third quarter, an indication that the sublease space supply may be leveling off.
Availability Rate 16.4%
Given the scarcity of financing, the dearth of demand, high levels of available space
Net Absorption YTD 2009 (1,819,878) SF
and declining rents, several construction projects have stalled and new development in
Average Asking Rent $17.00-$65.00/SF Boston is unlikely in the short term.
There was 158,371 square feet of net absorption in downtown Boston in the third
quarter and 1,819,878 square feet of negative absorption observed so far in 2009.
While average asking rental rates in downtown Boston decreased nearly 15% this year,
RENTAL RATES average rents remained flat at $42.84 per square foot in the third quarter.
$100
MARKET MAKERS
BNY Mellon renewed its lease of 369,000 square feet at One Boston Place.
$75
Fish & Richardson will move into 124,000 square feet at One Marina Park Drive.
$50 Verizon will lease 202,000 square feet at 185 Franklin Street in the Financial District.
Interactive Technology Group will relocate and expand into 70,000 square feet at 100
High Street.
$25
HISTORICAL PERSPECTIVE
$0
2004 2005 2006 2007 2008 YTD 2009 The percentage of office space currently available in downtown Boston is 16.4%, the
highest point since 2004 when the availability rate peaked at 17.1%. This marks a steep
increase over the 12.0% available at the end of 2007, the low point in the last market
recovery.
DEVELOPMENT PROJECTS
One Marina Park Drive - Fan Pier 504,000 SF
Russia Wharf 550,000 SF
2 | FHO Partners
3. MARKET WATCH | THIRD QUARTER 2009
OFFICE ABSORPTION / VACANCY 1999-YTD 2009 CAMBRIDGE OVERVIEW
Square Feet % Vacancy
1,200,000 30% Through the first three quarters of 2009, the Cambridge lab market continues to outper-
1,000,000
form the greater Boston commercial real estate market despite the challenges in the larger
800,000 25%
economy. Due to the relative health of the biotechnology industry and the strength of insti-
600,000
400,000 20%
tutional tenants, the Cambridge lab market has experienced higher levels of demand than
200,000 the office market. In spite of the stability in the lab market, like Boston and the suburbs the
0 15% Cambridge office market is struggling under the weight of sluggish demand. Compared
-200,000 to recent years, the lab and office markets in Cambridge are facing increases in available
-400,000 10%
space, declining rental rates, and little new construction.
-600,000
-800,000 5%
-1,000,000
Net Absorption Office Market
Vacancy Rate
-1,200,000 0%
The Cambridge office market continued to see an increase in available space with the
1999 2000 2001 2002 2003 2004 2005 2006 2007 2008 YTD
2009
availability rate rising from 12.9% at the beginning of 2009 to 16.8% currently.
OFFICE MARKET HIGHLIGHTS There has been 393,731 square feet of negative absorption experienced this year, a
number surpassed only by the 1.1 million square feet of negative absorption recorded
Inventory 9,769,186 SF
during the internet bust of 2001.
Availability Rate 16.8%
Net Absorption YTD 2009 (393,731) SF The amount of sublease space on the market increased in the third quarter from 366,365
square feet at the end of the second quarter to the current 409,947 square feet.
Average Asking Rent $15.00-$55.00/SF
Average asking rental rates for office space in Cambridge continued to decrease in the
third quarter to $38.42 per square foot, a decline of approximately 15% in the past year.
LAB MARKET HIGHLIGHTS
Lab Market
Inventory 7,833,232 SF The Cambridge lab market stumbled a bit this quarter, with 58,110 square feet of nega-
Availability Rate 16.6% tive absorption and an availability rate that increased from 15.8% in July to 16.6% cur-
rently.
Net Abosorption YTD 2009 11,089 SF
Average Asking Rent $25.00-$65.00/SF NNN Average asking rental rates have declined this year from $53.91 per square foot in
October 2008, to $51.14 per square foot currently.
OFFICE RENTAL RATES The amount of sublease lab space on the market shrank further this quarter; the 82,891
square feet on the market for sublease this quarter is about half what was on the market
$100
at this time in 2008.
Speculative construction of 300,000 square feet at 650 East Kendall Street continues
$75 to progress without a tenant committed to the project. Although Alexandria Properties
recently received approval for a massive 1.9 million square foot lab building project in
East Cambridge, given market conditions it is unlikely that any further new development
$50 will commence in the foreseeable future.
MARKET MAKERS
$25 The Broad Institute continues to grow and will expand into an additional 18,000 square
feet at 5 Cambridge Center.
ITA Software renewed and expanded into approximately 85,000 square feet at 141 Port-
$0
2004 2005 2006 2007 2008 YTD 2009
land Street.
HISTORICAL PERSPECTIVE
DEVELOPMENT PROJECTS
At the present rate of 16.8%, the percentage of available office space in Cambridge is
650 East Kendall Street 277,671 SF significantly less than 25.7% in January 2004, the high reached during the last downturn.
The 16.6% of lab space currently available is a dramatic increase over the low of 10.4%
at the end of 2007.
3 | FHO Partners
4. MARKET WATCH | THIRD QUARTER 2009
OFFICE/R&D ABSORPTION / VACANCY 1999-YTD 2009 SUBURBAN OVERVIEW
Square Feet % Vacancy
10,000,000 30% The challenges in the economy are impacting the greater Boston suburban office and
80,00,000 27% R&D, though this downturn has been much less severe than the bursting of the technology
6,000,000 24% and internet bubble in 2001 and 2002. Given the turmoil in the economy, the amount of
4,000,000 21% available suburban office and R&D space, while high, has remained relatively stable dur-
2,000,000 18% ing 2009. Leasing activity is largely being fueled by tenants seeking to renew or capitalize
0 15% on reduced rental rates by relocating to a more desirable location. Recently completed
-2,000,000 12% new development has provided a high quality option for tenants seeking large blocks of
-4,000,000 9% space or newer building, though further construction is unlikely to occur in the short term.
-6,000,000 6%
-8,000,000
Net Absorption
3% The suburbs experienced an increase in the overall amount of office and R&D space
Vacancy Rate
-10,000,000 0%
available in the third quarter, pushing the availability rate up slightly to 24.6%. The
1999 2000 2001 2002 2003 2004 2005 2006 2007 2008 YTD
2009
amount of sublease space on the market decreased in the third quarter by 128,486
square feet.
The suburbs experienced 630,477 square feet of negative absorption this quarter, of
which 564,792 square feet was R&D space.
OFFICE MARKET HIGHLIGHTS
The biggest increase in available space in the second quarter was in the 495 North
Inventory 126,691,870 SF submarket, pushing the availability rate to a suburbs high 30.4%, resulting in 605,851
Availability Rate 24.6% square feet of negative absorption this quarter.
Net Absorption YTD 2009 (3,483,369) SF
One of the largest blocks of space made available in the suburbs in the third quarter
Average Asking Rent $12.00-$38.00/SF was 140,000 square feet at One Park West in Tewksbury.
The average asking rental rate for office space in the suburbs overall continued to de-
crease from $24.18 per square foot in July to $23.82 per square foot; for R&D space
average asking rental rates remained flat at $10.70 square foot.
OFFICE/R&D RENTAL RATES Development projects in the suburbs such as the Polaroid redevelopment in Waltham
$60
and Westwood Station have come to a standstill as the inability to obtain funding, large
amount of available space and declining rental rates negatively impact project feasibil-
ity.
$45
MARKET MAKERS
Alkermes leased 100,235 square feet at 850 Winter Street in Waltham.
$30
Covidien leased 71,000 square feet of office space at 15 Crosby Drive in Bedford.
$15
TechTarget leased 88,000 square feet at 275 Grove Street in Newton.
HISTORICAL PERSPECTIVE
$0
2004 2005 2006 2007 2008 YTD 2009 From 2000 to 2001, the percentage of office space available for lease skyrocketed from
7.2% to 21.0%, peaking in 2003 at 26.3%. Currently, the amount of office space avail-
able in the suburbs is 22.3%, a far less dramatic increase from the low point of 17.1%
at the end of 2007.
DEVELOPMENT PROJECTS
175-185 Wyman Street, Waltham 320,000 SF
10 Corporate Drive, Burlington 107,000 SF
4 | FHO Partners
5. MARKET WATCH | THIRD QUARTER 2009
MARKET SUMMARY
MARKET TOTAL TOTAL AVAILABILITY TOTAL VACANCY YTD 2009 NET DIRECT WEIGHTED
INVENTORY AVAILABLE RATE VACANT RATE ABSORPTION AVG. RENT
BOSTON OFFICE 58,261,767 9,559,660 16.4% 5,593,241 9.6% (1,819,878) $42.84
Back Bay 12,182,324 1,832,580 15.0% 1,103,692 9.1% (423,697) $46.04
Charlestown 1,539,942 189,971 12.3% 121,321 7.9% 14,557 $24.32
Fenway 1,911,890 49,130 2.6% 42,630 2.2% 8,309 $22.87
Financial District 27,884,165 5,240,862 18.8% 2,995,898 10.7% (1,012,410) $45.90
Government Center 1,878,278 426,604 22.7% 118,095 6.3% (312,379) $35.55
Midtown 1,872,209 183,346 9.8% 154,476 8.3% (15,817) $27.86
North Station 1,633,118 233,355 14.3% 154,562 9.5% (33,839) $32.72
South Boston Waterfront 5,275,761 1,107,135 21.0% 712,325 13.5% (247,889) $31.25
South Station 3,878,694 264,298 6.8% 157,863 4.1% 36,616 $36.39
CAMBRIDGE OFFICE 9,769,186 1,643,994 16.8% 1,063,703 10.9% (393,731) $38.42
Alewife/West Cambridge 1,714,404 320,142 18.7% 300,172 17.5% (10,954) $35.56
East Cambridge 6,160,198 1,106,511 18.0% 672,756 10.9% (250,594) $40.15
Mass Avenue Corridor 1,894,584 217,341 11.5% 90,775 4.8% (132,183) $38.42
CAMBRIDGE LAB 7,833,232 1,296,741 16.6% 1,296,741 14.7% 11,089 $51.14
Alewife/West Cambridge 677,311 210,571 31.1% 205,411 30.3% (1,309) $33.04
East Cambridge 4,534,266 749,298 16.5% 626,022 13.8% (32,470) $54.60
Mass Avenue Corridor 2,621,655 336,872 12.8% 3237231 12.3% 44,868 $56.74
SUBURBS OFFICE/R&D 126,691,870 31,204,972 24.6% 21,648,789 17.0% (3,483,369) $23.82
128 Central 40,735,920 9,317,396 22.9% 5,868,154 14.4% (991,809) $27.21
128 North 9,332,139 2,411,091 25.8% 2,051,543 22.0% 25,700 $19.69
128 South 14,493,301 3,367,423 23.2% 2,365,209 16.3% (492,839) $21.93
3/24 South 1,932,663 463,504 24.0% 421,147 21.8% (113,826) $21.44
495 Central 17,746,164 4,410,650 24.9% 3,105,670 17.5% (211,026) $21.23
495 North 31,692,713 9,620,311 30.4% 6,639,953 21.0% (1,318,251) $18.12
495 South 4,285,045 951,285 22.2% 688,358 16.1% (128,152) $20.13
Inner Suburbs 6,473,925 663,312 10.2% 508,755 7.9% (253,166) $24.66
TOTAL 202,556,055 43,705,367 21.6% 29,602,474 14.6% (5,685,889) $32.05
5 | FHO Partners