1. Day 1 Population and Sample.notebook March 05, 2013
AIM: Population and Samples
Do Now
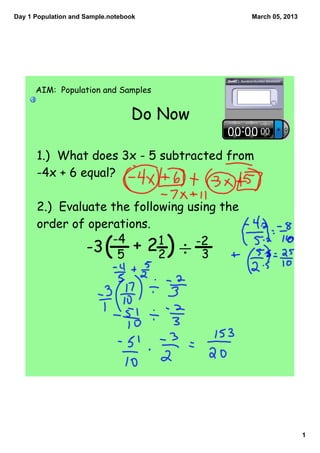
1.) What does 3x - 5 subtracted from
-4x + 6 equal?
2.) Evaluate the following using the
order of operations.
-4
-3 5 (
+ 22 1 -2
3 )÷
1
5. Day 1 Population and Sample.notebook March 05, 2013
Mr. Tjersland is running for President. You are his campaign
manager and you need to find out what percentage of the registered
voters in the country will vote for him. There are a few things you
could try.
Option I : Call all registered voters on the phone and ask them who
they will vote for.
Although this would provide a very accurate result, it would be a very
tedious and time consuming project. All registered voters represent
the population of interest here, and a better approach would be to use
a sample.
Option II : Call 4 registered voters, 1 in each time zone, and ask them
who they will vote for.
Although this is a very easy task, the results would not be very
reliable. To use a sample to make inferences about a population, the
sample should be representative of the population. How likely is it
that these 4 registered voters would represent the population of all
registered voters? Not very! The sample needs to look just like the
population, but smaller.
5
6. Day 1 Population and Sample.notebook March 05, 2013
You are a three term senator
from New York. You want to
run for President in 2016.
What do you have to do?
6
8. Day 1 Population and Sample.notebook March 05, 2013
2.) Read the following definitions:
a.) Population: The whole group you can collect data from.
b.) Sample: A part of a population.
8
9. Day 1 Population and Sample.notebook March 05, 2013
Anticipatory Set
Answer the following question in a complete sentence.
1.) Based on our class‛s data of favorite colors, can we assume
that this information is accurate for the entire school? Why or
why not?
9
10. Day 1 Population and Sample.notebook March 05, 2013
Identify the population and sample in each situation.
A.) A scientist is studying the diet of wolves in Yellowstone
National Park.
Population: Sample:
B.) The school librarian surveys 100 students about the types of
books they prefer.
Population: Sample:
C.) The decoration committee asks 25 seventh graders about
their ideas for a theme for the seventh grade dance.
Population: Sample:
10
12. Day 1 Population and Sample.notebook March 05, 2013
A marketing representative from a radio station is gathering
information from a local middle school about favorite musical
groups. State whether each sampling method is random. Explain, in
complete sentences.
D.) The representative questions the first 20 students who arrive
at school on Monday morning.
E.) The representative sends a survey to 50 students chosen in the
middle of a list of all students (listed alphabetically) provided by
the school.
12
13. Day 1 Population and Sample.notebook March 05, 2013
A marketing representative from a radio station is gathering
information from a local middle school about favorite musical
groups. State whether each sampling method is random. Explain, in
complete sentences.
F.) The representative puts all student names in a hat and selects
30 students to question.
G.) The manager of a department store conducts a survey about
customer satisfaction. She surveys 50 random shoppers who come
into the store on Saturday. What is the population? Is the
sampling method random? Explain.
13
14. Day 1 Population and Sample.notebook March 05, 2013
KEY QUESTION: What is the question you have to answer to
yourself to determine if a sample is random?
14
15. Day 1 Population and Sample.notebook March 05, 2013
BEFORE YOU LEAVE
1.) Why would it be difficult to obtain data from a random sample of
the population if the United States?
2.) How could you make it easier? What tools would you use?
15