2008 Publish Perish Poster
•
1 gefällt mir•241 views

Poster I presented in 2008 based on analysis performed with self-reported data from the 2004 Sigma Xi Postdoctoral Survey.
Empfohlen

Empfohlen
Weitere ähnliche Inhalte
Mehr von Emil Chuck
Mehr von Emil Chuck (16)
Kürzlich hochgeladen
Kürzlich hochgeladen (20)
2008 Publish Perish Poster
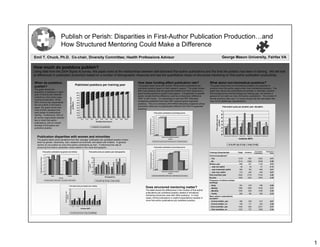
- 1. Publish or Perish: Disparities in First-Author Publication Production…and How Structured Mentoring Could Make a Difference Emil T. Chuck, Ph.D. Co-chair, Diversity Committee; Health Professions Advisor George Mason University, Fairfax VA How much do postdocs publish? Using data from the 2004 Sigma Xi survey, this paper looks at the relationships between self-disclosed first-author publications and the time the postdoc has been in training. We will look at differences in publication production based on a number of demographic measures and see the quantitative impact of structured mentoring on first-author publication productivity. When do postdocs How does funding affect publication rate? What about non-biomedical postdocs? Published postdocs per training year The graphs below show the number of first-author publications per The graph shows that non-biomedical postdocs are expected to publish? published postdoc based on their research support. The graph shows produce more first-author papers than most biomedical postdocs. The The graph shows the that most postdocs that are supported directly from their supervisor’s graph also shows the publications per postdoc in chemistry, physics, proportion of postdocs in each 100% grant funding tended to publish more papers. A breakdown of specific and ecology/environmental biology per training year, but women in year of training who disclose 90% grants reveals that this difference could be a disciplinary difference general do not claim as many first-author publications. The number of publishing a first-author peer- Percentage of cohort 80% (NSF vs NIH funds). It is interesting to note that NSF fellowship female postdocs after year 3 is small enough that the calculated ratio reviewed publication. While 70% receipients published more than NSF research-grant-supported may not be statistically representative. 38% of all survey respondents postdocs 60% postdocs. This is in contrast to NIH NRSA fellowship recipients whose did not publish a first-author 50% publication ratios are not significantly different from NIH R-supported First-author pubs per postdoc year: discipline paper, the graph shows that 40% postdocs.. most of them represent the 30% 7 early phase of postdoctoral 20% First-author publications by funding source training. Furthermore, 35% of 10% 6 First-author per pub 2.45 all survey respondents claimed 0% 5 First-author per pub postdoc 2.4 Y0-1 Y1-2 Y2-3 Y3-4 Y4-5 Y5-6 Y6-7 Y7-8 Y8-9 Y9-10 two or more first-author postdoc Postdoctoral tenure 2.35 4 publications, with an overall 2.3 average of 2.3 papers per 2.25 3 Published Unpublished published postdoc. 2.2 2 2.15 2.1 1 2.05 0 Publication disparities with women and minorities 2 Chem istry (M) Chem istry (F) Physics (M) Physics (F) Ecol Ev Bio (M) Ecol Ev Bio (F) Papers per published postdoc Gender Institute (M/F) The graphs below show deviations from this “average” publication per published postdoc broken PI grant Consortium grant Fellowship grant Institution/employer down by gender, citizenship, race, research environment, and status with children. In general women do not publish as many first-author publications as men. Furthermore the rate of 0-1y 1-2y 2-3y 3-4y 4-5y producing first-author publication varies based on the racial demographic. First-author publications by funding source 4.5 First-author publications by gender and children First-author pubs per postdoc year: demographics First-author Publication Training Characteristic Total Published First-author per pub postdoc 4 Publications Ratio 3 3.5 Formal evaluations? First-author per pub postdoc 3 3.5 2.5 2.5 …Yes 1219 804 2022 2.51 3 First-author per pub 2 2 …No 3714 2269 5436 2.40 2.5 1.5 Written plan 669 421 1109 2.63 postdoc 1.5 2 1 1.5 … was not useful 40 24 51 2.13 1 0.5 1 0 … was somewhat useful 292 183 460 2.51 0.5 0.5 Papers per published postdoc … was very useful 314 204 545 2.67 Gender 0 0 African-Am Hispanic/Lat Native Am Pac Isl Am Asian Am Caucasian NIH R grant NIH NRSA NSF R grant NSF fellowship Foundation Oral unwritten plan 3520 2179 5192 2.38 Male Female Demographics Gender No plan 1646 1043 2554 2.45 All US resident Other citizen No children With children 0-1y 1-2y 2-3y 3-4y 4-5y Frequency of advisor-trainee meetings First-author pubs per postdoc year: institute …Daily 391 279 798 2.86 Does structured mentoring matter? …Weekly 1660 1056 2436 2.31 8 7 The table shows the differences in the number of first-author …Monthly 1045 629 1408 2.24 First-author per pub 6 publications per published postdoc related to formalized …Yearly 284 164 365 2.23 5 mentoring structures used with 2004 postdocs. In most postdoc 4 Were advisor expectations 3 cases, formal evaluations or explicit expectations resulted in included? 2 more first-author publications per published postdoc. …Formal written, yes 363 236 615 2.61 1 0 …Formal written, no 190 111 254 2.29 Governm ent Governm ent Public Ac (M) Public Ac (F) Private Ac (M) Private Ac (F) (M) (F) ...Oral unwritten, yes 1452 924 2231 2.41 Institute (M/F) …Oral unwritten, no 1233 727 1628 2.24 0-1y 1-2y 2-3y 3-4y 4-5y 5-6y 1