SlideShare ist ein Scribd-Unternehmen logo
1 von 3
Downloaden Sie, um offline zu lesen
MLS Sales Statistics
Number of Sales
    360 375 15 4.17%   1970 2165 195 9.90%
    MONTH OF # %   YEAR # %
Big   June Increase / Increase /   TO DATE Increase / Increase /
Island   2013 2014 <Decrease> <Decrease>   2013 2014 <Decrease> <Decrease>
ENTIRE
Residential 177 170 <7> <3.95%>   899 920 21 2.34%
Vacant Land 118 148 30 25.42%   747 870 123 16.47%
Commercial 2 3 1 50.00%   10 16 6 60.00%
Condominium 62 53 <9> <14.52%>   312 353 41 13.14%
Business 1 1 0 0.00%   2 6 4 200.00%
PUNA
Residential 46 63 17 36.96%   247 322 75 30.36%
Vacant Land 65 88 23 35.38%   417 534 117 28.06%
Commercial 0 1 1 #DIV/0   1 4 3 300.00%
Condominium 0 0 0     0 0 0  
Business 1 0 <1> <#DIV/0%>   1 2 1 100.00%
SOUTH HILO
Residential 20 21 1 5.00%   117 115 <2> <1.71%>
Vacant Land 12 11 <1> <8.33%>   46 49 3 6.52%
Commercial 1 1 0 0.00%   6 5 <1> <16.67%>
Condominium 8 6 <2> <25.00%>   27 29 2 7.41%
Business 0 1 1 #DIV/0   1 4 3 300.00%
NORTH HILO
Residential 1 2 1 100.00%   13 15 2 15.38%
Vacant Land 0 1 1 #DIV/0   7 4 <3> <42.86%>
Commercial 0 0 0     0 0 0  
Condominium 0 0 0     0 0 0  
Business 0 0 0     0 0 0  
HAMAKUA
Residential 6 3 <3> <50.00%>   23 16 <7> <30.43%>
Vacant Land 2 1 <1> <50.00%>   11 4 <7> <63.64%>
Commercial 0 1 1 #DIV/0   0 2 2 #DIV/0
Condominium 0 0 0     0 0 0  
Business 0 0 0     0 0 0  
NORTH
KOHALA
Residential 4 5 1 25.00%   37 34 <3> <8.11%>
Vacant Land 5 5 0 0.00%   28 20 <8> <28.57%>
Commercial 0 0 0     0 4 4 #DIV/0
Condominium 0 0 0     0 0 0  
Business 0 0 0     0 0 0  
SOUTH
KOHALA
Residential 22 19 <3> <13.64%>   113 100 <13> <11.50%>
Vacant Land 6 1 <5> <83.33%>   31 24 <7> <22.58%>
Commercial 1 0 <1> <#DIV/0%>   1 0 <1> <#DIV/0%>
Condominium 14 18 4 28.57%   93 118 25 26.88%
Business 0 0 0     0 0 0  
NORTH KONA
Residential 61 34 <27> <44.26%>   260 215 <45> <17.31%>
Vacant Land 12 23 11 91.67%   87 90 3 3.45%
Commercial 0 0 0     1 1 0 0.00%
Condominium 39 29 <10> <25.64%>   191 203 12 6.28%
Business 0 0 0     0 0 0  
SOUTH KONA
Residential 6 8 2 33.33%   39 36 <3> <7.69%>
Vacant Land 3 3 0 0.00%   21 32 11 52.38%
Commercial 0 0 0     1 0 <1> <#DIV/0%>
Condominium 0 0 0     0 0 0  
Business 0 0 0     0 0 0  
KA'U
Residential 11 15 4 36.36%   50 67 17 34.00%
Vacant Land 13 15 2 15.38%   99 113 14 14.14%
Commercial 0 0 0     0 0 0  
Condominium 1 0 <1> <#DIV/0%>   1 3 2 200.00%
Business 0 0 0     0 0 0  
This information has been supplied by third parties and has not been independently verified by Hawaii Information Service
and is, therefore, not guaranteed.
  Copyright ©7/22/2014 by Hawaii Information Service  
MLS Sales Statistics
Sales Volume
    132,638,523 111,838,085 <20,800,438> <15.68%>   772,583,327 761,959,404 <10,623,923> <1.38%>
    MONTH OF # %   YEAR # %
Big   June Increase / Increase /   TO DATE Increase / Increase /
Island   2013 2014 <Decrease> <Decrease>   2013 2014 <Decrease> <Decrease>
ENTIRE
Residential 90,111,915 64,500,551 <25,611,364> <28.42%>   448,923,657 467,917,886 18,994,229 4.23%
Vacant Land 18,156,100 18,626,190 470,090 2.59%   165,054,620 125,838,793 <39,215,827> <23.76%>
Commercial 284,900 705,000 420,100 147.46%   4,690,700 8,036,250 3,345,550 71.32%
Condominium 23,385,608 27,981,344 4,595,736 19.65%   152,364,350 159,649,975 7,285,625 4.78%
Business 700,000 25,000 <675,000> <96.43%>   1,550,000 516,500 <1,033,500> <66.68%>
PUNA
Residential 8,276,119 13,249,650 4,973,531 60.09%   43,728,342 62,769,339 19,040,997 43.54%
Vacant Land 1,839,600 2,133,323 293,723 15.97%   11,604,111 17,563,981 5,959,870 51.36%
Commercial 0 50,000 50,000 #DIV/0   200,000 965,000 765,000 382.50%
Condominium 0 0 0     0 0 0  
Business 700,000 0 <700,000> <#DIV/0%>   700,000 155,000 <545,000> <77.86%>
SOUTH HILO
Residential 5,720,999 7,189,450 1,468,451 25.67%   35,848,387 37,751,550 1,903,163 5.31%
Vacant Land 2,660,900 2,055,500 <605,400> <22.75%>   9,429,710 9,101,000 <328,710> <3.49%>
Commercial 240,000 235,000 <5,000> <2.08%>   2,535,800 1,339,000 <1,196,800> <47.20%>
Condominium 571,400 970,000 398,600 69.76%   2,604,550 4,023,200 1,418,650 54.47%
Business 0 25,000 25,000 #DIV/0   850,000 361,500 <488,500> <57.47%>
NORTH HILO
Residential 595,000 739,000 144,000 24.20%   3,907,500 12,057,500 8,150,000 208.57%
Vacant Land 0 199,000 199,000 #DIV/0   1,642,000 849,000 <793,000> <48.29%>
Commercial 0 0 0     0 0 0  
Condominium 0 0 0     0 0 0  
Business 0 0 0     0 0 0  
HAMAKUA
Residential 3,131,000 936,500 <2,194,500> <70.09%>   10,742,999 5,533,250 <5,209,749> <48.49%>
Vacant Land 360,000 68,000 <292,000> <81.11%>   3,392,500 1,218,000 <2,174,500> <64.10%>
Commercial 0 420,000 420,000 #DIV/0   0 760,000 760,000 #DIV/0
Condominium 0 0 0     0 0 0  
Business 0 0 0     0 0 0  
NORTH
KOHALA
Residential 2,120,000 4,852,500 2,732,500 128.89%   21,420,900 28,405,000 6,984,100 32.60%
Vacant Land 5,236,900 2,872,500 <2,364,400> <45.15%>   12,804,514 8,701,900 <4,102,614> <32.04%>
Commercial 0 0 0     0 3,047,250 3,047,250 #DIV/0
Condominium 0 0 0     0 0 0  
Business 0 0 0     0 0 0  
SOUTH
KOHALA
Residential 17,214,000 11,527,446 <5,686,554> <33.03%>   73,262,188 66,025,003 <7,237,185> <9.88%>
Vacant Land 1,712,500 590,000 <1,122,500> <65.55%>   16,328,000 20,343,500 4,015,500 24.59%
Commercial 44,900 0 <44,900> <#DIV/0%>   44,900 0 <44,900> <#DIV/0%>
Condominium 7,003,899 10,086,500 3,082,601 44.01%   52,594,294 66,955,975 14,361,681 27.31%
Business 0 0 0     0 0 0  
NORTH KONA
Residential 48,971,797 19,747,400 <29,224,397> <59.68%>   237,620,650 228,217,489 <9,403,161> <3.96%>
Vacant Land 5,066,800 9,500,167 4,433,367 87.50%   101,657,650 60,005,562 <41,652,088> <40.97%>
Commercial 0 0 0     10,000 1,925,000 1,915,000 19150.00%
Condominium 15,610,309 16,924,844 1,314,535 8.42%   96,965,506 88,195,800 <8,769,706> <9.04%>
Business 0 0 0     0 0 0  
SOUTH KONA
Residential 2,428,000 3,102,000 674,000 27.76%   14,454,016 14,819,200 365,184 2.53%
Vacant Land 689,500 955,200 265,700 38.54%   4,092,000 6,259,700 2,167,700 52.97%
Commercial 0 0 0     1,900,000 0 <1,900,000> <#DIV/0%>
Condominium 0 0 0     0 0 0  
Business 0 0 0     0 0 0  
KA'U
Residential 1,655,000 3,156,605 1,501,605 90.73%   7,938,675 12,339,555 4,400,880 55.44%
Vacant Land 589,900 252,500 <337,400> <57.20%>   4,104,135 1,796,150 <2,307,985> <56.24%>
Commercial 0 0 0     0 0 0  
Condominium 200,000 0 <200,000> <#DIV/0%>   200,000 475,000 275,000 137.50%
Business 0 0 0     0 0 0  
This information has been supplied by third parties and has not been independently verified by Hawaii Information Service
and is, therefore, not guaranteed.
  Copyright ©7/22/2014 by Hawaii Information Service  
MLS Sales Statistics
Median Sales Price
    1,415,450 853,000 <562,450> <39.74%>   1,573,000 1,023,500 <549,500> <34.93%>
    MONTH OF # %   YEAR # %
Big   June Increase / Increase /   TO DATE Increase / Increase /
Island   2013 2014 <Decrease> <Decrease>   2013 2014 <Decrease> <Decrease>
ENTIRE
Residential 350,000 300,000 <50,000> <14.29%>   297,000 310,500 13,500 4.55%
Vacant Land 27,000 25,000 <2,000> <7.41%>   26,500 24,250 <2,250> <8.49%>
Commercial 142,450 235,000 92,550 64.97%   220,000 325,000 105,000 47.73%
Condominium 196,000 268,000 72,000 36.73%   254,500 295,000 40,500 15.91%
Business 700,000 25,000 <675,000> <96.43%>   775,000 68,750 <706,250> <91.13%>
PUNA
Residential 168,000 200,000 32,000 19.05%   159,000 175,000 16,000 10.06%
Vacant Land 16,000 17,950 1,950 12.19%   19,000 19,000 0 0.00%
Commercial 0 50,000 50,000 #DIV/0   200,000 207,500 7,500 3.75%
Condominium 0 0 0     0 0 0  
Business 700,000 0 <700,000> <#DIV/0%>   700,000 77,500 <622,500> <88.93%>
SOUTH HILO
Residential 247,500 285,000 37,500 15.15%   269,000 270,000 1,000 0.37%
Vacant Land 175,000 165,000 <10,000> <5.71%>   164,905 167,000 2,095 1.27%
Commercial 240,000 235,000 <5,000> <2.08%>   307,500 239,000 <68,500> <22.28%>
Condominium 60,750 125,000 64,250 105.76%   96,500 115,000 18,500 19.17%
Business 0 25,000 25,000 #DIV/0   850,000 68,750 <781,250> <91.91%>
NORTH HILO
Residential 595,000 369,500 <225,500> <37.90%>   260,000 429,000 169,000 65.00%
Vacant Land 0 199,000 199,000 #DIV/0   215,000 187,000 <28,000> <13.02%>
Commercial 0 0 0     0 0 0  
Condominium 0 0 0     0 0 0  
Business 0 0 0     0 0 0  
HAMAKUA
Residential 384,000 295,000 <89,000> <23.18%>   338,000 320,500 <17,500> <5.18%>
Vacant Land 180,000 68,000 <112,000> <62.22%>   265,000 337,500 72,500 27.36%
Commercial 0 420,000 420,000 #DIV/0   0 380,000 380,000 #DIV/0
Condominium 0 0 0     0 0 0  
Business 0 0 0     0 0 0  
NORTH
KOHALA
Residential 562,500 525,000 <37,500> <6.67%>   525,000 615,000 90,000 17.14%
Vacant Land 646,000 550,000 <96,000> <14.86%>   329,557 355,000 25,443 7.72%
Commercial 0 0 0     0 404,750 404,750 #DIV/0
Condominium 0 0 0     0 0 0  
Business 0 0 0     0 0 0  
SOUTH
KOHALA
Residential 387,500 453,000 65,500 16.90%   385,000 440,000 55,000 14.29%
Vacant Land 178,750 590,000 411,250 230.07%   170,000 312,500 142,500 83.82%
Commercial 44,900 0 <44,900> <#DIV/0%>   44,900 0 <44,900> <#DIV/0%>
Condominium 340,500 507,500 167,000 49.05%   425,000 467,500 42,500 10.00%
Business 0 0 0     0 0 0  
NORTH KONA
Residential 452,500 510,000 57,500 12.71%   450,000 527,500 77,500 17.22%
Vacant Land 140,000 277,600 137,600 98.29%   195,000 269,000 74,000 37.95%
Commercial 0 0 0     10,000 1,925,000 1,915,000 19150.00%
Condominium 195,000 259,000 64,000 32.82%   235,000 267,000 32,000 13.62%
Business 0 0 0     0 0 0  
SOUTH KONA
Residential 374,000 309,500 <64,500> <17.25%>   315,000 352,500 37,500 11.90%
Vacant Land 155,000 52,200 <102,800> <66.32%>   156,000 113,500 <42,500> <27.24%>
Commercial 0 0 0     1,900,000 0 <1,900,000> <#DIV/0%>
Condominium 0 0 0     0 0 0  
Business 0 0 0     0 0 0  
KA'U
Residential 120,000 175,000 55,000 45.83%   142,000 160,000 18,000 12.68%
Vacant Land 22,000 17,500 <4,500> <20.45%>   15,000 9,500 <5,500> <36.67%>
Commercial 0 0 0     0 0 0  
Condominium 200,000 0 <200,000> <#DIV/0%>   200,000 165,000 <35,000> <17.50%>
Business 0 0 0     0 0 0  
This information has been supplied by third parties and has not been independently verified by Hawaii Information Service
and is, therefore, not guaranteed.
  Copyright ©7/22/2014 by Hawaii Information Service  

Weitere ähnliche Inhalte

Was ist angesagt? (7)

Sales tax examples presentation
Sales tax examples presentationSales tax examples presentation
Sales tax examples presentation
 
Beyond financial accounting part i
Beyond financial accounting part iBeyond financial accounting part i
Beyond financial accounting part i
 
Market Watch TORONTO 2015 OCTOBER
Market Watch TORONTO 2015 OCTOBERMarket Watch TORONTO 2015 OCTOBER
Market Watch TORONTO 2015 OCTOBER
 
Financial_analysis_CTc
Financial_analysis_CTcFinancial_analysis_CTc
Financial_analysis_CTc
 
Apresentação 3Q13 EN
Apresentação 3Q13 ENApresentação 3Q13 EN
Apresentação 3Q13 EN
 
Market Watch APRIL 2015
Market Watch APRIL 2015Market Watch APRIL 2015
Market Watch APRIL 2015
 
SLCPD CompStat no.52 (week ending 12-31-17)
SLCPD CompStat no.52 (week ending 12-31-17)SLCPD CompStat no.52 (week ending 12-31-17)
SLCPD CompStat no.52 (week ending 12-31-17)
 

Ähnlich wie Big Island Real Estate Statistics/Sales June 2014

Realisasi dipa mar jun 2011
Realisasi dipa mar jun 2011Realisasi dipa mar jun 2011
Realisasi dipa mar jun 2011
pamedan
 
Pricing for profit
Pricing for profitPricing for profit
Pricing for profit
Azure Group
 

Ähnlich wie Big Island Real Estate Statistics/Sales June 2014 (20)

delaura 03 restaurant-projections 1
delaura 03 restaurant-projections 1delaura 03 restaurant-projections 1
delaura 03 restaurant-projections 1
 
Fy 2008 Expenditures By Department
Fy 2008 Expenditures By DepartmentFy 2008 Expenditures By Department
Fy 2008 Expenditures By Department
 
The Okanagan Statistics Package January 2022
The Okanagan Statistics Package January 2022The Okanagan Statistics Package January 2022
The Okanagan Statistics Package January 2022
 
Realisasi dipa mar jun 2011
Realisasi dipa mar jun 2011Realisasi dipa mar jun 2011
Realisasi dipa mar jun 2011
 
delaura 01 restaurant-projections 1
delaura 01 restaurant-projections 1delaura 01 restaurant-projections 1
delaura 01 restaurant-projections 1
 
Income Statement Prediction
Income Statement Prediction Income Statement Prediction
Income Statement Prediction
 
January 2023 Okanagan Statistics with charts and graphs
January 2023 Okanagan Statistics with charts and graphsJanuary 2023 Okanagan Statistics with charts and graphs
January 2023 Okanagan Statistics with charts and graphs
 
Assignment - Financial Appraisal
Assignment - Financial AppraisalAssignment - Financial Appraisal
Assignment - Financial Appraisal
 
Project Management and Development Economics Project (DE)
Project Management and Development Economics Project (DE)Project Management and Development Economics Project (DE)
Project Management and Development Economics Project (DE)
 
Senario Analysis for Risk management in Corporate Finance
Senario Analysis for Risk management in Corporate FinanceSenario Analysis for Risk management in Corporate Finance
Senario Analysis for Risk management in Corporate Finance
 
Ingresos 2013
Ingresos 2013Ingresos 2013
Ingresos 2013
 
Okanagan Statistics November 2022
Okanagan Statistics November 2022 Okanagan Statistics November 2022
Okanagan Statistics November 2022
 
Ingresos 2010
Ingresos 2010Ingresos 2010
Ingresos 2010
 
Ingresos 2011
Ingresos 2011Ingresos 2011
Ingresos 2011
 
Daily report 6 nov
Daily report 6 novDaily report 6 nov
Daily report 6 nov
 
Financial model
Financial modelFinancial model
Financial model
 
Pricing for profit
Pricing for profitPricing for profit
Pricing for profit
 
bKash equity valuation 2018
bKash equity valuation 2018bKash equity valuation 2018
bKash equity valuation 2018
 
Okanagan Stats - October 2022.pdf
Okanagan Stats - October 2022.pdfOkanagan Stats - October 2022.pdf
Okanagan Stats - October 2022.pdf
 
February 2022 Okanagan Real Estate Board Statistics Package With Charts & Graphs
February 2022 Okanagan Real Estate Board Statistics Package With Charts & GraphsFebruary 2022 Okanagan Real Estate Board Statistics Package With Charts & Graphs
February 2022 Okanagan Real Estate Board Statistics Package With Charts & Graphs
 

Mehr von Eric West

Sotheby's International Realty Overview 2014
Sotheby's International Realty Overview 2014Sotheby's International Realty Overview 2014
Sotheby's International Realty Overview 2014
Eric West
 
Fsir listing presentation 2014 eric west
Fsir listing presentation 2014 eric westFsir listing presentation 2014 eric west
Fsir listing presentation 2014 eric west
Eric West
 
The overview 2014-2_domestic
The overview 2014-2_domesticThe overview 2014-2_domestic
The overview 2014-2_domestic
Eric West
 
Maui Stats April 2014
Maui Stats April 2014Maui Stats April 2014
Maui Stats April 2014
Eric West
 

Mehr von Eric West (20)

2018 19 Elite Pacific Buyer's Guide
2018 19 Elite Pacific Buyer's Guide2018 19 Elite Pacific Buyer's Guide
2018 19 Elite Pacific Buyer's Guide
 
Sotheby's Marketing Plan 2015
Sotheby's Marketing Plan 2015Sotheby's Marketing Plan 2015
Sotheby's Marketing Plan 2015
 
Maui County Zoning & flood confirmation request form
Maui County Zoning & flood confirmation request formMaui County Zoning & flood confirmation request form
Maui County Zoning & flood confirmation request form
 
Hawaii Real Estate 2014 statistics trends sale report All Islands Hawaii Big ...
Hawaii Real Estate 2014 statistics trends sale report All Islands Hawaii Big ...Hawaii Real Estate 2014 statistics trends sale report All Islands Hawaii Big ...
Hawaii Real Estate 2014 statistics trends sale report All Islands Hawaii Big ...
 
Sotheby's International Realty Overview 2014
Sotheby's International Realty Overview 2014Sotheby's International Realty Overview 2014
Sotheby's International Realty Overview 2014
 
Sotheby's Farm and Ranch Listing presentation 2014 eric west
Sotheby's Farm and Ranch Listing presentation 2014 eric westSotheby's Farm and Ranch Listing presentation 2014 eric west
Sotheby's Farm and Ranch Listing presentation 2014 eric west
 
Fsir listing presentation 2014 eric west
Fsir listing presentation 2014 eric westFsir listing presentation 2014 eric west
Fsir listing presentation 2014 eric west
 
Notable sales sotheby's_farm_and_ranch
Notable sales sotheby's_farm_and_ranchNotable sales sotheby's_farm_and_ranch
Notable sales sotheby's_farm_and_ranch
 
Luxury home sotheby's listing presentation 2014 update
Luxury home sotheby's listing presentation 2014 update Luxury home sotheby's listing presentation 2014 update
Luxury home sotheby's listing presentation 2014 update
 
Oahu real-estate-statistics-monthly-update-june2014
Oahu real-estate-statistics-monthly-update-june2014Oahu real-estate-statistics-monthly-update-june2014
Oahu real-estate-statistics-monthly-update-june2014
 
Maui REAL ESTATE stats all may 2014
Maui REAL ESTATE stats all may 2014Maui REAL ESTATE stats all may 2014
Maui REAL ESTATE stats all may 2014
 
Sotheby's Farm and Ranch, Luxury Home Listing Presentation
Sotheby's Farm and Ranch, Luxury Home Listing PresentationSotheby's Farm and Ranch, Luxury Home Listing Presentation
Sotheby's Farm and Ranch, Luxury Home Listing Presentation
 
The overview 2014-2_domestic
The overview 2014-2_domesticThe overview 2014-2_domestic
The overview 2014-2_domestic
 
Oahu real-estate-statistics-monthly-update-apr2014
Oahu real-estate-statistics-monthly-update-apr2014Oahu real-estate-statistics-monthly-update-apr2014
Oahu real-estate-statistics-monthly-update-apr2014
 
Maui Stats April 2014
Maui Stats April 2014Maui Stats April 2014
Maui Stats April 2014
 
Big Island Real Esate Report-january-31-2013 Statistics, Trends, Sales, Kona
Big Island Real Esate Report-january-31-2013 Statistics, Trends, Sales, KonaBig Island Real Esate Report-january-31-2013 Statistics, Trends, Sales, Kona
Big Island Real Esate Report-january-31-2013 Statistics, Trends, Sales, Kona
 
Launiupoko Plat Map Overview Maui Real Estate
Launiupoko Plat Map Overview Maui Real EstateLauniupoko Plat Map Overview Maui Real Estate
Launiupoko Plat Map Overview Maui Real Estate
 
Launiupoko HOA By-Laws
Launiupoko HOA By-LawsLauniupoko HOA By-Laws
Launiupoko HOA By-Laws
 
LAUNIUPOKO Covenants CC&R's
LAUNIUPOKO Covenants CC&R'sLAUNIUPOKO Covenants CC&R's
LAUNIUPOKO Covenants CC&R's
 
2013 Maui Hawaii Real Estate Statistics
2013 Maui Hawaii Real Estate Statistics2013 Maui Hawaii Real Estate Statistics
2013 Maui Hawaii Real Estate Statistics
 

Kürzlich hochgeladen

Low Rate ✨➥9582086666▻✨Call Girls In Gurgaon Sector 21 (Gurgaon)
Low Rate ✨➥9582086666▻✨Call Girls In Gurgaon Sector 21 (Gurgaon)Low Rate ✨➥9582086666▻✨Call Girls In Gurgaon Sector 21 (Gurgaon)
Low Rate ✨➥9582086666▻✨Call Girls In Gurgaon Sector 21 (Gurgaon)
delhi24hrs1
 
Acibadem Konaklari Uskudar - Listin Turkey
Acibadem Konaklari Uskudar - Listin TurkeyAcibadem Konaklari Uskudar - Listin Turkey
Acibadem Konaklari Uskudar - Listin Turkey
Listing Turkey
 
Call girls in Shakti Nagar Delhi~8447779280°/=@/ Short 1500 Night 6000}ESCORT...
Call girls in Shakti Nagar Delhi~8447779280°/=@/ Short 1500 Night 6000}ESCORT...Call girls in Shakti Nagar Delhi~8447779280°/=@/ Short 1500 Night 6000}ESCORT...
Call girls in Shakti Nagar Delhi~8447779280°/=@/ Short 1500 Night 6000}ESCORT...
asmaqueen5
 
Call girls In Rana Pratap Bagh {Delhi ↫8447779280↬Escort Service (Delhi)
Call girls In Rana Pratap Bagh {Delhi ↫8447779280↬Escort Service (Delhi)Call girls In Rana Pratap Bagh {Delhi ↫8447779280↬Escort Service (Delhi)
Call girls In Rana Pratap Bagh {Delhi ↫8447779280↬Escort Service (Delhi)
asmaqueen5
 
Cheap Rate ✨➥9582086666▻✨Call Girls In Gurgaon Sector 1 (Gurgaon)
Cheap Rate ✨➥9582086666▻✨Call Girls In Gurgaon Sector 1 (Gurgaon)Cheap Rate ✨➥9582086666▻✨Call Girls In Gurgaon Sector 1 (Gurgaon)
Cheap Rate ✨➥9582086666▻✨Call Girls In Gurgaon Sector 1 (Gurgaon)
delhi24hrs1
 
Low Density Living New Project in BPTP THE AMAARIO Sector 37D Gurgaon Haryana...
Low Density Living New Project in BPTP THE AMAARIO Sector 37D Gurgaon Haryana...Low Density Living New Project in BPTP THE AMAARIO Sector 37D Gurgaon Haryana...
Low Density Living New Project in BPTP THE AMAARIO Sector 37D Gurgaon Haryana...
ApartmentWala1
 
Low rate ↬Call girls in Sabzi Mandi Delhi | 8447779280}Escort Service In All ...
Low rate ↬Call girls in Sabzi Mandi Delhi | 8447779280}Escort Service In All ...Low rate ↬Call girls in Sabzi Mandi Delhi | 8447779280}Escort Service In All ...
Low rate ↬Call girls in Sabzi Mandi Delhi | 8447779280}Escort Service In All ...
asmaqueen5
 
Call Girls In Sarai Rohilla ☎️8447779280{Sarai Rohilla Escort Service In Delh...
Call Girls In Sarai Rohilla ☎️8447779280{Sarai Rohilla Escort Service In Delh...Call Girls In Sarai Rohilla ☎️8447779280{Sarai Rohilla Escort Service In Delh...
Call Girls In Sarai Rohilla ☎️8447779280{Sarai Rohilla Escort Service In Delh...
asmaqueen5
 
Bptp The Amaario Launch Luxury Project Sector 37D Gurgaon Dwarka Expressway...
Bptp The Amaario Launch  Luxury Project  Sector 37D Gurgaon Dwarka Expressway...Bptp The Amaario Launch  Luxury Project  Sector 37D Gurgaon Dwarka Expressway...
Bptp The Amaario Launch Luxury Project Sector 37D Gurgaon Dwarka Expressway...
ApartmentWala1
 
Low Rate Call girls in Sant Nagar{Delhi }8447779280} Service Escorts In South...
Low Rate Call girls in Sant Nagar{Delhi }8447779280} Service Escorts In South...Low Rate Call girls in Sant Nagar{Delhi }8447779280} Service Escorts In South...
Low Rate Call girls in Sant Nagar{Delhi }8447779280} Service Escorts In South...
asmaqueen5
 
Low Rate ✨➥9711108085▻✨Call Girls In East Of Kailash (E.K) (Delhi)
Low Rate ✨➥9711108085▻✨Call Girls In East Of Kailash (E.K) (Delhi)Low Rate ✨➥9711108085▻✨Call Girls In East Of Kailash (E.K) (Delhi)
Low Rate ✨➥9711108085▻✨Call Girls In East Of Kailash (E.K) (Delhi)
delhi24hrs1
 

Kürzlich hochgeladen (20)

Best Interior Design Services in Haldwani
Best Interior Design Services in HaldwaniBest Interior Design Services in Haldwani
Best Interior Design Services in Haldwani
 
Low Rate ✨➥9582086666▻✨Call Girls In Gurgaon Sector 21 (Gurgaon)
Low Rate ✨➥9582086666▻✨Call Girls In Gurgaon Sector 21 (Gurgaon)Low Rate ✨➥9582086666▻✨Call Girls In Gurgaon Sector 21 (Gurgaon)
Low Rate ✨➥9582086666▻✨Call Girls In Gurgaon Sector 21 (Gurgaon)
 
Acibadem Konaklari Uskudar - Listin Turkey
Acibadem Konaklari Uskudar - Listin TurkeyAcibadem Konaklari Uskudar - Listin Turkey
Acibadem Konaklari Uskudar - Listin Turkey
 
Call girls in Shakti Nagar Delhi~8447779280°/=@/ Short 1500 Night 6000}ESCORT...
Call girls in Shakti Nagar Delhi~8447779280°/=@/ Short 1500 Night 6000}ESCORT...Call girls in Shakti Nagar Delhi~8447779280°/=@/ Short 1500 Night 6000}ESCORT...
Call girls in Shakti Nagar Delhi~8447779280°/=@/ Short 1500 Night 6000}ESCORT...
 
Call girls In Rana Pratap Bagh {Delhi ↫8447779280↬Escort Service (Delhi)
Call girls In Rana Pratap Bagh {Delhi ↫8447779280↬Escort Service (Delhi)Call girls In Rana Pratap Bagh {Delhi ↫8447779280↬Escort Service (Delhi)
Call girls In Rana Pratap Bagh {Delhi ↫8447779280↬Escort Service (Delhi)
 
Nyati Elite NIBM Road Pune E Brochure.pdf
Nyati Elite NIBM Road Pune E Brochure.pdfNyati Elite NIBM Road Pune E Brochure.pdf
Nyati Elite NIBM Road Pune E Brochure.pdf
 
Cheap Rate ✨➥9582086666▻✨Call Girls In Gurgaon Sector 1 (Gurgaon)
Cheap Rate ✨➥9582086666▻✨Call Girls In Gurgaon Sector 1 (Gurgaon)Cheap Rate ✨➥9582086666▻✨Call Girls In Gurgaon Sector 1 (Gurgaon)
Cheap Rate ✨➥9582086666▻✨Call Girls In Gurgaon Sector 1 (Gurgaon)
 
Prestige Sancoale Goa Residneces Brochure.pdf
Prestige Sancoale Goa Residneces Brochure.pdfPrestige Sancoale Goa Residneces Brochure.pdf
Prestige Sancoale Goa Residneces Brochure.pdf
 
Low Density Living New Project in BPTP THE AMAARIO Sector 37D Gurgaon Haryana...
Low Density Living New Project in BPTP THE AMAARIO Sector 37D Gurgaon Haryana...Low Density Living New Project in BPTP THE AMAARIO Sector 37D Gurgaon Haryana...
Low Density Living New Project in BPTP THE AMAARIO Sector 37D Gurgaon Haryana...
 
Low rate ↬Call girls in Sabzi Mandi Delhi | 8447779280}Escort Service In All ...
Low rate ↬Call girls in Sabzi Mandi Delhi | 8447779280}Escort Service In All ...Low rate ↬Call girls in Sabzi Mandi Delhi | 8447779280}Escort Service In All ...
Low rate ↬Call girls in Sabzi Mandi Delhi | 8447779280}Escort Service In All ...
 
Real Estate Finance and Investments (2019).pdf
Real Estate Finance and Investments (2019).pdfReal Estate Finance and Investments (2019).pdf
Real Estate Finance and Investments (2019).pdf
 
Call Girls In Sarai Rohilla ☎️8447779280{Sarai Rohilla Escort Service In Delh...
Call Girls In Sarai Rohilla ☎️8447779280{Sarai Rohilla Escort Service In Delh...Call Girls In Sarai Rohilla ☎️8447779280{Sarai Rohilla Escort Service In Delh...
Call Girls In Sarai Rohilla ☎️8447779280{Sarai Rohilla Escort Service In Delh...
 
SVN Live 5.6.24 Weekly Property Broadcast
SVN Live 5.6.24 Weekly Property BroadcastSVN Live 5.6.24 Weekly Property Broadcast
SVN Live 5.6.24 Weekly Property Broadcast
 
Bptp The Amaario Launch Luxury Project Sector 37D Gurgaon Dwarka Expressway...
Bptp The Amaario Launch  Luxury Project  Sector 37D Gurgaon Dwarka Expressway...Bptp The Amaario Launch  Luxury Project  Sector 37D Gurgaon Dwarka Expressway...
Bptp The Amaario Launch Luxury Project Sector 37D Gurgaon Dwarka Expressway...
 
Kohinoor Teiko Hinjewadi Phase 2 Pune E-Brochure.pdf
Kohinoor Teiko Hinjewadi Phase 2 Pune  E-Brochure.pdfKohinoor Teiko Hinjewadi Phase 2 Pune  E-Brochure.pdf
Kohinoor Teiko Hinjewadi Phase 2 Pune E-Brochure.pdf
 
Top tourism places in Dubai - Inch & Brick Realty
Top tourism places in Dubai - Inch & Brick RealtyTop tourism places in Dubai - Inch & Brick Realty
Top tourism places in Dubai - Inch & Brick Realty
 
Low Rate Call girls in Sant Nagar{Delhi }8447779280} Service Escorts In South...
Low Rate Call girls in Sant Nagar{Delhi }8447779280} Service Escorts In South...Low Rate Call girls in Sant Nagar{Delhi }8447779280} Service Escorts In South...
Low Rate Call girls in Sant Nagar{Delhi }8447779280} Service Escorts In South...
 
Housing Price Regulation Thesis Defense by Slidesgo.pptx
Housing Price Regulation Thesis Defense by Slidesgo.pptxHousing Price Regulation Thesis Defense by Slidesgo.pptx
Housing Price Regulation Thesis Defense by Slidesgo.pptx
 
Kalpataru Exquisite Wakad Pune E-Brochure.pdf
Kalpataru Exquisite Wakad Pune  E-Brochure.pdfKalpataru Exquisite Wakad Pune  E-Brochure.pdf
Kalpataru Exquisite Wakad Pune E-Brochure.pdf
 
Low Rate ✨➥9711108085▻✨Call Girls In East Of Kailash (E.K) (Delhi)
Low Rate ✨➥9711108085▻✨Call Girls In East Of Kailash (E.K) (Delhi)Low Rate ✨➥9711108085▻✨Call Girls In East Of Kailash (E.K) (Delhi)
Low Rate ✨➥9711108085▻✨Call Girls In East Of Kailash (E.K) (Delhi)
 

Big Island Real Estate Statistics/Sales June 2014

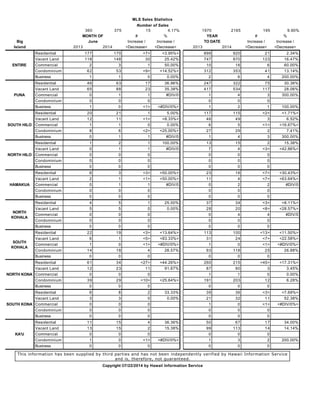
  • 1. MLS Sales Statistics Number of Sales     360 375 15 4.17%   1970 2165 195 9.90%     MONTH OF # %   YEAR # % Big   June Increase / Increase /   TO DATE Increase / Increase / Island   2013 2014 <Decrease> <Decrease>   2013 2014 <Decrease> <Decrease> ENTIRE Residential 177 170 <7> <3.95%>   899 920 21 2.34% Vacant Land 118 148 30 25.42%   747 870 123 16.47% Commercial 2 3 1 50.00%   10 16 6 60.00% Condominium 62 53 <9> <14.52%>   312 353 41 13.14% Business 1 1 0 0.00%   2 6 4 200.00% PUNA Residential 46 63 17 36.96%   247 322 75 30.36% Vacant Land 65 88 23 35.38%   417 534 117 28.06% Commercial 0 1 1 #DIV/0   1 4 3 300.00% Condominium 0 0 0     0 0 0   Business 1 0 <1> <#DIV/0%>   1 2 1 100.00% SOUTH HILO Residential 20 21 1 5.00%   117 115 <2> <1.71%> Vacant Land 12 11 <1> <8.33%>   46 49 3 6.52% Commercial 1 1 0 0.00%   6 5 <1> <16.67%> Condominium 8 6 <2> <25.00%>   27 29 2 7.41% Business 0 1 1 #DIV/0   1 4 3 300.00% NORTH HILO Residential 1 2 1 100.00%   13 15 2 15.38% Vacant Land 0 1 1 #DIV/0   7 4 <3> <42.86%> Commercial 0 0 0     0 0 0   Condominium 0 0 0     0 0 0   Business 0 0 0     0 0 0   HAMAKUA Residential 6 3 <3> <50.00%>   23 16 <7> <30.43%> Vacant Land 2 1 <1> <50.00%>   11 4 <7> <63.64%> Commercial 0 1 1 #DIV/0   0 2 2 #DIV/0 Condominium 0 0 0     0 0 0   Business 0 0 0     0 0 0   NORTH KOHALA Residential 4 5 1 25.00%   37 34 <3> <8.11%> Vacant Land 5 5 0 0.00%   28 20 <8> <28.57%> Commercial 0 0 0     0 4 4 #DIV/0 Condominium 0 0 0     0 0 0   Business 0 0 0     0 0 0   SOUTH KOHALA Residential 22 19 <3> <13.64%>   113 100 <13> <11.50%> Vacant Land 6 1 <5> <83.33%>   31 24 <7> <22.58%> Commercial 1 0 <1> <#DIV/0%>   1 0 <1> <#DIV/0%> Condominium 14 18 4 28.57%   93 118 25 26.88% Business 0 0 0     0 0 0   NORTH KONA Residential 61 34 <27> <44.26%>   260 215 <45> <17.31%> Vacant Land 12 23 11 91.67%   87 90 3 3.45% Commercial 0 0 0     1 1 0 0.00% Condominium 39 29 <10> <25.64%>   191 203 12 6.28% Business 0 0 0     0 0 0   SOUTH KONA Residential 6 8 2 33.33%   39 36 <3> <7.69%> Vacant Land 3 3 0 0.00%   21 32 11 52.38% Commercial 0 0 0     1 0 <1> <#DIV/0%> Condominium 0 0 0     0 0 0   Business 0 0 0     0 0 0   KA'U Residential 11 15 4 36.36%   50 67 17 34.00% Vacant Land 13 15 2 15.38%   99 113 14 14.14% Commercial 0 0 0     0 0 0   Condominium 1 0 <1> <#DIV/0%>   1 3 2 200.00% Business 0 0 0     0 0 0   This information has been supplied by third parties and has not been independently verified by Hawaii Information Service and is, therefore, not guaranteed.   Copyright ©7/22/2014 by Hawaii Information Service   MLS Sales Statistics Sales Volume     132,638,523 111,838,085 <20,800,438> <15.68%>   772,583,327 761,959,404 <10,623,923> <1.38%>     MONTH OF # %   YEAR # % Big   June Increase / Increase /   TO DATE Increase / Increase / Island   2013 2014 <Decrease> <Decrease>   2013 2014 <Decrease> <Decrease>
  • 2. and is, therefore, not guaranteed.   Copyright ©7/22/2014 by Hawaii Information Service   MLS Sales Statistics Sales Volume     132,638,523 111,838,085 <20,800,438> <15.68%>   772,583,327 761,959,404 <10,623,923> <1.38%>     MONTH OF # %   YEAR # % Big   June Increase / Increase /   TO DATE Increase / Increase / Island   2013 2014 <Decrease> <Decrease>   2013 2014 <Decrease> <Decrease> ENTIRE Residential 90,111,915 64,500,551 <25,611,364> <28.42%>   448,923,657 467,917,886 18,994,229 4.23% Vacant Land 18,156,100 18,626,190 470,090 2.59%   165,054,620 125,838,793 <39,215,827> <23.76%> Commercial 284,900 705,000 420,100 147.46%   4,690,700 8,036,250 3,345,550 71.32% Condominium 23,385,608 27,981,344 4,595,736 19.65%   152,364,350 159,649,975 7,285,625 4.78% Business 700,000 25,000 <675,000> <96.43%>   1,550,000 516,500 <1,033,500> <66.68%> PUNA Residential 8,276,119 13,249,650 4,973,531 60.09%   43,728,342 62,769,339 19,040,997 43.54% Vacant Land 1,839,600 2,133,323 293,723 15.97%   11,604,111 17,563,981 5,959,870 51.36% Commercial 0 50,000 50,000 #DIV/0   200,000 965,000 765,000 382.50% Condominium 0 0 0     0 0 0   Business 700,000 0 <700,000> <#DIV/0%>   700,000 155,000 <545,000> <77.86%> SOUTH HILO Residential 5,720,999 7,189,450 1,468,451 25.67%   35,848,387 37,751,550 1,903,163 5.31% Vacant Land 2,660,900 2,055,500 <605,400> <22.75%>   9,429,710 9,101,000 <328,710> <3.49%> Commercial 240,000 235,000 <5,000> <2.08%>   2,535,800 1,339,000 <1,196,800> <47.20%> Condominium 571,400 970,000 398,600 69.76%   2,604,550 4,023,200 1,418,650 54.47% Business 0 25,000 25,000 #DIV/0   850,000 361,500 <488,500> <57.47%> NORTH HILO Residential 595,000 739,000 144,000 24.20%   3,907,500 12,057,500 8,150,000 208.57% Vacant Land 0 199,000 199,000 #DIV/0   1,642,000 849,000 <793,000> <48.29%> Commercial 0 0 0     0 0 0   Condominium 0 0 0     0 0 0   Business 0 0 0     0 0 0   HAMAKUA Residential 3,131,000 936,500 <2,194,500> <70.09%>   10,742,999 5,533,250 <5,209,749> <48.49%> Vacant Land 360,000 68,000 <292,000> <81.11%>   3,392,500 1,218,000 <2,174,500> <64.10%> Commercial 0 420,000 420,000 #DIV/0   0 760,000 760,000 #DIV/0 Condominium 0 0 0     0 0 0   Business 0 0 0     0 0 0   NORTH KOHALA Residential 2,120,000 4,852,500 2,732,500 128.89%   21,420,900 28,405,000 6,984,100 32.60% Vacant Land 5,236,900 2,872,500 <2,364,400> <45.15%>   12,804,514 8,701,900 <4,102,614> <32.04%> Commercial 0 0 0     0 3,047,250 3,047,250 #DIV/0 Condominium 0 0 0     0 0 0   Business 0 0 0     0 0 0   SOUTH KOHALA Residential 17,214,000 11,527,446 <5,686,554> <33.03%>   73,262,188 66,025,003 <7,237,185> <9.88%> Vacant Land 1,712,500 590,000 <1,122,500> <65.55%>   16,328,000 20,343,500 4,015,500 24.59% Commercial 44,900 0 <44,900> <#DIV/0%>   44,900 0 <44,900> <#DIV/0%> Condominium 7,003,899 10,086,500 3,082,601 44.01%   52,594,294 66,955,975 14,361,681 27.31% Business 0 0 0     0 0 0   NORTH KONA Residential 48,971,797 19,747,400 <29,224,397> <59.68%>   237,620,650 228,217,489 <9,403,161> <3.96%> Vacant Land 5,066,800 9,500,167 4,433,367 87.50%   101,657,650 60,005,562 <41,652,088> <40.97%> Commercial 0 0 0     10,000 1,925,000 1,915,000 19150.00% Condominium 15,610,309 16,924,844 1,314,535 8.42%   96,965,506 88,195,800 <8,769,706> <9.04%> Business 0 0 0     0 0 0   SOUTH KONA Residential 2,428,000 3,102,000 674,000 27.76%   14,454,016 14,819,200 365,184 2.53% Vacant Land 689,500 955,200 265,700 38.54%   4,092,000 6,259,700 2,167,700 52.97% Commercial 0 0 0     1,900,000 0 <1,900,000> <#DIV/0%> Condominium 0 0 0     0 0 0   Business 0 0 0     0 0 0   KA'U Residential 1,655,000 3,156,605 1,501,605 90.73%   7,938,675 12,339,555 4,400,880 55.44% Vacant Land 589,900 252,500 <337,400> <57.20%>   4,104,135 1,796,150 <2,307,985> <56.24%> Commercial 0 0 0     0 0 0   Condominium 200,000 0 <200,000> <#DIV/0%>   200,000 475,000 275,000 137.50% Business 0 0 0     0 0 0   This information has been supplied by third parties and has not been independently verified by Hawaii Information Service and is, therefore, not guaranteed.   Copyright ©7/22/2014 by Hawaii Information Service   MLS Sales Statistics Median Sales Price     1,415,450 853,000 <562,450> <39.74%>   1,573,000 1,023,500 <549,500> <34.93%>     MONTH OF # %   YEAR # % Big   June Increase / Increase /   TO DATE Increase / Increase /
  • 3. and is, therefore, not guaranteed.   Copyright ©7/22/2014 by Hawaii Information Service   MLS Sales Statistics Median Sales Price     1,415,450 853,000 <562,450> <39.74%>   1,573,000 1,023,500 <549,500> <34.93%>     MONTH OF # %   YEAR # % Big   June Increase / Increase /   TO DATE Increase / Increase / Island   2013 2014 <Decrease> <Decrease>   2013 2014 <Decrease> <Decrease> ENTIRE Residential 350,000 300,000 <50,000> <14.29%>   297,000 310,500 13,500 4.55% Vacant Land 27,000 25,000 <2,000> <7.41%>   26,500 24,250 <2,250> <8.49%> Commercial 142,450 235,000 92,550 64.97%   220,000 325,000 105,000 47.73% Condominium 196,000 268,000 72,000 36.73%   254,500 295,000 40,500 15.91% Business 700,000 25,000 <675,000> <96.43%>   775,000 68,750 <706,250> <91.13%> PUNA Residential 168,000 200,000 32,000 19.05%   159,000 175,000 16,000 10.06% Vacant Land 16,000 17,950 1,950 12.19%   19,000 19,000 0 0.00% Commercial 0 50,000 50,000 #DIV/0   200,000 207,500 7,500 3.75% Condominium 0 0 0     0 0 0   Business 700,000 0 <700,000> <#DIV/0%>   700,000 77,500 <622,500> <88.93%> SOUTH HILO Residential 247,500 285,000 37,500 15.15%   269,000 270,000 1,000 0.37% Vacant Land 175,000 165,000 <10,000> <5.71%>   164,905 167,000 2,095 1.27% Commercial 240,000 235,000 <5,000> <2.08%>   307,500 239,000 <68,500> <22.28%> Condominium 60,750 125,000 64,250 105.76%   96,500 115,000 18,500 19.17% Business 0 25,000 25,000 #DIV/0   850,000 68,750 <781,250> <91.91%> NORTH HILO Residential 595,000 369,500 <225,500> <37.90%>   260,000 429,000 169,000 65.00% Vacant Land 0 199,000 199,000 #DIV/0   215,000 187,000 <28,000> <13.02%> Commercial 0 0 0     0 0 0   Condominium 0 0 0     0 0 0   Business 0 0 0     0 0 0   HAMAKUA Residential 384,000 295,000 <89,000> <23.18%>   338,000 320,500 <17,500> <5.18%> Vacant Land 180,000 68,000 <112,000> <62.22%>   265,000 337,500 72,500 27.36% Commercial 0 420,000 420,000 #DIV/0   0 380,000 380,000 #DIV/0 Condominium 0 0 0     0 0 0   Business 0 0 0     0 0 0   NORTH KOHALA Residential 562,500 525,000 <37,500> <6.67%>   525,000 615,000 90,000 17.14% Vacant Land 646,000 550,000 <96,000> <14.86%>   329,557 355,000 25,443 7.72% Commercial 0 0 0     0 404,750 404,750 #DIV/0 Condominium 0 0 0     0 0 0   Business 0 0 0     0 0 0   SOUTH KOHALA Residential 387,500 453,000 65,500 16.90%   385,000 440,000 55,000 14.29% Vacant Land 178,750 590,000 411,250 230.07%   170,000 312,500 142,500 83.82% Commercial 44,900 0 <44,900> <#DIV/0%>   44,900 0 <44,900> <#DIV/0%> Condominium 340,500 507,500 167,000 49.05%   425,000 467,500 42,500 10.00% Business 0 0 0     0 0 0   NORTH KONA Residential 452,500 510,000 57,500 12.71%   450,000 527,500 77,500 17.22% Vacant Land 140,000 277,600 137,600 98.29%   195,000 269,000 74,000 37.95% Commercial 0 0 0     10,000 1,925,000 1,915,000 19150.00% Condominium 195,000 259,000 64,000 32.82%   235,000 267,000 32,000 13.62% Business 0 0 0     0 0 0   SOUTH KONA Residential 374,000 309,500 <64,500> <17.25%>   315,000 352,500 37,500 11.90% Vacant Land 155,000 52,200 <102,800> <66.32%>   156,000 113,500 <42,500> <27.24%> Commercial 0 0 0     1,900,000 0 <1,900,000> <#DIV/0%> Condominium 0 0 0     0 0 0   Business 0 0 0     0 0 0   KA'U Residential 120,000 175,000 55,000 45.83%   142,000 160,000 18,000 12.68% Vacant Land 22,000 17,500 <4,500> <20.45%>   15,000 9,500 <5,500> <36.67%> Commercial 0 0 0     0 0 0   Condominium 200,000 0 <200,000> <#DIV/0%>   200,000 165,000 <35,000> <17.50%> Business 0 0 0     0 0 0   This information has been supplied by third parties and has not been independently verified by Hawaii Information Service and is, therefore, not guaranteed.   Copyright ©7/22/2014 by Hawaii Information Service