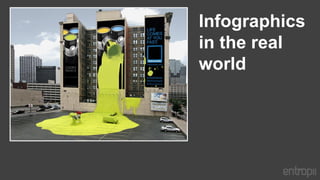
Infographics in the real world
•
0 gefällt mir•539 views

This document discusses how infographics can be used in outdoor advertising. It provides examples of how infographics could be applied on the London transportation network, including on platforms and trains to capture passengers' attention during wait times. Digital display boards and mobile infographics are also discussed as effective outdoor methods. While outdoor infographics allow reaching large audiences, challenges include ensuring the graphic is engaging enough to be noticed and measuring effectiveness.

Empfohlen
Empfohlen
Weitere ähnliche Inhalte
Was ist angesagt?
Was ist angesagt? (20)
Andere mochten auch
Andere mochten auch (7)
Ähnlich wie Infographics in the real world
Ähnlich wie Infographics in the real world (20)
Mehr von Entropii
Mehr von Entropii (9)
Infographics in the real world
- 2. “Info’ ‘graphics” Displaying information & data through visual graphics
- 3. How does an infographic work? What are infographics? Infographics clearly and creatively display interesting data or knowledge in a way that is engaging and understandable for the user
- 5. Application of infographics Typically, infographics are used online Companies create a blog post, write a short keyword description and promote through social media routes – Facebook, Twitter, Email, Newletters etc This route alone proves to be unbelievably powerful and great infographics can potentially spread virally, reaching hundreds of thousands of a targeted audience Since 2010, searches for infographics have increased by 800% http://infographicable.com
- 6. Can infographics be applicable offline?
- 7. Outdoor advertising Outdoor advertising is using environmental spaces to reach consumers on the move or in public places It is the fastest growing traditional medium over the past decade, with an estimated spend of £880 million in 2010 It can enable reaching a large number of consumers quickly or it can be used to target a specific population in a distinct location
- 8. Environments where infographics could be applied Leisure Retail Transport Point of sale Roadside
- 9. Positives of infographics in outdoor advertising Assurance to connect with hundreds of people, 24/7 Flexibility – advertisements can be placed in areas where they are most likely to be effective Opportunity to be creative Less intrusive, not pushy advertising Target the untargeted – increase brand awareness & potentially attract new people
- 10. Negatives of infographics in outdoor advertising Not targeting can be risky. If not placed appropriately, it becomes a glance medium and not really engaging. Infographics on a billboard for example usually only draws 2-3 seconds of attention: not enough to digest it and be effective. Hard to measure effectiveness. Online you are able to see a wealth of information through analytics, but it is only really through surveys that you can measure the effectiveness. Outdoor advertising by nature are longer campaigns and therefore come at a higher cost. Prime locations will come at a premium cost and usually controlled by the big players!
- 11. Where is appropriate for infographics in the real world?
- 12. Using infographics on the London transport networks Transport for London states that 3 million people use the Underground every day and nearly two million people use the London Overground every week. The perfect opportunity for using infographics are in areas where passengers are forced to wait…
- 13. Using infographics on the platform With a 3 minute average wait time on the platform for a tube train, CBS Outdoor research say that passengers find advertising here a ‘welcome distraction’ Huge display space used effectively could have real impact with the consumer The infographic would need to be clear and simple: quick for the consumer to digest
- 14. Using infographics on the train Each passenger has an average journey time of 13 minutes. It is seen as the perfect time to communicate a more detailed brand story Whilst the passenger may have time to read through a paragraph of text, communicating the message visually will have greater impact.
- 15. Using infographics on the interactive kiosks Kiosks are purpose built for users to interact with in order to find information. Advantages Condensing large amounts of information to be easier to process and aesthetically appealing Communicated in-depth information more effectively Purpose made for interactive infographics Disadvantages More complex to design Not all data is visible on the same page May make it harder to hook users instantly
- 16. Intelligent digital display boards Latest digital display boards are getting more intelligent. The image shows a digital display that has a built-in webcam. It utilises face recognition software to detect whether a person walking past is male or female and targets an appropriate advertisement.
- 17. Mobile infographics According to the infographic on mobile marketing from digitalbuzz, by 2014 mobile internet should overtake desktop internet usage. Smartphone technology provides the ability to create interesting and interactive infographics Consumers can easily share infographics they like with friends, giving it the ability to spread virally Effectiveness can be measured through analytics Near field communication (NFC) is a group of short-range wireless technologies that can be used to send information to mobile devices. This type of technology could really benefit the consumer, if used effectively. Infographics can be set to provide information that will influence them immediately.
- 18. It’s a constant battle to engage with your audience. Marketers are always trying new ways attract their target audience. Infographics are not utilised enough. The flexibility that they provide and the attention that they draw could really explode your consumer engagement having a great impact on your marketing results.
- 19. Service Design