Rockefeller Foundation at ACEF 2014
•Als PPTX, PDF herunterladen•
2 gefällt mir•699 views

Presentation at the Energy for All Investor Forum

Empfohlen
Empfohlen
Weitere ähnliche Inhalte
Was ist angesagt?
Was ist angesagt? (18)
Ähnlich wie Rockefeller Foundation at ACEF 2014
Ähnlich wie Rockefeller Foundation at ACEF 2014 (20)
Mehr von Energy for All | Asian Development Bank
Mehr von Energy for All | Asian Development Bank (20)
Kürzlich hochgeladen
Kürzlich hochgeladen (12)
Rockefeller Foundation at ACEF 2014
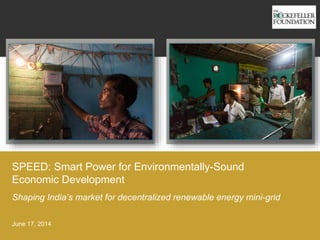
- 1. SPEED: Smart Power for Environmentally-Sound Economic Development June 17, 2014 Shaping India’s market for decentralized renewable energy mini-grid
- 2. | 2 The problem in India: • Bihar, Jharkhand, Orissa, and Uttar Pradesh all have official electrification rates below 30%. • Electricity is often erratic - unviable for productive loads • 20-25 more years for the least electrified states to be fully grid-connected • “Last mile” connections to rural villages India has the largest un-electrified population in the world: 306 million ▪ Overall electrification rate: 67% Urban 55% 93% Rural Summary of electrification scenario in India Electrification of rural households Percent of rural households electrified Uttar Pradesh (UP) Bihar Jharkhand Odisha Less than 40% 40 - 59% 60 - 79% >80%
- 3. | 3 SPEED can capitalize on innovative mini-grid technology to unlock the rural electrification market SOURCE: Team analysis * 1 household represents ~5 individuals Devices Solar Home Systems Pico-grids ▪ Lighting only ▪ Requires daily charging ▪ Covers < 1 household* ▪ Lighting only ▪ Small appliances ▪ Covers 1-2 households ▪ Lighting only ▪ Fixed amount of electricity ▪ Covers 40 households Alternatives to grid electrification – SPEED compared to other models RF SPEED Mini-grids 30+ KW ▪ Lighting, productive loads ▪ Room for grid growth ▪ Covers 1 village (~150 households)
- 4. | 4 Rising diesel costs Growth of telecom towers in rural India Green policy Shortage in grid power availability at more than 70% of tower sites . . . > 20 Hrs 16-20 Hrs 12-16 Hrs 8-12 Hrs < 8 Hrs 10% 25% 15% 20% 30% Grid power supply % of Telecom Towers (2013); 100%=422,000 towers Telecom towers Parts of Bihar, North East, UP & J&K Mostly rural areas Semi-urban areas Major cities apart from metros Metros like Mumbai, Kolkata, Chennai; Gujarat and Punjab states Typical regions
- 5. | 5 Current challenges for ESCOs trying to enter the mini-grid market for lighting and productive use Current challenges What ESCOs need Unpredictable demand Assured, predictable demand Operation and logistic complexities Ease of operations in serving the target market Limited financing options Access to financing and low-cost capital, including government subsidy Policy uncertainty Visibility into long-term viability; degree of confidence in market stability
- 6. | 6 The SPEED model is designed to address these challenges Develop and convert micro- enterprises to renewables Provide risk capital Facilitate PPAs between Telecoms and ESCOs Community engagement and monitoring Government partnerships and engagement Renewable energy plant Mini-grid Regulators/ government Funders/ financers Other enablers (e.g., NGOs, village committees) Generating ESCO Micro-utility ESCO Integrated Energy Service Company (ESCO) Rural house- hold Produc- tive loads Anchor load (Telecom tower) Provide project development support
- 7. | 7 SPEED offers competitive pricing across all three customer segments SOURCE: SPEED Tariff document, SPEED PPE Model, Barefoot Power report (May 2009), team analysis SPEED model pricesCurrent energy cost ~ $ 0.5/kWh ~ $0.3 - $ 0.4/kWh House- holds Productive Loads Telecom Towers $ 0.4 – 0.5/kWh (DG sets) $ 0.3 – 0.4/kWh Other loads $ 2.5/month (2 bulbs + 1 charging point) $ 3 – 4/month (1 or 2 kerosene lamps + phone recharge) 10 – 30 lumens/lantern 300-500 lumens/bulb
- 8. | 8 Impact of scale (100 plants – corporate-level1) and clustering on IRR of base case model (%) SPEED’s value proposition: Scale and clustering benefits 19-20% Equity IRR at corporate level Project IRR at corporate level 15–16% Overheads 0.2% OpEx benefits 1.5–1.8% CapEx benefits Base case for single plant Low-cost debt 2.5–3% 3-4% 11.6% 12-14% reduction in overheads 10-13% reduction in CapEx 18-20% reduction in OpEx Concessionary debt 1 Corporate level assumes clustering, in this case 5 clusters of 20 plants each
- 9. | 9 SPEED’s 1,000 Village Plan for India SOURCE: Census 2001, Census 2011, team analysis 1 The number of households at each level includes only rural households India 168 mn households1 45% unelectrified Priority States 61 mn households 78% unelectrified Priority Districts 14 mn households 93% unelectrified Potential Clusters 4 priority states Four of the least electrified states in India – Uttar Pradesh (UP), Bihar, Odisha and Jharkhand Districts with household electricity penetration rate of less than 10% Potential clusters Sites with villages within 1 km of Telecom tower Initial focus will be on 2 states (Bihar, UP) Scale and clustering benefits
- 10. | 10 End
Hinweis der Redaktion
- 6