SlideShare ist ein Scribd-Unternehmen logo
1 von 11
Downloaden Sie, um offline zu lesen
1
EDTRUST.ORG
Degree Attainment for Latino Adults: National and State Trends
Authors: J. Oliver Schak and Andrew Howard Nichols
J. Oliver Schak is the senior policy and research associate for higher education and
Andrew Howard Nichols, Ph.D., is the senior director of higher education research and data analytics at The Education Trust
Understanding the economic and social benefits of more college-educated residents, over 40 states during the past decade have set
goals to increase their state’s share of adults with college credentials and degrees. In many of these states, achieving these “degree
attainment” goals will be directly related to their state’s ability to increase the shares of Black and Latino adults in those states that
have college credentials and degrees, particularly as population growth among communities of color continues to outpace the White
population and older White workers retire and leave the workforce.1
From 2000 to 2016, for example, the number of Latino adults
increased 72 percent and the number of Black adults increased 25 percent, while the number of White adults remained essentially flat.
Nationally, there are significant differences in degree attainment among Black, Latino, and White adults, but degree attainment for
these groups and the attainment gaps between them vary considerably across states. In this brief, we explore the national trends and
state-by-state differences in degree attainment for Latino adults, ages 25 to 64 in 44 states.2
We examine degree attainment for Black
adults in a companion brief.
National Degree Attainment Trends
Compared with 47.1 percent of White adults, slightly
more than 22 percent of Latino adults have earned
some form of college degree (i.e., an associate degree
or more). For perspective, current degree attainment
levels of Latino Americans are about 10 percentage
points lower than the attainment levels of White adults
in 1990 — over a quarter of a century ago.
Specifically, degree attainment among Latino Americans
trails the rate for White adults by 24.5 percentage
points (see Figure 1), but a closer look at the data
indicates that the differences in degree attainment are
not uniform across all levels of attainment. The gaps
are more prominent at the higher levels (i.e., bachelor’s
and graduate), which offer greater financial returns, job
Why Is Degree Attainment Important?
As the American economy continues to become more knowledge-based, a college degree becomes more and more essential.
By 2020, about 65 percent of American jobs will require some form of college, compared with just 28 percent in 1973.3
Generally, unemployment rates are lower for people with higher educational attainment, and wages are higher.4
Compared with
high school graduates with no college degree, bachelor’s degree completers (with no graduate-level training) are nearly two
times less likely to be unemployed and earn nearly $25,000 more annually. Furthermore, bachelor’s degree completers — on
average — earn nearly $1 million dollars more over their lifetime than high school graduates that haven’t attended college.5
Given these personal economic benefits of completing college, degree attainment is often thought of as an individual benefit.
However, these personal economic advantages result in larger social benefits, such as increased tax revenue and less reliance
on public assistance or social “safety net” programs.6
In addition, increased levels of educational attainment are associated
with less crime and incarceration, better health, more volunteerism, higher levels of voting and political engagement, and more
charitable donations and philanthropic contributions.7
30.8%
6.2%
28.4%
25.3%
18.3%
21.4%
6.6%
10.0%
11.0%
23.7%
5.0%
13.4%
0%
25%
50%
75%
100%
LATINO WHITE
Less than High School High School Grad / Equiv Some College, No Degree
Associate Bachelor's Graduate
DEGREE ATTAINMENT FOR LATINO AND WHITE ADULTS, 2016FIGURE 1
22.6%
47.1%
Source: Ed Trust analysis of the United States Census Bureau’s 2016 American Community Survey.
2
EDTRUST.ORG
security, and employment options in the labor market.
The gap in attainment between Latino and White adults
at the associate degree level is the smallest (i.e., 3.4
percentage points). But at the graduate degree level,
only 5.0 percent of Latino adults have earned a degree
compared with 13.4 percent of White adults — a gap
of about 8 percentage points. The discrepancy is largest
at the bachelor’s degree level, where the gap is 12.7
percentage points. Just 11.0 percent of Latino adults
have attained a bachelor’s degree compared with 23.7
percent of White adults.
There have been gains in degree attainment over
time for Latino adults, but these gains have not been
enough to close a persistent gap in Latino and White
attainment. Since 2000, White degree attainment
has increased by 9.5 percentage points, while Latino
degree attainment has increased slightly more than 7
percentage points (see Figure 2). For Latino adults in
2000, associate degree attainment was 4.5 percent,
and bachelor’s degree attainment was 7.0 percent.
The White associate and bachelor’s degree attainment
rates in 2000 were 7.8 percent and 19.3 percent,
respectively. Gains in associate degree attainment
and bachelor’s degree attainment are about the same
for Latino and White adults. With respect to graduate
level attainment, the rate was 3.9 percent for Latino
adults in 2000, compared with 10.6 percent for Whites.
For Latino adults, gains at the graduate degree level
are only 1.1 percentage points, less than half the 2.8
percentage point gain for Whites.
When you look at attainment by age, the overall gap in
attainment is larger for younger Latinos given the limited growth
in degree attainment for Latinos compared with White adults
(see Figure 3). The attainment rate for young Latino adults
(ages 25 to 34) is just about 4 percentage points higher than
the rate for older Latino adults (ages 55 to 64), compared with
an approximately 9 percentage point improvement between
younger and older White adults. While the gap between older
Latino and White adults was slightly more than 21 percentage
points, attainment for young Latino adults, ages 25 to 34, is
approximately 27 percentage points lower than that for their
White peers. For 35 to 44 year olds, the attainment gap between
Latino adults and White adults is even higher at nearly 30
percentage points.
The national trends in degree attainment for Latino adults, including the slow growth in the attainment rate, are shaped mostly by 10 states
that account for 78.2 percent of Latino adults (see Figure 4). California, Texas, Florida, and New York account for over three-fifths of Latino
PERCENTAGE POINT GAINS IN DEGREE ATTAINMENT FOR
LATINO AND WHITE ADULTS SINCE 2000FIGURE 2
2.0
4.0
1.1
7.1
2.2
4.5
2.8
9.5
0
2
4
6
8
Associate Bachelor's Graduate Total
LATINO WHITE
10
DEGREE ATTAINMENT FOR LATINO AND WHITE ADULTS BY AGE, 2016FIGURE 3
24.5%
22.4% 21.6% 20.3%
51.0% 51.4%
45.8%
41.7%
0%
15%
30%
45%
60%
25-34 35-44 45-54 55-64
LATINO WHITE
Source: Ed Trust analysis of the United States Census Bureau’s 2016 American Community Survey.
Source: Ed Trust analysis of the United States Census Bureau’s 2016 American Community Survey and the 2000 Decennial Census.
LATINO ADULT POPULATION BY STATE, 2016FIGURE 4
California 26.9%
Texas 18.5%
Florida 9.7%
New York 6.9%
Illinois 3.8%
Arizona 3.6%
New Jersey 3.3%
Colorado 2.0%
New Mexico 1.7%
Georgia 1.6%
All other states and DC
21.8%
Source: Ed Trust analysis of the United States Census Bureau’s 2016 American Community Survey.
3
EDTRUST.ORG
adults nationally, while Illinois, Arizona, New Jersey, Colorado, New Mexico, and Georgia add up to an additional 16 percent of Latino
adults. Many other states have smaller shares of Latino adults, but have seen rapidly growing Latino populations the last few decades. A
closer look at trends in each state can shed more light on Latino attainment.
State Attainment Trends
In this section, we examine state-level data on the following: 1) Latino degree attainment, 2) Latino attainment change since
2000, and 3) attainment gaps between Latino and White adults. Narratives describing the data are below, but state ranks,
grades, and ratings for each of the three indicators can be found on Table 1 on page 4. We also include a map showing how
states compare on Latino degree attainment and attainment gaps on page 5.
2016 Latino Degree Attainment
When you examine differences
in degree attainment for Latino
adults by state, most states have
rates that fall within roughly 5
percentage points of the national
average, which is approximately 22
percentage points (see Figure 5).
But there are several states that
stand out at both the high and low
end of the distribution.
On the high end, New Hampshire,
Florida, Virginia, Hawaii, and
Alaska all have degree attainment
rates that are close to or exceed 30
percent. The outlier in this group is
Florida, where one-fourth of adults
are Latino; the other states have
Latino population shares below 10
percent. Several states in New England and the Mid-Atlantic — New York, Massachusetts, Maryland, and New Hampshire — are
among the top 10 states for Latino degree attainment. In this group, New York stands out with its Latino share of adults at 18.3
percent — the fourth largest Latino population in the country.
On the lower end of the attainment distribution for Latino adults are Idaho, Arkansas, Nevada, Nebraska, and Oklahoma. These states have
degree attainment rates that are near or below 16 percent. Idaho has the lowest degree attainment rate for Latino adults at 12.7 percent,
and Arkansas has the second lowest at 12.9 percent. These states with lower attainment tend to be more sparsely populated and have
lower than average shares of Latino adults. However, Nevada is an exception with most adults living around Las Vegas and a share of Latino
adults around 26 percent. The share of Latino adults is 10.6 percent in Idaho, but less than 10 percent in Oklahoma, Nebraska, and Arkansas.
It is also noteworthy that none of the 10 states with the lowest Latino attainment rates are in New England or the Mid-Atlantic.
Hawaii and Alaska are the only states in Pacific and Mountain states with attainment rates in the top 10, and both have small
shares of Latino adults. Among states near the border with Mexico that have large shares of Latino adults, Colorado (ranked 19th
)
and New Mexico (15th
) have attainment rates near the national average (22-23 percent), while California (38th
), Texas (30th
), and
Arizona (33rd
) hover between 18 and 20 percent.
DEGREE ATTAINMENT FOR LATINO ADULTS BY STATEFIGURE 5
12.7%
12.9%
14.4%
15.2%
15.8%
18.2%
18.3%
18.5%
18.6%
18.6%
18.8%
19.0%
19.6%
19.7%
19.7%
20.0%
20.0%
20.1%
20.4%
20.4%
20.6%
20.8%
21.2%
22.0%
22.0%
22.2%
22.8%
23.0%
23.1%
23.2%
23.2%
24.2%
24.3%
24.4%
24.6%
26.4%
26.5%
26.6%
26.9%
28.3%
29.5%
29.8%
34.2%
36.5%
0%
15%
30%
45%
IDAHO
ARKANSAS
NEVADA
NEBRASKA
OKLAHOMA
UTAH
CALIFORNIA
TENNESSEE
INDIANA
KANSAS
NORTHCAROLINA
ARIZONA
OREGON
WISCONSIN
TEXAS
ALABAMA
RHODEISLAND
SOUTHCAROLINA
ILLINOIS
MISSISSIPPI
IOWA
GEORGIA
DELAWARE
PENNSYLVANIA
WASHINGTON
COLORADO
LOUISIANA
MINNESOTA
CONNECTICUT
NEWMEXICO
WYOMING
KENTUCKY
MICHIGAN
NEWJERSEY
MASSACHUSETTS
MISSOURI
MARYLAND
NEWYORK
OHIO
ALASKA
HAWAII
VIRGINIA
FLORIDA
NEWHAMPSHIRE
Source: Ed Trust analysis of the United States Census Bureau’s 2014, 2015, and 2016 American Community Surveys.
4
EDTRUST.ORG
Table 1: Latino Degree Attainment Indicators by State
• 4 •
Degree Attainment Rate Change in Degree Attainment Degree Attainment Gap
State
Percentage
of Adults
that are
Latino
Latino
Attainment
Latino
Attainment
Rank
Grade for
Latino
Attainment
Latino
Attainment
Change
Since 2000
(percentage
points)
Latino
Attainment
Change
Since 2000
Rank
Grade for
Change
in Latino
Attainment
Latino-
White Gap
(percentage
points)
Latino-White
Gap Rank
Rating for
Latino-White
Gap*
Gap Change
Since 2000
(percentage
points)
Alabama 3.6% 20.0% 29 D+ 0.2 40 F 17.6 11 below average 7.8
Alaska 5.8% 28.3% 5 A 0.6 39 F 15.4 7 below average 4.6
Arizona 28.8% 19.0% 33 D 5.8 16 B- 26.9 27 average 0.8
Arkansas 6.1% 12.9% 43 F 3.0 34 D 19.8 14 average 4.9
California 36.2% 18.3% 38 D 5.9 15 B- 35.1 44 above average 1.8
Colorado 18.9% 22.2% 19 C 6.5 10 B+ 34.1 43 above average 1.8
Connecticut 14.6% 23.1% 16 C+ 6.7 8 B+ 31.9 40 above average 1.7
Delaware 8.3% 21.2% 22 C- 3.1 33 D+ 23.2 19 average 2.8
Florida 25.5% 34.2% 2 A+ 8.2 2 A 10.0 1 below average -0.5
Georgia 8.5% 20.8% 23 C- 3.3 31 D+ 23.0 18 average 4.3
Hawaii 9.0% 29.5% 4 A 7.0 7 B+ 26.5 26 average 1.0
Idaho 10.6% 12.7% 44 F 2.6 35 D- 27.0 28 average 4.4
Illinois 15.8% 20.4% 26 C- 7.3 5 A- 30.0 39 above average 2.4
Indiana 5.8% 18.6% 36 D 3.3 32 D+ 19.5 13 average 5.9
Iowa 4.8% 20.6% 24 C- 4.9 23 C+ 24.5 22 average 6.6
Kansas 10.2% 18.6% 35 D 5.5 18 B- 27.8 33 average 3.0
Kentucky 2.9% 24.2% 13 B- 6.0 14 B- 10.1 2 below average 3.7
Louisiana 4.9% 22.8% 18 C+ -1.7 44 F 12.8 4 below average 9.2
Maryland 9.1% 26.5% 8 B+ 0.0 42 F 27.0 29 average 9.0
Massachusetts 10.2% 24.6% 10 B- 5.1 21 C+ 32.8 41 above average 4.5
Michigan 4.2% 24.3% 12 B- 5.4 20 C+ 17.3 10 below average 2.5
Minnesota 4.5% 23.0% 17 C+ 4.6 26 C 29.5 37 above average 7.4
Mississippi 2.7% 20.4% 25 C- 2.1 38 D- 16.4 8 below average 5.4
Missouri 3.4% 26.4% 9 B+ 4.6 27 C 13.9 6 below average 4.4
Nebraska 9.2% 15.2% 41 F 3.8 30 C- 33.2 42 above average 6.5
Nevada 25.9% 14.4% 42 F 5.5 19 C+ 23.6 21 average 2.9
New Hampshire 3.0% 36.5% 1 A+ 4.5 29 C 11.6 3 below average 3.1
New Jersey 19.4% 24.4% 11 B- 7.4 4 A- 29.5 38 above average 2.8
New Mexico 45.9% 23.2% 15 C+ 6.1 13 B 27.2 30 average 0.1
New York 18.3% 26.6% 7 B+ 9.1 1 A+ 28.7 36 above average 0.9
North Carolina 8.1% 18.8% 34 D 4.7 25 C 28.1 34 average 6.4
Ohio 3.1% 26.9% 6 B+ 5.7 17 B- 13.3 5 below average 3.3
Oklahoma 8.7% 15.8% 40 F 2.4 36 D- 21.8 16 average 5.4
Oregon 11.0% 19.6% 32 D+ 6.4 12 B 24.9 23 average 2.1
Pennsylvania 6.2% 22.0% 21 C 5.1 22 C+ 22.3 17 average 5.0
Rhode Island 13.2% 20.0% 28 D+ 7.1 6 B+ 27.7 32 average 0.7
South Carolina 5.0% 20.1% 27 D+ 0.1 41 F 23.5 20 average 9.0
Tennessee 4.5% 18.5% 37 D -0.4 43 F 18.7 12 average 9.4
Texas 36.2% 19.7% 30 D+ 6.7 9 B+ 27.7 31 average 1.2
Utah 13.0% 18.2% 39 D 4.5 28 C 28.4 35 average 4.0
Virginia 8.6% 29.8% 3 A 4.8 24 C 21.6 15 average 4.6
Washington 10.4% 22.0% 20 C 6.4 11 B 25.9 24 average 0.9
Wisconsin 5.7% 19.7% 31 D+ 2.3 37 D- 26.2 25 average 8.2
Wyoming 8.9% 23.2% 14 C+ 7.9 3 A 17.2 9 below average -0.9
EDTRUST.ORG
*”Below average” means the attainment gap is smaller than the gap in most states. “Above average” means the attainment gap is larger than the gap in most states. See “About the Data” for more details.
Source: Ed Trust analysis of the United States Census Bureau’s 2014, 2015, and 2016 American Community Surveys.
5
EDTRUST.ORG
Above average Latino degree attainment and a degree attainment gap that is ≤ 15.3 percentage points.
Above average Latino degree attainment and a degree attainment gap that is > 15.3 percentage points.
Below average Latino degree attainment and a degree attainment gap that is ≤ 15.3 percentage points.
Below average Latino degree attainment and a degree attainment gap that is > 15.3 percentage points.
Fewer than 15,000 Latino adults
WA
OR
CA
NV
ID
MT
WY
AZ
CO
NM
TX
AK
HI
OK
KS
NE
ND
MN
IA
MO
LA
MS
AL
TN
KY
IL
WI
MI
OH
PA
WV
VA
SC
GA
FL
NY
VT
NH
MA
CT
RI
NJ
DE
MD
ME
UT
SD
AR
IN
NC
LATINOEDUCATIONATTAINMENTANDLATINO–WHITEATTAINMENTGAPBYSTATE
Source:EdTrustanalysisoftheUnitedStatesCensusBureau’s2014,2015,and2016AmericanCommunitySurveys.
• 5 •
EDTRUST.ORG
6
EDTRUST.ORG
Attainment Change Since 2000
Since 2000, 40 states we examined
have seen have seen increases
over 1.0 percentage points in
degree attainment for Latino
adults, while six states have
seen little change in attainment
(see Figure 6). Typically, larger
states with higher percentages of
Latino adults experienced higher
or above average change, while
many smaller states with lower
percentages of Latino adults
exhibited very little change in
attainment.
Florida and New York stand out as
states with large Latino populations
that have improved the most. Florida
has increased Latino attainment by 8.2
percentage points, while New York has
seen the most improvement with a 9.1
percentage point gain. Other states
in the top 10 on attainment change
include New Jersey, Connecticut, and
Rhode Island in New England and the
Mid-Atlantic along with Texas, Illinois,
Colorado, Hawaii, and Wyoming. In the
South, only Kentucky, Texas, and Florida
rank in the top half of states.
Several states experienced very little
change in attainment levels over the
past decade and a half. Maryland,
Tennessee, South Carolina, Louisiana,
Alabama, and Alaska all saw little
change in Latino attainment. These
states only account for about 3 percent of all Latino adults, but have experienced rapid migration of Latino adults since 2000. With a
2.6 percentage point gain in attainment since 2000, Idaho is the only state in the bottom 10 that has a Latino share of adults over 10
percent. Among Pacific and Mountain states with high percentages of Latino adults, California, Colorado, Arizona, New Mexico, and
Nevada all show change close to the national average at about 6 percent.
Attainment Gaps Between
Latino and White Adults
In every state in our sample, there is a gap between degree attainment rates for Latino and White adults. And in half of the states
that gap that exceeds 25 percentage points (see Figure 7). At about 10 percentage points, Florida and Kentucky have the smallest
PERCENTAGE POINT GAP IN LATINO AND WHITE DEGREE ATTAINMENT
FOR ADULTS BY STATEFIGURE 7
35.1
34.1
33.2
32.8
31.9
30.0
29.5
29.5
28.7
28.4
28.1
27.8
27.7
27.7
27.2
27.0
27.0
26.9
26.5
26.2
25.9
24.9
24.5
23.6
23.5
23.2
23.0
22.3
21.8
21.6
19.8
19.5
18.7
17.6
17.3
17.2
16.4
15.4
13.9
13.3
12.8
11.6
10.1
10.0
0
10
20
30
40
CALIFORNIA
COLORADO
NEBRASKA
MASSACHUSETTS
CONNECTICUT
ILLINIOS
NEWJERSEY
MINNESOTA
NEWYORK
UTAH
NORTHCAROLINA
KANSAS
RHODEISLAND
TEXAS
NEWMEXICO
MARYLAND
IDAHO
ARIZONA
HAWAII
WISCONSIN
WASHINGTON
OREGON
IOWA
NEVADA
SOUTHCAROLINA
DELAWARE
GEORGIA
PENNSYLVANIA
OKLAHOMA
VIRGINIA
ARKANSAS
INDIANA
TENNESSEE
ALABAMA
MICHIGAN
WYOMING
MISSISSIPPI
ALASKA
MISSOURI
OHIO
LOUISIANA
NEWHAMPSHIRE
KENTUCKY
FLORIDA
PERCENTAGE POINT GAINS IN DEGREE ATTAINMENT FOR
LATINO ADULTS SINCE 2000 BY STATEFIGURE 6
-1.7
-0.4
0.0
0.1
0.2
0.6
2.1
2.3
2.4
2.6
3.0
3.1
3.3
3.3
3.8
4.5
4.5
4.6
4.6
4.7
4.8
4.9
5.1
5.1
5.4
5.5
5.5
5.7
5.8
5.9
6.0
6.1
6.4
6.4
6.5
6.7
6.7
7.0
7.1
7.3
7.4
7.9
8.2
9.1
-4
-2
0
2
4
6
8
*LOUISIANA
*TENNESSEE
*MARYLAND
*SOUTHCAROLINA
*ALABAMA
*ALASKA
*MISSISSIPPI
*WISCONSIN
OKLAHOMA
*IDAHO
*ARKANSAS
*DELAWARE
INDIANA
GEORGIA
NEBRASKA
*NEWHAMPSHIRE
UTAH
MISSOURI
MINNESOTA
NORTHCAROLINA
VIRGINIA
IOWA
PENNSYLVANIA
MASSACHUSETTS
MICHIGAN
NEVADA
KANSAS
OHIO
ARIZONA
CALIFORNIA
KENTUCKY
NEWMEXICO
OREGON
WASHINGTON
COLORADO
TEXAS
CONNECTICUT
HAWAII
RHODEISLAND
ILLINOIS
NEWJERSEY
WYOMING
FLORIDA
NEWYORK
*Change in degree attainment rate not statistically significant from zero based on an independent sample t-test at the 95 percent level of significance
Source: Ed Trust analysis of the United States Census Bureau’s 2014, 2015, and 2016 American Community Surveys.
Source: Ed Trust analysis of the United States Census Bureau’s 2014, 2015, and 2016 American Community Surveys and the 2000 Decennial Census.
7
EDTRUST.ORG
attainment gaps in the country; however, their gaps are partly a function of having low-to-average attainment rates for White
adults. Florida again stands out for having a low attainment gap and a large share of Latino adults, whereas Kentucky has a much
smaller Latino community. The next three states with the smallest gaps (New Hampshire, Louisiana, and Ohio) have shares of Latino
adults below 5 percent. Michigan, Missouri, Mississippi, Alaska, and Wyoming are also among the 10 states with the smallest
attainment gaps. These states have attainment rates near or above the national average, but all have percentages of Latino adults
below 10 percent.
On the other end of the spectrum, California, Colorado, Nebraska, Massachusetts, Connecticut, and Illinois all have extreme
inequality in degree attainment between Latino and White adults, with gaps of at least 30 percentage points. These gaps are
especially problematic because these states account for about one in three Latino adults. California has the most Latino adults of
any state and the largest gap at 35.1 percentage points. Colorado has a gap at 34.1 percentage points and the eighth largest Latino
adult population.
Diversity of Latino Adults
Although typically grouped together
into a single statistical category,
Latino adults represent diverse ethnic
communities that have reached differing
levels of degree attainment. About 42
percent of Latino adults were born in
the 50 states and District of Columbia,
while the remaining 58 percent were
either foreign born or born in a territory
of the United States (e.g., Puerto Rico).
However, this composition varies greatly
by state (see Figure 8). For example,
over two-thirds of Latino adults are
native-born in New Mexico, Hawaii, and
Wyoming; while less than 25 percent are
native-born in Georgia, North Carolina,
and Maryland. New Mexico and
Colorado are the only border states with
Mexico that has well over a 50 percent
share of native-born Latino adults.
Native-born Latino adults are much more
likely to hold some form of college degree.
The attainment rate for this group is 29.8
percent, compared with 17.2 percent for
Latino adults born outside the United States
(see Figure 9). Among native-born Latino
adults, about 85 percent have attained at
least a high school diploma or equivalent
degree, compared with barely 57 percent
of Latino adults who were born outside the
United States. However, it is important to
note that the attainment rate for native-born
SHARE OF LATINO ADULTS WHO ARE NATIVE-BORN BY STATE, 2016FIGURE 8
79.1%
0%
25%
50%
75%
100%
HAWAII
NEWMEXICO
WYOMING
COLORADO
ALASKA
OHIO
MICHIGAN
ARIZONA
NEWHAMPSHIRE
TEXAS
IDAHO
WISCONSIN
MISSOURI
OKLAHOMA
INDIANA
PENNSYLVANIA
CALIFORNIA
KANSAS
WASHINGTON
UTHA
OREGON
CONNECTICUT
ILLINIOS
LOUISIANA
IOWA
NEWYORK
MISSISSIPPI
KENTUCKY
NEVADA
NEBRASKA
RHODEISLAND
MINNESOTA
ARKANSAS
NEWJERSEY
ALABAMA
DELAWARE
MASSACHUSETTS
TENNESSEE
FLORIDA
SOUTHCAROLINA
VIRGINIA
NORTHCAROLINA
GEORGIA
MARYLAND
76.2%
70.8%
59.3%
59.1%
56.9%
56.2%
54.5%
53.8%
52.3%
51.0%
47.5%
46.2%
43.9%
43.9%
43.8%
43.0%
43.0%
42.1%
41.6%
39.7%
39.5%
39.3%
37.5%
36.4%
36.3%
35.3%
35.0%
34.3%
34.2%
32.6%
31.5%
31.5%
31.4%
31.0%
29.9%
28.9%
27.6%
27.1%
26.3%
23.4%
22.7%
22.7%
44.4%
DEGREE ATTAINMENT FOR LATINO ADULTS BY BIRTHPLACE, 2016FIGURE 9
14.6%
42.7%
29.8%
27.4%25.9%
12.7%9.1%
4.7%14.4%
8.5%
6.3% 4.0%
NATIVE-BORN NON-NATIVE-BORN
0%
25%
50%
75%
100%
Less than High School High School Grad / Equiv Some College, No Degree
Associate Bachelor's Graduate
29.8%
17.2%
Source: Ed Trust analysis of the United States Census Bureau’s 2016 American Community Survey.
Source: Ed Trust analysis of the United States Census Bureau’s 2016 American Community Surveys.
8
EDTRUST.ORG
Latino adults is nearly 20 percentage points less
than the attainment rate for White adults.
Latino adults are also diverse in terms of their
country or territory of origin (either through birth
or ancestry). A clear majority (60.8 percent) of
Latino adults identify as Mexican-American, but
others commonly identify as Cuban-American (4.2
percent), Puerto Rican (9.5 percent), or another
ethnic group from Central or South America (25.5
percent). Latino degree attainment is generally
lower among Mexican-Americans compared
with the other three categories (see Figure 10).
Degree attainment for Mexican-Americans is
17.4 percent compared with nearly 30 percent for
Puerto Ricans and nearly 40 percent for Cuban-
Americans. Varied representation of Latino ethnic
groups across the country and in states, in part, explains why some states have much higher attainment rates compared to the
nation as whole (see Figure 11). For example, Florida has the second highest Latino attainment rate and the third largest Latino
population, but nearly half of its Latino adults are either Cuban-American or Puerto Rican compared to only one-seventh of
Latino adults in the United States.
A few factors explain gaps in attainment between subgroups of Latino Americans. Latino Americans born in the United States
are citizens and benefit from having access to educational supports, such as in-state tuition at public universities and community
colleges and eligibility for federal and state financial aid. Similarly, adults who were born in Puerto Rico are American citizens and
typically have had greater access to higher education (before and after migration) than other Latino Americans. Cuban immigrants
also benefit from the ability to apply for permanent residency status within one year of arrival, regardless of whether they were
authorized to enter the country.8
Latinos in other ethnic groups, particularly if they or their parents where unauthorized immigrants,
do not benefit from these advantages.
Another factor is that Latino adults born outside the United States vary widely in their educational attainment and socioeconomic
status prior to migration. For instance, many Cuban-American adults have arrived in the United States with higher levels of educational
attainment and social capital than the average Latino immigrant. Research suggests that how immigrants differ educationally from
non-migrants in the home country can influence the college enrollment and attainment of subsequent generations.9
Thus, differences in
educational attainment prior to migration may contribute to sustained gaps in attainment between subgroups of Latino Americans.
Conclusion
As states continue to pursue their goals to increase the share of adults that have some form of postsecondary credential, it is
imperative that states enact policies, interventions, and incentives that will enable more Latino students to successfully navigate the
traditional educational pathway to degree completion and help Latino adults — who may have dropped out of college, never enrolled,
or grew up outside the United States — find a pathway to completing a college credential or degree. The data in this brief show that
Latino attainment rates in many states are far too low and significantly trail rates for White adults.
We know that racial and ethnic gaps in attainment are the result of various factors, such as historical — and current — economic,
social, and educational barriers that systemically disadvantage and stifle the progress of Latino people in this country. Many Latinos
immigrate to the United States with less education, wealth, and social capital than other immigrants. Too many Latino immigrants face
the threat of deportation and lack access to key educational supports, such as in-state tuition and financial aid. Research shows these
barriers slow the upward social mobility of Latino immigrants and their families.
0%
25%
50%
75%
100%
Less than High School High School Grad / Equiv Some College, No Degree
Associate Bachelor's Graduate
DEGREE ATTAINMENT FOR LATINO ADULTS BY ORIGIN, 2016FIGURE 10
36.0%
17.4% 13.7%
26.1%
28.8%
30.7%
30.3%
26.2%
17.8%
22.2%
16.1%
18.5%
5.5%
10.0%
10.2%
7.1%
8.7%
12.9%
19.0%
14.6%
3.2% 6.8% 10.7% 7.5%
MEXICO PUERTO RICO CUBA OTHER
17.4% 29.7%
39.9% 29.2%
Source: Ed Trust analysis of the United States Census Bureau’s 2016 American Community Survey.
9
EDTRUST.ORG
More broadly, Latinos also experience inequities linked to discrimination and prejudice against non-White Americans. Inequities in the
criminal justice system are clear examples that influence educational attainment. We know that our education system, on average,
sends Latino students to schools with less funding and resources,10
fewer experienced teachers,11
less rigorous curricular options,12
and
fewer school counselors.13
Making matters worse, teachers and schools often do not meet the needs of bilingual students or develop
curriculums that are culturally relevant for Latino students. These systemic barriers can only be addressed through interventions and
policies that prioritize eliminating racial and ethnic disparities, especially those that stifle opportunities for first- and second-generation
Latino Americans.
About the Data
In this brief, we use data from the United States Census Bureau to examine degree attainment at the state and national level. Degree
attainment is defined as the percentage of adults between the ages of 25 and 64 that have some form of postsecondary degree (i.e., an
associate, bachelor’s, or graduate degree). For the national degree attainment estimates, we used the United States Census Bureau’s 2016
American Community Survey. These data include adults in all states, the District of Columbia (Washington D.C.), Puerto Rico, and overseas
military installations.
The degree attainment estimates for states were calculated using three-year averages of data from the United States Census Bureau’s
American Community Surveys from 2014, 2015, and 2016. We used a three-year average to mitigate the influence of sampling error and single-
year anomalies for states with small populations. To further address the influence of sampling error, we excluded states from the analysis that
had an average estimated population of Latino adults below 15,000 in 2014-2016. For Latino adults, six states did not meeting this threshold:
Maine, Montana, North Dakota, South Dakota, West Virginia, and Vermont.
We did not eliminate states from the analysis that had an estimated Latino population that was below 15,000 in 2000 for three reasons. First,
the 2000 data were only included in one indicator — the change in attainment since 2000. Second, the 2000 Decennial Census is more robust
than the annual ACS surveys, limiting the effect of sampling error and providing more precise data. And finally, we wanted to include these
states because Census data indicated they had rapid growth in the number of Latinos.
FIGURE 11: ADULT LATINO DEGREE ATTAINMENT AND LATINO DEMOGRAPHY OF SELECT STATES
STATE Latino Attainment Latino Attainment Rank
Percentage
Mexican-American
Percentage
Puerto Rican
Percentage
Cuba-American
Percentage Other
Latino Origin
New Hampshire 36.5% 1 17% 32% 5% 46%
Florida 34.2% 2 12% 20% 29% 38%
Virginia 29.8% 3 20% 13% 2% 64%
Hawaii 29.5% 4 27% 34% 2% 37%
Ohio 26.9% 6 45% 29% 3% 24%
New York 26.6% 7 13% 28% 2% 58%
Maryland 26.5% 8 16% 9% 2% 73%
Massachusetts   24.6% 10 7% 38% 2% 54%
New Jersey 24.4% 11 13% 25% 4% 57%
Kentucky 24.2% 13 49% 11% 14% 26%
Connecticut 23.1% 16 11% 52% 2% 35%
Louisiana 22.8% 18 38% 6% 4% 52%
United States 22.6% n/a 61% 9% 4% 26%
Pennsylvania 22.0% 21 17% 47% 2% 33%
Delaware 21.2% 22 39% 31% 3% 27%
Rhode Island 20.0% 28 9% 23% 2% 66%
Note: Latino degree attainment figures are based on Ed Trust analysis of the United States Census Bureau’s 2014, 2015, and 2016 American
Community Surveys. The United States and Latino ethnic group demographic data are based on analysis of the 2016 American Community Survey.
The states included in the table are those that have Latino populations where fewer than half of adult Latinos are Mexican-American.
10
EDTRUST.ORG
Grades were assigned to each state based on how well each state compared with the other states on the degree attainment rate and the
change in degree attainment. We standardized the distribution of scores for each category by transforming each data point into a z-score
(subtracting the mean and dividing by the standard deviation across states). Grades were assigned based on the z-score’s position on the
normal curve. The cutoff scores for the grades were: F grades had z-scores below -1.036; D grades had z-scores above -1.036 but below -0.385;
C grades had z-scores between -0.385 and 0.385; B grades had z-scores above 0.385 but below 1.036; and A grades had z-scores above 1.036.
Pluses and minuses were added for further delineation by splitting each grade band into three equal portions based on the area under the
normal curve.
We also rated the degree attainment gap between Latino and White adults. The gap was rated as either “above average,” “average,” or
“below average.” An “above average” rating means that the state’s degree attainment gap was 0.75 standard deviation above the average gap
across all states. A “below average” rating means that the state’s degree attainment gap was 0.75 standard deviation below the average gap
across all states.
Endnotes
1 Bill Chappell, “Census Finds a More Diverse America, As Whites Lag Growth,” NPR, June 22, 2017, https://www.npr.org/sections/thetwo-
way/2017/06/22/533926978/census-finds-a-more-diverse-america-as-whites-lag-growth; Sandra L. Colby and Jennifer M. Ortman,“Projections of the
Size and Composition of the U.S. Population: 2014 to 2060,” U.S. Department of Commerce, U.S. Census Bureau, issued March 2015, https://census.gov/
content/dam/Census/library/publications/2015/demo/p25-1143.pdf
2 We excluded states from the analysis that had an average estimated population of Black or Latino adults below 15,000 in 2014-2016. For Latino adults, six
states did not meeting this threshold: Maine, Montana, North Dakota, South Dakota, West Virginia, and Vermont. We define adults as individuals ages 25 to
64. We use this age range because it roughly captures the age of working adults who are beyond the traditional college-aged years.
3 Anthony Carnevale, Nicole Smith and Jeff Strohl, Recovery: Job Growth and Education Requirements Through 2020,” Center on Education and the
Workforce (Washington, D.C.: Georgetown University, June 26, 2013), https://cew.georgetown.edu/wp-content/uploads/2014/11/Recovery2020.ES_.
Web_.pdf
4 U.S. Department of Labor, Bureau of Labor Statistics, Employment Projections, https://www.bls.gov/emp/ep_chart_001.htm; Jennifer Ma, Matea Pender,
and Meredith Welch, “Education Pays 2016,” Trends in Higher Education Series, (Washington, D.C.: College Board, 2016), https://trends.collegeboard.org/
sites/default/files/education-pays-2016-full-report.pdf
5 Anthony Carnevale, Stephen J. Rose, and Ban Cheah, The College Payoff: Education, Occupations, Lifetime Earnings, Center on Education and the
Workforce, (Washington, D.C.: Georgetown University, 2014), https://cew.georgetown.edu/wp-content/uploads/2014/11/collegepayoff-complete.pdf
6 Jennifer Ma, Matea Pender, and Meredith Welch, “Education Pays 2016,” Trends in Higher Education Series, https://trends.collegeboard.org/sites/
default/files/education-pays-2016-full-report.pdf
7 Philip Trostel, “It’s Not Just the Money: The Benefits of College Education to Individuals and to Society,” Lumina Issue Papers, (Indianapolis, IN: Lumina
Foundation, October 13, 2015), https://www.luminafoundation.org/files/resources/its-not-just-the-money.pdf
8  Jeanne Batalova and Jie Zong, “Cuban Immigrants in the United States,” Migration Policy Institute, November 9, 2017, https://www.migrationpolicy.org/
article/cuban-immigrants-united-states
9 Cynthia Feliciano, “Does Selective Migration Matter? Explaining Ethnic Disparities in Educational Attainment Among Immigrants’ Children,” International
Migration Review, October 6, 2006, http://onlinelibrary.wiley.com/doi/10.1111/j.1747-7379.2005.tb00291.x/abstract
10 Ivy Morgan and Ary Amerikaner, Funding Gaps 2018 (Washington, D.C.: The Education Trust, February 27, 2018), https://edtrust.org/resource/funding-
gaps-2018/
11 Civil Rights Data Collection, Data Snapshot: Teacher Equity, Issue Brief No. 4 (Washington, D.C.: U.S. Department of Education Office for Civil Rights,
March 2014), https://www2.ed.gov/about/offices/list/ocr/docs/crdc-teacher-equity-snapshot.pdf
12 Emily Deruy, “Where Calculus Class Isn’t an Option,” The Atlantic, June 7, 2006, https://www.theatlantic.com/education/archive/2016/06/where-
calculus-class-isnt-an-option/485987/
13 Course, Counselor, and Teacher Gaps: Addressing the College Readiness Challenge in High-Poverty High Schools (Washington, D.C.: CLASP, June 2015),
https://www.clasp.org/sites/default/files/public/resources-and-publications/publication-1/CollegeReadinessPaperFINALJune.pdf
11
EDTRUST.ORG
ABOUT THE EDUCATION TRUST
The EducationTrust is a nonprofit organization
that promotes closing opportunity gaps by
expanding excellence and equity in education
for students of color and those from low-income
families from pre-kindergarten through college.
Through research and advocacy, the organization
builds and engages diverse communities that care
about education equity, increases political and
public will to act on equity issues, and increases
college access and completion for historically
underserved students.
ACKNOWLEDGMENTS
We are grateful to Lumina Foundation for
providing support for this project.The views
expressed in this publication are those of the
authors and do not necessarily represent those of
Lumina Foundation, its officers or employees.
1250 H STREET, NW, SUITE 700, WASHINGTON, D.C. 20005
P 202-293-1217 F 202-293-2605 WWW.EDTRUST.ORG
Copyright © 2017 The Education Trust. All rights reserved.

Weitere ähnliche Inhalte

Was ist angesagt?

Dashboard 2015 - Boston Trends_07.29.15
Dashboard 2015 - Boston Trends_07.29.15Dashboard 2015 - Boston Trends_07.29.15
Dashboard 2015 - Boston Trends_07.29.15
William Want
 
VallasCriminalRecordsReport
VallasCriminalRecordsReportVallasCriminalRecordsReport
VallasCriminalRecordsReport
Tyler Cherry
 
Pres paa apr12_gonzales
Pres paa apr12_gonzalesPres paa apr12_gonzales
Pres paa apr12_gonzales
soder145
 
Ppt race and ethnic variations revised
Ppt race and ethnic variations revisedPpt race and ethnic variations revised
Ppt race and ethnic variations revised
Anna Montes
 
Community Profile of HIV AIDS within Atlanta Georgia
Community Profile of HIV AIDS within Atlanta GeorgiaCommunity Profile of HIV AIDS within Atlanta Georgia
Community Profile of HIV AIDS within Atlanta Georgia
Mary Akel
 

Was ist angesagt? (20)

Covid 19 Data Analysis 042420
Covid 19 Data Analysis 042420Covid 19 Data Analysis 042420
Covid 19 Data Analysis 042420
 
Social Progress Index 2014 - Country Scorecards
Social Progress Index 2014 - Country ScorecardsSocial Progress Index 2014 - Country Scorecards
Social Progress Index 2014 - Country Scorecards
 
Dashboard 2015 - Boston Trends_07.29.15
Dashboard 2015 - Boston Trends_07.29.15Dashboard 2015 - Boston Trends_07.29.15
Dashboard 2015 - Boston Trends_07.29.15
 
Covid19 Data Analysis 042220
Covid19 Data Analysis 042220Covid19 Data Analysis 042220
Covid19 Data Analysis 042220
 
VallasCriminalRecordsReport
VallasCriminalRecordsReportVallasCriminalRecordsReport
VallasCriminalRecordsReport
 
Pres paa apr12_gonzales
Pres paa apr12_gonzalesPres paa apr12_gonzales
Pres paa apr12_gonzales
 
NYC, Race, Covid-19 [timestamp Jun 12, 2020]
NYC, Race, Covid-19 [timestamp Jun 12, 2020]NYC, Race, Covid-19 [timestamp Jun 12, 2020]
NYC, Race, Covid-19 [timestamp Jun 12, 2020]
 
Who Has (And Doesn't Have) Health Insurance in Metro Atlanta
Who Has (And Doesn't Have) Health Insurance in Metro AtlantaWho Has (And Doesn't Have) Health Insurance in Metro Atlanta
Who Has (And Doesn't Have) Health Insurance in Metro Atlanta
 
Environics Research Federal Vote Intention September 2015
Environics Research Federal Vote Intention September 2015Environics Research Federal Vote Intention September 2015
Environics Research Federal Vote Intention September 2015
 
Progress Through People Luncheon Georgia's Evolving Demographics
Progress Through People Luncheon Georgia's Evolving DemographicsProgress Through People Luncheon Georgia's Evolving Demographics
Progress Through People Luncheon Georgia's Evolving Demographics
 
Ppt race and ethnic variations revised
Ppt race and ethnic variations revisedPpt race and ethnic variations revised
Ppt race and ethnic variations revised
 
Educational Attainment in Metro Atlanta
Educational Attainment in Metro AtlantaEducational Attainment in Metro Atlanta
Educational Attainment in Metro Atlanta
 
Black Men Making it in America
Black Men Making it in AmericaBlack Men Making it in America
Black Men Making it in America
 
Community Profile of HIV AIDS within Atlanta Georgia
Community Profile of HIV AIDS within Atlanta GeorgiaCommunity Profile of HIV AIDS within Atlanta Georgia
Community Profile of HIV AIDS within Atlanta Georgia
 
Newport 2012 Data in Your Backyard Presentation
Newport 2012 Data in Your Backyard PresentationNewport 2012 Data in Your Backyard Presentation
Newport 2012 Data in Your Backyard Presentation
 
Magavern report ppg
Magavern report ppgMagavern report ppg
Magavern report ppg
 
Stress america-2019
Stress america-2019Stress america-2019
Stress america-2019
 
The Atlantic/Aspen Institute American Values Survey
The Atlantic/Aspen Institute American Values SurveyThe Atlantic/Aspen Institute American Values Survey
The Atlantic/Aspen Institute American Values Survey
 
Four-Year Homeless Trends
Four-Year Homeless TrendsFour-Year Homeless Trends
Four-Year Homeless Trends
 
COLNP--London
COLNP--LondonCOLNP--London
COLNP--London
 

Ähnlich wie Latino degree-attainment

Bridging the Achievement Gap - The Need for Change in American Public Education
Bridging the Achievement Gap - The Need for Change in American Public EducationBridging the Achievement Gap - The Need for Change in American Public Education
Bridging the Achievement Gap - The Need for Change in American Public Education
Christin Siller
 
Since the 1960s, the United States Government has de.docx
Since the 1960s, the United States Government has de.docxSince the 1960s, the United States Government has de.docx
Since the 1960s, the United States Government has de.docx
jennifer822
 
Analyzing the western states projected demographics through 2020
Analyzing the western states projected demographics through 2020Analyzing the western states projected demographics through 2020
Analyzing the western states projected demographics through 2020
czjones
 

Ähnlich wie Latino degree-attainment (20)

Bridging the Achievement Gap - The Need for Change in American Public Education
Bridging the Achievement Gap - The Need for Change in American Public EducationBridging the Achievement Gap - The Need for Change in American Public Education
Bridging the Achievement Gap - The Need for Change in American Public Education
 
Since the 1960s, the United States Government has de.docx
Since the 1960s, the United States Government has de.docxSince the 1960s, the United States Government has de.docx
Since the 1960s, the United States Government has de.docx
 
Educ 202 presentation Shelby Thomas
Educ 202 presentation Shelby ThomasEduc 202 presentation Shelby Thomas
Educ 202 presentation Shelby Thomas
 
Poverty in the Lesbian, Gay, and Bisexual US
Poverty in the Lesbian, Gay, and Bisexual USPoverty in the Lesbian, Gay, and Bisexual US
Poverty in the Lesbian, Gay, and Bisexual US
 
Dominicans in Boston - 2017
Dominicans in Boston - 2017Dominicans in Boston - 2017
Dominicans in Boston - 2017
 
Family CROSSroads, Lesson 2: "The Target: Young People & Families"
Family CROSSroads, Lesson 2: "The Target: Young People & Families"Family CROSSroads, Lesson 2: "The Target: Young People & Families"
Family CROSSroads, Lesson 2: "The Target: Young People & Families"
 
Promising gains, but barriers remain
Promising gains, but barriers remainPromising gains, but barriers remain
Promising gains, but barriers remain
 
Arizona's Economic Imperative: Leading the Nation in Latino Student Success
Arizona's Economic Imperative: Leading the Nation in Latino Student SuccessArizona's Economic Imperative: Leading the Nation in Latino Student Success
Arizona's Economic Imperative: Leading the Nation in Latino Student Success
 
Arizona's Economic Imperative: Leading the Nation in Latino Student Success
Arizona's Economic Imperative: Leading the Nation in Latino Student SuccessArizona's Economic Imperative: Leading the Nation in Latino Student Success
Arizona's Economic Imperative: Leading the Nation in Latino Student Success
 
Sreb florida facts_report
Sreb florida facts_reportSreb florida facts_report
Sreb florida facts_report
 
Analyzing the western states projected demographics through 2020
Analyzing the western states projected demographics through 2020Analyzing the western states projected demographics through 2020
Analyzing the western states projected demographics through 2020
 
Salvadorans in Boston - 2017
Salvadorans in Boston - 2017Salvadorans in Boston - 2017
Salvadorans in Boston - 2017
 
The Cost of Dropping Out of High School
The Cost of Dropping Out of High SchoolThe Cost of Dropping Out of High School
The Cost of Dropping Out of High School
 
The American Middle Class
The American Middle ClassThe American Middle Class
The American Middle Class
 
Soe 2017 update_executivesummary
Soe 2017 update_executivesummarySoe 2017 update_executivesummary
Soe 2017 update_executivesummary
 
More than 1 in 5 Americans are unpaid caregivers
More than 1 in 5 Americans are unpaid caregiversMore than 1 in 5 Americans are unpaid caregivers
More than 1 in 5 Americans are unpaid caregivers
 
Ppt 8 overweight obesity in nys moore county.revised.2019
Ppt 8 overweight  obesity in nys  moore county.revised.2019Ppt 8 overweight  obesity in nys  moore county.revised.2019
Ppt 8 overweight obesity in nys moore county.revised.2019
 
Complete dissertation prospectus
Complete dissertation prospectusComplete dissertation prospectus
Complete dissertation prospectus
 
Ppt 8 overweight obesity in nys monroe county-2020
Ppt 8 overweight obesity in nys  monroe county-2020Ppt 8 overweight obesity in nys  monroe county-2020
Ppt 8 overweight obesity in nys monroe county-2020
 
Literature Review: Nutrition Education, Promotoras, & the Latino/a Population
Literature Review: Nutrition Education, Promotoras, & the Latino/a PopulationLiterature Review: Nutrition Education, Promotoras, & the Latino/a Population
Literature Review: Nutrition Education, Promotoras, & the Latino/a Population
 

Mehr von EducationNC

2023_EPP Performance Reporting_v2_347343yturdpaadaely1a0jhvpvg0k.pdf
2023_EPP Performance Reporting_v2_347343yturdpaadaely1a0jhvpvg0k.pdf2023_EPP Performance Reporting_v2_347343yturdpaadaely1a0jhvpvg0k.pdf
2023_EPP Performance Reporting_v2_347343yturdpaadaely1a0jhvpvg0k.pdf
EducationNC
 
FTE STATE BOARD SLIDE DECK (1)_3448851rr0iszrpy5ecvm1plgvnywf.pdf
FTE STATE BOARD SLIDE DECK (1)_3448851rr0iszrpy5ecvm1plgvnywf.pdfFTE STATE BOARD SLIDE DECK (1)_3448851rr0iszrpy5ecvm1plgvnywf.pdf
FTE STATE BOARD SLIDE DECK (1)_3448851rr0iszrpy5ecvm1plgvnywf.pdf
EducationNC
 
Government Affairs January 2023 SBE Budget Presentation (DRAFT)_3448671rr0isz...
Government Affairs January 2023 SBE Budget Presentation (DRAFT)_3448671rr0isz...Government Affairs January 2023 SBE Budget Presentation (DRAFT)_3448671rr0isz...
Government Affairs January 2023 SBE Budget Presentation (DRAFT)_3448671rr0isz...
EducationNC
 
SBE Strategic Plan Discussion - January 2023_3445821rr0iszrpy5ecvm1plgvnywf.pdf
SBE Strategic Plan Discussion - January 2023_3445821rr0iszrpy5ecvm1plgvnywf.pdfSBE Strategic Plan Discussion - January 2023_3445821rr0iszrpy5ecvm1plgvnywf.pdf
SBE Strategic Plan Discussion - January 2023_3445821rr0iszrpy5ecvm1plgvnywf.pdf
EducationNC
 

Mehr von EducationNC (20)

NC STEM Plan 2035
NC STEM Plan 2035NC STEM Plan 2035
NC STEM Plan 2035
 
Hispanic student experiences with transfer
Hispanic student experiences with transferHispanic student experiences with transfer
Hispanic student experiences with transfer
 
7Education-excerpt.pdf
7Education-excerpt.pdf7Education-excerpt.pdf
7Education-excerpt.pdf
 
Supt Truitt - Operation Polaris 2.0.pdf
Supt Truitt - Operation Polaris 2.0.pdfSupt Truitt - Operation Polaris 2.0.pdf
Supt Truitt - Operation Polaris 2.0.pdf
 
February Superintendent SBE Report 1.12.23_347984yturdpaadaely1a0jhvpvg0k.pdf
February Superintendent SBE Report 1.12.23_347984yturdpaadaely1a0jhvpvg0k.pdfFebruary Superintendent SBE Report 1.12.23_347984yturdpaadaely1a0jhvpvg0k.pdf
February Superintendent SBE Report 1.12.23_347984yturdpaadaely1a0jhvpvg0k.pdf
 
2023_EPP Performance Reporting_v2_347343yturdpaadaely1a0jhvpvg0k.pdf
2023_EPP Performance Reporting_v2_347343yturdpaadaely1a0jhvpvg0k.pdf2023_EPP Performance Reporting_v2_347343yturdpaadaely1a0jhvpvg0k.pdf
2023_EPP Performance Reporting_v2_347343yturdpaadaely1a0jhvpvg0k.pdf
 
2302_ESP_SOTP PPT_v3_347513yturdpaadaely1a0jhvpvg0k.pdf
2302_ESP_SOTP PPT_v3_347513yturdpaadaely1a0jhvpvg0k.pdf2302_ESP_SOTP PPT_v3_347513yturdpaadaely1a0jhvpvg0k.pdf
2302_ESP_SOTP PPT_v3_347513yturdpaadaely1a0jhvpvg0k.pdf
 
CS K12 Legislative Brief House Ed January 2023.pdf
CS K12 Legislative Brief House Ed January 2023.pdfCS K12 Legislative Brief House Ed January 2023.pdf
CS K12 Legislative Brief House Ed January 2023.pdf
 
FINAL_NCASA 2023 Legislative Priorities_rev. 1.6.23.pdf
FINAL_NCASA 2023 Legislative Priorities_rev. 1.6.23.pdfFINAL_NCASA 2023 Legislative Priorities_rev. 1.6.23.pdf
FINAL_NCASA 2023 Legislative Priorities_rev. 1.6.23.pdf
 
FTE STATE BOARD SLIDE DECK (1)_3448851rr0iszrpy5ecvm1plgvnywf.pdf
FTE STATE BOARD SLIDE DECK (1)_3448851rr0iszrpy5ecvm1plgvnywf.pdfFTE STATE BOARD SLIDE DECK (1)_3448851rr0iszrpy5ecvm1plgvnywf.pdf
FTE STATE BOARD SLIDE DECK (1)_3448851rr0iszrpy5ecvm1plgvnywf.pdf
 
Government Affairs January 2023 SBE Budget Presentation (DRAFT)_3448671rr0isz...
Government Affairs January 2023 SBE Budget Presentation (DRAFT)_3448671rr0isz...Government Affairs January 2023 SBE Budget Presentation (DRAFT)_3448671rr0isz...
Government Affairs January 2023 SBE Budget Presentation (DRAFT)_3448671rr0isz...
 
SBE Strategic Plan Discussion - January 2023_3445821rr0iszrpy5ecvm1plgvnywf.pdf
SBE Strategic Plan Discussion - January 2023_3445821rr0iszrpy5ecvm1plgvnywf.pdfSBE Strategic Plan Discussion - January 2023_3445821rr0iszrpy5ecvm1plgvnywf.pdf
SBE Strategic Plan Discussion - January 2023_3445821rr0iszrpy5ecvm1plgvnywf.pdf
 
COVID Impacts
COVID ImpactsCOVID Impacts
COVID Impacts
 
Pathways -- Statutory and other changes for Pilot Program - January 2023 Draf...
Pathways -- Statutory and other changes for Pilot Program - January 2023 Draf...Pathways -- Statutory and other changes for Pilot Program - January 2023 Draf...
Pathways -- Statutory and other changes for Pilot Program - January 2023 Draf...
 
States NOF Ex. A - Affidavit of Anca Grozav.pdf
States NOF Ex. A - Affidavit of Anca Grozav.pdfStates NOF Ex. A - Affidavit of Anca Grozav.pdf
States NOF Ex. A - Affidavit of Anca Grozav.pdf
 
Rule 14.3 Report to the Court.pdf
Rule 14.3 Report to the Court.pdfRule 14.3 Report to the Court.pdf
Rule 14.3 Report to the Court.pdf
 
Order Reassigning Case.pdf
Order Reassigning Case.pdfOrder Reassigning Case.pdf
Order Reassigning Case.pdf
 
Letter from Judge Robinson to Chief Justice Newby-2.pdf
Letter from Judge Robinson to Chief Justice Newby-2.pdfLetter from Judge Robinson to Chief Justice Newby-2.pdf
Letter from Judge Robinson to Chief Justice Newby-2.pdf
 
DRAFT JLEOC Committee Report.pdf
DRAFT JLEOC Committee Report.pdfDRAFT JLEOC Committee Report.pdf
DRAFT JLEOC Committee Report.pdf
 
221110_Model_Updated_3414051ndi34uk1r1sojyjj1jjmfxd.pdf
221110_Model_Updated_3414051ndi34uk1r1sojyjj1jjmfxd.pdf221110_Model_Updated_3414051ndi34uk1r1sojyjj1jjmfxd.pdf
221110_Model_Updated_3414051ndi34uk1r1sojyjj1jjmfxd.pdf
 

Kürzlich hochgeladen

1029-Danh muc Sach Giao Khoa khoi 6.pdf
1029-Danh muc Sach Giao Khoa khoi  6.pdf1029-Danh muc Sach Giao Khoa khoi  6.pdf
1029-Danh muc Sach Giao Khoa khoi 6.pdf
QucHHunhnh
 
Seal of Good Local Governance (SGLG) 2024Final.pptx
Seal of Good Local Governance (SGLG) 2024Final.pptxSeal of Good Local Governance (SGLG) 2024Final.pptx
Seal of Good Local Governance (SGLG) 2024Final.pptx
negromaestrong
 
Beyond the EU: DORA and NIS 2 Directive's Global Impact
Beyond the EU: DORA and NIS 2 Directive's Global ImpactBeyond the EU: DORA and NIS 2 Directive's Global Impact
Beyond the EU: DORA and NIS 2 Directive's Global Impact
PECB
 

Kürzlich hochgeladen (20)

On National Teacher Day, meet the 2024-25 Kenan Fellows
On National Teacher Day, meet the 2024-25 Kenan FellowsOn National Teacher Day, meet the 2024-25 Kenan Fellows
On National Teacher Day, meet the 2024-25 Kenan Fellows
 
INDIA QUIZ 2024 RLAC DELHI UNIVERSITY.pptx
INDIA QUIZ 2024 RLAC DELHI UNIVERSITY.pptxINDIA QUIZ 2024 RLAC DELHI UNIVERSITY.pptx
INDIA QUIZ 2024 RLAC DELHI UNIVERSITY.pptx
 
microwave assisted reaction. General introduction
microwave assisted reaction. General introductionmicrowave assisted reaction. General introduction
microwave assisted reaction. General introduction
 
Basic Civil Engineering first year Notes- Chapter 4 Building.pptx
Basic Civil Engineering first year Notes- Chapter 4 Building.pptxBasic Civil Engineering first year Notes- Chapter 4 Building.pptx
Basic Civil Engineering first year Notes- Chapter 4 Building.pptx
 
1029-Danh muc Sach Giao Khoa khoi 6.pdf
1029-Danh muc Sach Giao Khoa khoi  6.pdf1029-Danh muc Sach Giao Khoa khoi  6.pdf
1029-Danh muc Sach Giao Khoa khoi 6.pdf
 
Energy Resources. ( B. Pharmacy, 1st Year, Sem-II) Natural Resources
Energy Resources. ( B. Pharmacy, 1st Year, Sem-II) Natural ResourcesEnergy Resources. ( B. Pharmacy, 1st Year, Sem-II) Natural Resources
Energy Resources. ( B. Pharmacy, 1st Year, Sem-II) Natural Resources
 
Application orientated numerical on hev.ppt
Application orientated numerical on hev.pptApplication orientated numerical on hev.ppt
Application orientated numerical on hev.ppt
 
Seal of Good Local Governance (SGLG) 2024Final.pptx
Seal of Good Local Governance (SGLG) 2024Final.pptxSeal of Good Local Governance (SGLG) 2024Final.pptx
Seal of Good Local Governance (SGLG) 2024Final.pptx
 
Web & Social Media Analytics Previous Year Question Paper.pdf
Web & Social Media Analytics Previous Year Question Paper.pdfWeb & Social Media Analytics Previous Year Question Paper.pdf
Web & Social Media Analytics Previous Year Question Paper.pdf
 
Holdier Curriculum Vitae (April 2024).pdf
Holdier Curriculum Vitae (April 2024).pdfHoldier Curriculum Vitae (April 2024).pdf
Holdier Curriculum Vitae (April 2024).pdf
 
Explore beautiful and ugly buildings. Mathematics helps us create beautiful d...
Explore beautiful and ugly buildings. Mathematics helps us create beautiful d...Explore beautiful and ugly buildings. Mathematics helps us create beautiful d...
Explore beautiful and ugly buildings. Mathematics helps us create beautiful d...
 
Unit-IV- Pharma. Marketing Channels.pptx
Unit-IV- Pharma. Marketing Channels.pptxUnit-IV- Pharma. Marketing Channels.pptx
Unit-IV- Pharma. Marketing Channels.pptx
 
Sociology 101 Demonstration of Learning Exhibit
Sociology 101 Demonstration of Learning ExhibitSociology 101 Demonstration of Learning Exhibit
Sociology 101 Demonstration of Learning Exhibit
 
Beyond the EU: DORA and NIS 2 Directive's Global Impact
Beyond the EU: DORA and NIS 2 Directive's Global ImpactBeyond the EU: DORA and NIS 2 Directive's Global Impact
Beyond the EU: DORA and NIS 2 Directive's Global Impact
 
ComPTIA Overview | Comptia Security+ Book SY0-701
ComPTIA Overview | Comptia Security+ Book SY0-701ComPTIA Overview | Comptia Security+ Book SY0-701
ComPTIA Overview | Comptia Security+ Book SY0-701
 
Role Of Transgenic Animal In Target Validation-1.pptx
Role Of Transgenic Animal In Target Validation-1.pptxRole Of Transgenic Animal In Target Validation-1.pptx
Role Of Transgenic Animal In Target Validation-1.pptx
 
ICT Role in 21st Century Education & its Challenges.pptx
ICT Role in 21st Century Education & its Challenges.pptxICT Role in 21st Century Education & its Challenges.pptx
ICT Role in 21st Century Education & its Challenges.pptx
 
Unit-V; Pricing (Pharma Marketing Management).pptx
Unit-V; Pricing (Pharma Marketing Management).pptxUnit-V; Pricing (Pharma Marketing Management).pptx
Unit-V; Pricing (Pharma Marketing Management).pptx
 
psychiatric nursing HISTORY COLLECTION .docx
psychiatric  nursing HISTORY  COLLECTION  .docxpsychiatric  nursing HISTORY  COLLECTION  .docx
psychiatric nursing HISTORY COLLECTION .docx
 
Measures of Dispersion and Variability: Range, QD, AD and SD
Measures of Dispersion and Variability: Range, QD, AD and SDMeasures of Dispersion and Variability: Range, QD, AD and SD
Measures of Dispersion and Variability: Range, QD, AD and SD
 

Latino degree-attainment

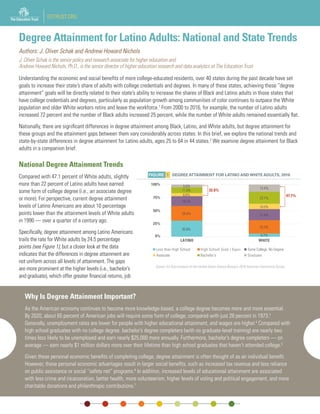
  • 1. 1 EDTRUST.ORG Degree Attainment for Latino Adults: National and State Trends Authors: J. Oliver Schak and Andrew Howard Nichols J. Oliver Schak is the senior policy and research associate for higher education and Andrew Howard Nichols, Ph.D., is the senior director of higher education research and data analytics at The Education Trust Understanding the economic and social benefits of more college-educated residents, over 40 states during the past decade have set goals to increase their state’s share of adults with college credentials and degrees. In many of these states, achieving these “degree attainment” goals will be directly related to their state’s ability to increase the shares of Black and Latino adults in those states that have college credentials and degrees, particularly as population growth among communities of color continues to outpace the White population and older White workers retire and leave the workforce.1 From 2000 to 2016, for example, the number of Latino adults increased 72 percent and the number of Black adults increased 25 percent, while the number of White adults remained essentially flat. Nationally, there are significant differences in degree attainment among Black, Latino, and White adults, but degree attainment for these groups and the attainment gaps between them vary considerably across states. In this brief, we explore the national trends and state-by-state differences in degree attainment for Latino adults, ages 25 to 64 in 44 states.2 We examine degree attainment for Black adults in a companion brief. National Degree Attainment Trends Compared with 47.1 percent of White adults, slightly more than 22 percent of Latino adults have earned some form of college degree (i.e., an associate degree or more). For perspective, current degree attainment levels of Latino Americans are about 10 percentage points lower than the attainment levels of White adults in 1990 — over a quarter of a century ago. Specifically, degree attainment among Latino Americans trails the rate for White adults by 24.5 percentage points (see Figure 1), but a closer look at the data indicates that the differences in degree attainment are not uniform across all levels of attainment. The gaps are more prominent at the higher levels (i.e., bachelor’s and graduate), which offer greater financial returns, job Why Is Degree Attainment Important? As the American economy continues to become more knowledge-based, a college degree becomes more and more essential. By 2020, about 65 percent of American jobs will require some form of college, compared with just 28 percent in 1973.3 Generally, unemployment rates are lower for people with higher educational attainment, and wages are higher.4 Compared with high school graduates with no college degree, bachelor’s degree completers (with no graduate-level training) are nearly two times less likely to be unemployed and earn nearly $25,000 more annually. Furthermore, bachelor’s degree completers — on average — earn nearly $1 million dollars more over their lifetime than high school graduates that haven’t attended college.5 Given these personal economic benefits of completing college, degree attainment is often thought of as an individual benefit. However, these personal economic advantages result in larger social benefits, such as increased tax revenue and less reliance on public assistance or social “safety net” programs.6 In addition, increased levels of educational attainment are associated with less crime and incarceration, better health, more volunteerism, higher levels of voting and political engagement, and more charitable donations and philanthropic contributions.7 30.8% 6.2% 28.4% 25.3% 18.3% 21.4% 6.6% 10.0% 11.0% 23.7% 5.0% 13.4% 0% 25% 50% 75% 100% LATINO WHITE Less than High School High School Grad / Equiv Some College, No Degree Associate Bachelor's Graduate DEGREE ATTAINMENT FOR LATINO AND WHITE ADULTS, 2016FIGURE 1 22.6% 47.1% Source: Ed Trust analysis of the United States Census Bureau’s 2016 American Community Survey.
  • 2. 2 EDTRUST.ORG security, and employment options in the labor market. The gap in attainment between Latino and White adults at the associate degree level is the smallest (i.e., 3.4 percentage points). But at the graduate degree level, only 5.0 percent of Latino adults have earned a degree compared with 13.4 percent of White adults — a gap of about 8 percentage points. The discrepancy is largest at the bachelor’s degree level, where the gap is 12.7 percentage points. Just 11.0 percent of Latino adults have attained a bachelor’s degree compared with 23.7 percent of White adults. There have been gains in degree attainment over time for Latino adults, but these gains have not been enough to close a persistent gap in Latino and White attainment. Since 2000, White degree attainment has increased by 9.5 percentage points, while Latino degree attainment has increased slightly more than 7 percentage points (see Figure 2). For Latino adults in 2000, associate degree attainment was 4.5 percent, and bachelor’s degree attainment was 7.0 percent. The White associate and bachelor’s degree attainment rates in 2000 were 7.8 percent and 19.3 percent, respectively. Gains in associate degree attainment and bachelor’s degree attainment are about the same for Latino and White adults. With respect to graduate level attainment, the rate was 3.9 percent for Latino adults in 2000, compared with 10.6 percent for Whites. For Latino adults, gains at the graduate degree level are only 1.1 percentage points, less than half the 2.8 percentage point gain for Whites. When you look at attainment by age, the overall gap in attainment is larger for younger Latinos given the limited growth in degree attainment for Latinos compared with White adults (see Figure 3). The attainment rate for young Latino adults (ages 25 to 34) is just about 4 percentage points higher than the rate for older Latino adults (ages 55 to 64), compared with an approximately 9 percentage point improvement between younger and older White adults. While the gap between older Latino and White adults was slightly more than 21 percentage points, attainment for young Latino adults, ages 25 to 34, is approximately 27 percentage points lower than that for their White peers. For 35 to 44 year olds, the attainment gap between Latino adults and White adults is even higher at nearly 30 percentage points. The national trends in degree attainment for Latino adults, including the slow growth in the attainment rate, are shaped mostly by 10 states that account for 78.2 percent of Latino adults (see Figure 4). California, Texas, Florida, and New York account for over three-fifths of Latino PERCENTAGE POINT GAINS IN DEGREE ATTAINMENT FOR LATINO AND WHITE ADULTS SINCE 2000FIGURE 2 2.0 4.0 1.1 7.1 2.2 4.5 2.8 9.5 0 2 4 6 8 Associate Bachelor's Graduate Total LATINO WHITE 10 DEGREE ATTAINMENT FOR LATINO AND WHITE ADULTS BY AGE, 2016FIGURE 3 24.5% 22.4% 21.6% 20.3% 51.0% 51.4% 45.8% 41.7% 0% 15% 30% 45% 60% 25-34 35-44 45-54 55-64 LATINO WHITE Source: Ed Trust analysis of the United States Census Bureau’s 2016 American Community Survey. Source: Ed Trust analysis of the United States Census Bureau’s 2016 American Community Survey and the 2000 Decennial Census. LATINO ADULT POPULATION BY STATE, 2016FIGURE 4 California 26.9% Texas 18.5% Florida 9.7% New York 6.9% Illinois 3.8% Arizona 3.6% New Jersey 3.3% Colorado 2.0% New Mexico 1.7% Georgia 1.6% All other states and DC 21.8% Source: Ed Trust analysis of the United States Census Bureau’s 2016 American Community Survey.
  • 3. 3 EDTRUST.ORG adults nationally, while Illinois, Arizona, New Jersey, Colorado, New Mexico, and Georgia add up to an additional 16 percent of Latino adults. Many other states have smaller shares of Latino adults, but have seen rapidly growing Latino populations the last few decades. A closer look at trends in each state can shed more light on Latino attainment. State Attainment Trends In this section, we examine state-level data on the following: 1) Latino degree attainment, 2) Latino attainment change since 2000, and 3) attainment gaps between Latino and White adults. Narratives describing the data are below, but state ranks, grades, and ratings for each of the three indicators can be found on Table 1 on page 4. We also include a map showing how states compare on Latino degree attainment and attainment gaps on page 5. 2016 Latino Degree Attainment When you examine differences in degree attainment for Latino adults by state, most states have rates that fall within roughly 5 percentage points of the national average, which is approximately 22 percentage points (see Figure 5). But there are several states that stand out at both the high and low end of the distribution. On the high end, New Hampshire, Florida, Virginia, Hawaii, and Alaska all have degree attainment rates that are close to or exceed 30 percent. The outlier in this group is Florida, where one-fourth of adults are Latino; the other states have Latino population shares below 10 percent. Several states in New England and the Mid-Atlantic — New York, Massachusetts, Maryland, and New Hampshire — are among the top 10 states for Latino degree attainment. In this group, New York stands out with its Latino share of adults at 18.3 percent — the fourth largest Latino population in the country. On the lower end of the attainment distribution for Latino adults are Idaho, Arkansas, Nevada, Nebraska, and Oklahoma. These states have degree attainment rates that are near or below 16 percent. Idaho has the lowest degree attainment rate for Latino adults at 12.7 percent, and Arkansas has the second lowest at 12.9 percent. These states with lower attainment tend to be more sparsely populated and have lower than average shares of Latino adults. However, Nevada is an exception with most adults living around Las Vegas and a share of Latino adults around 26 percent. The share of Latino adults is 10.6 percent in Idaho, but less than 10 percent in Oklahoma, Nebraska, and Arkansas. It is also noteworthy that none of the 10 states with the lowest Latino attainment rates are in New England or the Mid-Atlantic. Hawaii and Alaska are the only states in Pacific and Mountain states with attainment rates in the top 10, and both have small shares of Latino adults. Among states near the border with Mexico that have large shares of Latino adults, Colorado (ranked 19th ) and New Mexico (15th ) have attainment rates near the national average (22-23 percent), while California (38th ), Texas (30th ), and Arizona (33rd ) hover between 18 and 20 percent. DEGREE ATTAINMENT FOR LATINO ADULTS BY STATEFIGURE 5 12.7% 12.9% 14.4% 15.2% 15.8% 18.2% 18.3% 18.5% 18.6% 18.6% 18.8% 19.0% 19.6% 19.7% 19.7% 20.0% 20.0% 20.1% 20.4% 20.4% 20.6% 20.8% 21.2% 22.0% 22.0% 22.2% 22.8% 23.0% 23.1% 23.2% 23.2% 24.2% 24.3% 24.4% 24.6% 26.4% 26.5% 26.6% 26.9% 28.3% 29.5% 29.8% 34.2% 36.5% 0% 15% 30% 45% IDAHO ARKANSAS NEVADA NEBRASKA OKLAHOMA UTAH CALIFORNIA TENNESSEE INDIANA KANSAS NORTHCAROLINA ARIZONA OREGON WISCONSIN TEXAS ALABAMA RHODEISLAND SOUTHCAROLINA ILLINOIS MISSISSIPPI IOWA GEORGIA DELAWARE PENNSYLVANIA WASHINGTON COLORADO LOUISIANA MINNESOTA CONNECTICUT NEWMEXICO WYOMING KENTUCKY MICHIGAN NEWJERSEY MASSACHUSETTS MISSOURI MARYLAND NEWYORK OHIO ALASKA HAWAII VIRGINIA FLORIDA NEWHAMPSHIRE Source: Ed Trust analysis of the United States Census Bureau’s 2014, 2015, and 2016 American Community Surveys.
  • 4. 4 EDTRUST.ORG Table 1: Latino Degree Attainment Indicators by State • 4 • Degree Attainment Rate Change in Degree Attainment Degree Attainment Gap State Percentage of Adults that are Latino Latino Attainment Latino Attainment Rank Grade for Latino Attainment Latino Attainment Change Since 2000 (percentage points) Latino Attainment Change Since 2000 Rank Grade for Change in Latino Attainment Latino- White Gap (percentage points) Latino-White Gap Rank Rating for Latino-White Gap* Gap Change Since 2000 (percentage points) Alabama 3.6% 20.0% 29 D+ 0.2 40 F 17.6 11 below average 7.8 Alaska 5.8% 28.3% 5 A 0.6 39 F 15.4 7 below average 4.6 Arizona 28.8% 19.0% 33 D 5.8 16 B- 26.9 27 average 0.8 Arkansas 6.1% 12.9% 43 F 3.0 34 D 19.8 14 average 4.9 California 36.2% 18.3% 38 D 5.9 15 B- 35.1 44 above average 1.8 Colorado 18.9% 22.2% 19 C 6.5 10 B+ 34.1 43 above average 1.8 Connecticut 14.6% 23.1% 16 C+ 6.7 8 B+ 31.9 40 above average 1.7 Delaware 8.3% 21.2% 22 C- 3.1 33 D+ 23.2 19 average 2.8 Florida 25.5% 34.2% 2 A+ 8.2 2 A 10.0 1 below average -0.5 Georgia 8.5% 20.8% 23 C- 3.3 31 D+ 23.0 18 average 4.3 Hawaii 9.0% 29.5% 4 A 7.0 7 B+ 26.5 26 average 1.0 Idaho 10.6% 12.7% 44 F 2.6 35 D- 27.0 28 average 4.4 Illinois 15.8% 20.4% 26 C- 7.3 5 A- 30.0 39 above average 2.4 Indiana 5.8% 18.6% 36 D 3.3 32 D+ 19.5 13 average 5.9 Iowa 4.8% 20.6% 24 C- 4.9 23 C+ 24.5 22 average 6.6 Kansas 10.2% 18.6% 35 D 5.5 18 B- 27.8 33 average 3.0 Kentucky 2.9% 24.2% 13 B- 6.0 14 B- 10.1 2 below average 3.7 Louisiana 4.9% 22.8% 18 C+ -1.7 44 F 12.8 4 below average 9.2 Maryland 9.1% 26.5% 8 B+ 0.0 42 F 27.0 29 average 9.0 Massachusetts 10.2% 24.6% 10 B- 5.1 21 C+ 32.8 41 above average 4.5 Michigan 4.2% 24.3% 12 B- 5.4 20 C+ 17.3 10 below average 2.5 Minnesota 4.5% 23.0% 17 C+ 4.6 26 C 29.5 37 above average 7.4 Mississippi 2.7% 20.4% 25 C- 2.1 38 D- 16.4 8 below average 5.4 Missouri 3.4% 26.4% 9 B+ 4.6 27 C 13.9 6 below average 4.4 Nebraska 9.2% 15.2% 41 F 3.8 30 C- 33.2 42 above average 6.5 Nevada 25.9% 14.4% 42 F 5.5 19 C+ 23.6 21 average 2.9 New Hampshire 3.0% 36.5% 1 A+ 4.5 29 C 11.6 3 below average 3.1 New Jersey 19.4% 24.4% 11 B- 7.4 4 A- 29.5 38 above average 2.8 New Mexico 45.9% 23.2% 15 C+ 6.1 13 B 27.2 30 average 0.1 New York 18.3% 26.6% 7 B+ 9.1 1 A+ 28.7 36 above average 0.9 North Carolina 8.1% 18.8% 34 D 4.7 25 C 28.1 34 average 6.4 Ohio 3.1% 26.9% 6 B+ 5.7 17 B- 13.3 5 below average 3.3 Oklahoma 8.7% 15.8% 40 F 2.4 36 D- 21.8 16 average 5.4 Oregon 11.0% 19.6% 32 D+ 6.4 12 B 24.9 23 average 2.1 Pennsylvania 6.2% 22.0% 21 C 5.1 22 C+ 22.3 17 average 5.0 Rhode Island 13.2% 20.0% 28 D+ 7.1 6 B+ 27.7 32 average 0.7 South Carolina 5.0% 20.1% 27 D+ 0.1 41 F 23.5 20 average 9.0 Tennessee 4.5% 18.5% 37 D -0.4 43 F 18.7 12 average 9.4 Texas 36.2% 19.7% 30 D+ 6.7 9 B+ 27.7 31 average 1.2 Utah 13.0% 18.2% 39 D 4.5 28 C 28.4 35 average 4.0 Virginia 8.6% 29.8% 3 A 4.8 24 C 21.6 15 average 4.6 Washington 10.4% 22.0% 20 C 6.4 11 B 25.9 24 average 0.9 Wisconsin 5.7% 19.7% 31 D+ 2.3 37 D- 26.2 25 average 8.2 Wyoming 8.9% 23.2% 14 C+ 7.9 3 A 17.2 9 below average -0.9 EDTRUST.ORG *”Below average” means the attainment gap is smaller than the gap in most states. “Above average” means the attainment gap is larger than the gap in most states. See “About the Data” for more details. Source: Ed Trust analysis of the United States Census Bureau’s 2014, 2015, and 2016 American Community Surveys.
  • 5. 5 EDTRUST.ORG Above average Latino degree attainment and a degree attainment gap that is ≤ 15.3 percentage points. Above average Latino degree attainment and a degree attainment gap that is > 15.3 percentage points. Below average Latino degree attainment and a degree attainment gap that is ≤ 15.3 percentage points. Below average Latino degree attainment and a degree attainment gap that is > 15.3 percentage points. Fewer than 15,000 Latino adults WA OR CA NV ID MT WY AZ CO NM TX AK HI OK KS NE ND MN IA MO LA MS AL TN KY IL WI MI OH PA WV VA SC GA FL NY VT NH MA CT RI NJ DE MD ME UT SD AR IN NC LATINOEDUCATIONATTAINMENTANDLATINO–WHITEATTAINMENTGAPBYSTATE Source:EdTrustanalysisoftheUnitedStatesCensusBureau’s2014,2015,and2016AmericanCommunitySurveys. • 5 • EDTRUST.ORG
  • 6. 6 EDTRUST.ORG Attainment Change Since 2000 Since 2000, 40 states we examined have seen have seen increases over 1.0 percentage points in degree attainment for Latino adults, while six states have seen little change in attainment (see Figure 6). Typically, larger states with higher percentages of Latino adults experienced higher or above average change, while many smaller states with lower percentages of Latino adults exhibited very little change in attainment. Florida and New York stand out as states with large Latino populations that have improved the most. Florida has increased Latino attainment by 8.2 percentage points, while New York has seen the most improvement with a 9.1 percentage point gain. Other states in the top 10 on attainment change include New Jersey, Connecticut, and Rhode Island in New England and the Mid-Atlantic along with Texas, Illinois, Colorado, Hawaii, and Wyoming. In the South, only Kentucky, Texas, and Florida rank in the top half of states. Several states experienced very little change in attainment levels over the past decade and a half. Maryland, Tennessee, South Carolina, Louisiana, Alabama, and Alaska all saw little change in Latino attainment. These states only account for about 3 percent of all Latino adults, but have experienced rapid migration of Latino adults since 2000. With a 2.6 percentage point gain in attainment since 2000, Idaho is the only state in the bottom 10 that has a Latino share of adults over 10 percent. Among Pacific and Mountain states with high percentages of Latino adults, California, Colorado, Arizona, New Mexico, and Nevada all show change close to the national average at about 6 percent. Attainment Gaps Between Latino and White Adults In every state in our sample, there is a gap between degree attainment rates for Latino and White adults. And in half of the states that gap that exceeds 25 percentage points (see Figure 7). At about 10 percentage points, Florida and Kentucky have the smallest PERCENTAGE POINT GAP IN LATINO AND WHITE DEGREE ATTAINMENT FOR ADULTS BY STATEFIGURE 7 35.1 34.1 33.2 32.8 31.9 30.0 29.5 29.5 28.7 28.4 28.1 27.8 27.7 27.7 27.2 27.0 27.0 26.9 26.5 26.2 25.9 24.9 24.5 23.6 23.5 23.2 23.0 22.3 21.8 21.6 19.8 19.5 18.7 17.6 17.3 17.2 16.4 15.4 13.9 13.3 12.8 11.6 10.1 10.0 0 10 20 30 40 CALIFORNIA COLORADO NEBRASKA MASSACHUSETTS CONNECTICUT ILLINIOS NEWJERSEY MINNESOTA NEWYORK UTAH NORTHCAROLINA KANSAS RHODEISLAND TEXAS NEWMEXICO MARYLAND IDAHO ARIZONA HAWAII WISCONSIN WASHINGTON OREGON IOWA NEVADA SOUTHCAROLINA DELAWARE GEORGIA PENNSYLVANIA OKLAHOMA VIRGINIA ARKANSAS INDIANA TENNESSEE ALABAMA MICHIGAN WYOMING MISSISSIPPI ALASKA MISSOURI OHIO LOUISIANA NEWHAMPSHIRE KENTUCKY FLORIDA PERCENTAGE POINT GAINS IN DEGREE ATTAINMENT FOR LATINO ADULTS SINCE 2000 BY STATEFIGURE 6 -1.7 -0.4 0.0 0.1 0.2 0.6 2.1 2.3 2.4 2.6 3.0 3.1 3.3 3.3 3.8 4.5 4.5 4.6 4.6 4.7 4.8 4.9 5.1 5.1 5.4 5.5 5.5 5.7 5.8 5.9 6.0 6.1 6.4 6.4 6.5 6.7 6.7 7.0 7.1 7.3 7.4 7.9 8.2 9.1 -4 -2 0 2 4 6 8 *LOUISIANA *TENNESSEE *MARYLAND *SOUTHCAROLINA *ALABAMA *ALASKA *MISSISSIPPI *WISCONSIN OKLAHOMA *IDAHO *ARKANSAS *DELAWARE INDIANA GEORGIA NEBRASKA *NEWHAMPSHIRE UTAH MISSOURI MINNESOTA NORTHCAROLINA VIRGINIA IOWA PENNSYLVANIA MASSACHUSETTS MICHIGAN NEVADA KANSAS OHIO ARIZONA CALIFORNIA KENTUCKY NEWMEXICO OREGON WASHINGTON COLORADO TEXAS CONNECTICUT HAWAII RHODEISLAND ILLINOIS NEWJERSEY WYOMING FLORIDA NEWYORK *Change in degree attainment rate not statistically significant from zero based on an independent sample t-test at the 95 percent level of significance Source: Ed Trust analysis of the United States Census Bureau’s 2014, 2015, and 2016 American Community Surveys. Source: Ed Trust analysis of the United States Census Bureau’s 2014, 2015, and 2016 American Community Surveys and the 2000 Decennial Census.
  • 7. 7 EDTRUST.ORG attainment gaps in the country; however, their gaps are partly a function of having low-to-average attainment rates for White adults. Florida again stands out for having a low attainment gap and a large share of Latino adults, whereas Kentucky has a much smaller Latino community. The next three states with the smallest gaps (New Hampshire, Louisiana, and Ohio) have shares of Latino adults below 5 percent. Michigan, Missouri, Mississippi, Alaska, and Wyoming are also among the 10 states with the smallest attainment gaps. These states have attainment rates near or above the national average, but all have percentages of Latino adults below 10 percent. On the other end of the spectrum, California, Colorado, Nebraska, Massachusetts, Connecticut, and Illinois all have extreme inequality in degree attainment between Latino and White adults, with gaps of at least 30 percentage points. These gaps are especially problematic because these states account for about one in three Latino adults. California has the most Latino adults of any state and the largest gap at 35.1 percentage points. Colorado has a gap at 34.1 percentage points and the eighth largest Latino adult population. Diversity of Latino Adults Although typically grouped together into a single statistical category, Latino adults represent diverse ethnic communities that have reached differing levels of degree attainment. About 42 percent of Latino adults were born in the 50 states and District of Columbia, while the remaining 58 percent were either foreign born or born in a territory of the United States (e.g., Puerto Rico). However, this composition varies greatly by state (see Figure 8). For example, over two-thirds of Latino adults are native-born in New Mexico, Hawaii, and Wyoming; while less than 25 percent are native-born in Georgia, North Carolina, and Maryland. New Mexico and Colorado are the only border states with Mexico that has well over a 50 percent share of native-born Latino adults. Native-born Latino adults are much more likely to hold some form of college degree. The attainment rate for this group is 29.8 percent, compared with 17.2 percent for Latino adults born outside the United States (see Figure 9). Among native-born Latino adults, about 85 percent have attained at least a high school diploma or equivalent degree, compared with barely 57 percent of Latino adults who were born outside the United States. However, it is important to note that the attainment rate for native-born SHARE OF LATINO ADULTS WHO ARE NATIVE-BORN BY STATE, 2016FIGURE 8 79.1% 0% 25% 50% 75% 100% HAWAII NEWMEXICO WYOMING COLORADO ALASKA OHIO MICHIGAN ARIZONA NEWHAMPSHIRE TEXAS IDAHO WISCONSIN MISSOURI OKLAHOMA INDIANA PENNSYLVANIA CALIFORNIA KANSAS WASHINGTON UTHA OREGON CONNECTICUT ILLINIOS LOUISIANA IOWA NEWYORK MISSISSIPPI KENTUCKY NEVADA NEBRASKA RHODEISLAND MINNESOTA ARKANSAS NEWJERSEY ALABAMA DELAWARE MASSACHUSETTS TENNESSEE FLORIDA SOUTHCAROLINA VIRGINIA NORTHCAROLINA GEORGIA MARYLAND 76.2% 70.8% 59.3% 59.1% 56.9% 56.2% 54.5% 53.8% 52.3% 51.0% 47.5% 46.2% 43.9% 43.9% 43.8% 43.0% 43.0% 42.1% 41.6% 39.7% 39.5% 39.3% 37.5% 36.4% 36.3% 35.3% 35.0% 34.3% 34.2% 32.6% 31.5% 31.5% 31.4% 31.0% 29.9% 28.9% 27.6% 27.1% 26.3% 23.4% 22.7% 22.7% 44.4% DEGREE ATTAINMENT FOR LATINO ADULTS BY BIRTHPLACE, 2016FIGURE 9 14.6% 42.7% 29.8% 27.4%25.9% 12.7%9.1% 4.7%14.4% 8.5% 6.3% 4.0% NATIVE-BORN NON-NATIVE-BORN 0% 25% 50% 75% 100% Less than High School High School Grad / Equiv Some College, No Degree Associate Bachelor's Graduate 29.8% 17.2% Source: Ed Trust analysis of the United States Census Bureau’s 2016 American Community Survey. Source: Ed Trust analysis of the United States Census Bureau’s 2016 American Community Surveys.
  • 8. 8 EDTRUST.ORG Latino adults is nearly 20 percentage points less than the attainment rate for White adults. Latino adults are also diverse in terms of their country or territory of origin (either through birth or ancestry). A clear majority (60.8 percent) of Latino adults identify as Mexican-American, but others commonly identify as Cuban-American (4.2 percent), Puerto Rican (9.5 percent), or another ethnic group from Central or South America (25.5 percent). Latino degree attainment is generally lower among Mexican-Americans compared with the other three categories (see Figure 10). Degree attainment for Mexican-Americans is 17.4 percent compared with nearly 30 percent for Puerto Ricans and nearly 40 percent for Cuban- Americans. Varied representation of Latino ethnic groups across the country and in states, in part, explains why some states have much higher attainment rates compared to the nation as whole (see Figure 11). For example, Florida has the second highest Latino attainment rate and the third largest Latino population, but nearly half of its Latino adults are either Cuban-American or Puerto Rican compared to only one-seventh of Latino adults in the United States. A few factors explain gaps in attainment between subgroups of Latino Americans. Latino Americans born in the United States are citizens and benefit from having access to educational supports, such as in-state tuition at public universities and community colleges and eligibility for federal and state financial aid. Similarly, adults who were born in Puerto Rico are American citizens and typically have had greater access to higher education (before and after migration) than other Latino Americans. Cuban immigrants also benefit from the ability to apply for permanent residency status within one year of arrival, regardless of whether they were authorized to enter the country.8 Latinos in other ethnic groups, particularly if they or their parents where unauthorized immigrants, do not benefit from these advantages. Another factor is that Latino adults born outside the United States vary widely in their educational attainment and socioeconomic status prior to migration. For instance, many Cuban-American adults have arrived in the United States with higher levels of educational attainment and social capital than the average Latino immigrant. Research suggests that how immigrants differ educationally from non-migrants in the home country can influence the college enrollment and attainment of subsequent generations.9 Thus, differences in educational attainment prior to migration may contribute to sustained gaps in attainment between subgroups of Latino Americans. Conclusion As states continue to pursue their goals to increase the share of adults that have some form of postsecondary credential, it is imperative that states enact policies, interventions, and incentives that will enable more Latino students to successfully navigate the traditional educational pathway to degree completion and help Latino adults — who may have dropped out of college, never enrolled, or grew up outside the United States — find a pathway to completing a college credential or degree. The data in this brief show that Latino attainment rates in many states are far too low and significantly trail rates for White adults. We know that racial and ethnic gaps in attainment are the result of various factors, such as historical — and current — economic, social, and educational barriers that systemically disadvantage and stifle the progress of Latino people in this country. Many Latinos immigrate to the United States with less education, wealth, and social capital than other immigrants. Too many Latino immigrants face the threat of deportation and lack access to key educational supports, such as in-state tuition and financial aid. Research shows these barriers slow the upward social mobility of Latino immigrants and their families. 0% 25% 50% 75% 100% Less than High School High School Grad / Equiv Some College, No Degree Associate Bachelor's Graduate DEGREE ATTAINMENT FOR LATINO ADULTS BY ORIGIN, 2016FIGURE 10 36.0% 17.4% 13.7% 26.1% 28.8% 30.7% 30.3% 26.2% 17.8% 22.2% 16.1% 18.5% 5.5% 10.0% 10.2% 7.1% 8.7% 12.9% 19.0% 14.6% 3.2% 6.8% 10.7% 7.5% MEXICO PUERTO RICO CUBA OTHER 17.4% 29.7% 39.9% 29.2% Source: Ed Trust analysis of the United States Census Bureau’s 2016 American Community Survey.
  • 9. 9 EDTRUST.ORG More broadly, Latinos also experience inequities linked to discrimination and prejudice against non-White Americans. Inequities in the criminal justice system are clear examples that influence educational attainment. We know that our education system, on average, sends Latino students to schools with less funding and resources,10 fewer experienced teachers,11 less rigorous curricular options,12 and fewer school counselors.13 Making matters worse, teachers and schools often do not meet the needs of bilingual students or develop curriculums that are culturally relevant for Latino students. These systemic barriers can only be addressed through interventions and policies that prioritize eliminating racial and ethnic disparities, especially those that stifle opportunities for first- and second-generation Latino Americans. About the Data In this brief, we use data from the United States Census Bureau to examine degree attainment at the state and national level. Degree attainment is defined as the percentage of adults between the ages of 25 and 64 that have some form of postsecondary degree (i.e., an associate, bachelor’s, or graduate degree). For the national degree attainment estimates, we used the United States Census Bureau’s 2016 American Community Survey. These data include adults in all states, the District of Columbia (Washington D.C.), Puerto Rico, and overseas military installations. The degree attainment estimates for states were calculated using three-year averages of data from the United States Census Bureau’s American Community Surveys from 2014, 2015, and 2016. We used a three-year average to mitigate the influence of sampling error and single- year anomalies for states with small populations. To further address the influence of sampling error, we excluded states from the analysis that had an average estimated population of Latino adults below 15,000 in 2014-2016. For Latino adults, six states did not meeting this threshold: Maine, Montana, North Dakota, South Dakota, West Virginia, and Vermont. We did not eliminate states from the analysis that had an estimated Latino population that was below 15,000 in 2000 for three reasons. First, the 2000 data were only included in one indicator — the change in attainment since 2000. Second, the 2000 Decennial Census is more robust than the annual ACS surveys, limiting the effect of sampling error and providing more precise data. And finally, we wanted to include these states because Census data indicated they had rapid growth in the number of Latinos. FIGURE 11: ADULT LATINO DEGREE ATTAINMENT AND LATINO DEMOGRAPHY OF SELECT STATES STATE Latino Attainment Latino Attainment Rank Percentage Mexican-American Percentage Puerto Rican Percentage Cuba-American Percentage Other Latino Origin New Hampshire 36.5% 1 17% 32% 5% 46% Florida 34.2% 2 12% 20% 29% 38% Virginia 29.8% 3 20% 13% 2% 64% Hawaii 29.5% 4 27% 34% 2% 37% Ohio 26.9% 6 45% 29% 3% 24% New York 26.6% 7 13% 28% 2% 58% Maryland 26.5% 8 16% 9% 2% 73% Massachusetts   24.6% 10 7% 38% 2% 54% New Jersey 24.4% 11 13% 25% 4% 57% Kentucky 24.2% 13 49% 11% 14% 26% Connecticut 23.1% 16 11% 52% 2% 35% Louisiana 22.8% 18 38% 6% 4% 52% United States 22.6% n/a 61% 9% 4% 26% Pennsylvania 22.0% 21 17% 47% 2% 33% Delaware 21.2% 22 39% 31% 3% 27% Rhode Island 20.0% 28 9% 23% 2% 66% Note: Latino degree attainment figures are based on Ed Trust analysis of the United States Census Bureau’s 2014, 2015, and 2016 American Community Surveys. The United States and Latino ethnic group demographic data are based on analysis of the 2016 American Community Survey. The states included in the table are those that have Latino populations where fewer than half of adult Latinos are Mexican-American.
  • 10. 10 EDTRUST.ORG Grades were assigned to each state based on how well each state compared with the other states on the degree attainment rate and the change in degree attainment. We standardized the distribution of scores for each category by transforming each data point into a z-score (subtracting the mean and dividing by the standard deviation across states). Grades were assigned based on the z-score’s position on the normal curve. The cutoff scores for the grades were: F grades had z-scores below -1.036; D grades had z-scores above -1.036 but below -0.385; C grades had z-scores between -0.385 and 0.385; B grades had z-scores above 0.385 but below 1.036; and A grades had z-scores above 1.036. Pluses and minuses were added for further delineation by splitting each grade band into three equal portions based on the area under the normal curve. We also rated the degree attainment gap between Latino and White adults. The gap was rated as either “above average,” “average,” or “below average.” An “above average” rating means that the state’s degree attainment gap was 0.75 standard deviation above the average gap across all states. A “below average” rating means that the state’s degree attainment gap was 0.75 standard deviation below the average gap across all states. Endnotes 1 Bill Chappell, “Census Finds a More Diverse America, As Whites Lag Growth,” NPR, June 22, 2017, https://www.npr.org/sections/thetwo- way/2017/06/22/533926978/census-finds-a-more-diverse-america-as-whites-lag-growth; Sandra L. Colby and Jennifer M. Ortman,“Projections of the Size and Composition of the U.S. Population: 2014 to 2060,” U.S. Department of Commerce, U.S. Census Bureau, issued March 2015, https://census.gov/ content/dam/Census/library/publications/2015/demo/p25-1143.pdf 2 We excluded states from the analysis that had an average estimated population of Black or Latino adults below 15,000 in 2014-2016. For Latino adults, six states did not meeting this threshold: Maine, Montana, North Dakota, South Dakota, West Virginia, and Vermont. We define adults as individuals ages 25 to 64. We use this age range because it roughly captures the age of working adults who are beyond the traditional college-aged years. 3 Anthony Carnevale, Nicole Smith and Jeff Strohl, Recovery: Job Growth and Education Requirements Through 2020,” Center on Education and the Workforce (Washington, D.C.: Georgetown University, June 26, 2013), https://cew.georgetown.edu/wp-content/uploads/2014/11/Recovery2020.ES_. Web_.pdf 4 U.S. Department of Labor, Bureau of Labor Statistics, Employment Projections, https://www.bls.gov/emp/ep_chart_001.htm; Jennifer Ma, Matea Pender, and Meredith Welch, “Education Pays 2016,” Trends in Higher Education Series, (Washington, D.C.: College Board, 2016), https://trends.collegeboard.org/ sites/default/files/education-pays-2016-full-report.pdf 5 Anthony Carnevale, Stephen J. Rose, and Ban Cheah, The College Payoff: Education, Occupations, Lifetime Earnings, Center on Education and the Workforce, (Washington, D.C.: Georgetown University, 2014), https://cew.georgetown.edu/wp-content/uploads/2014/11/collegepayoff-complete.pdf 6 Jennifer Ma, Matea Pender, and Meredith Welch, “Education Pays 2016,” Trends in Higher Education Series, https://trends.collegeboard.org/sites/ default/files/education-pays-2016-full-report.pdf 7 Philip Trostel, “It’s Not Just the Money: The Benefits of College Education to Individuals and to Society,” Lumina Issue Papers, (Indianapolis, IN: Lumina Foundation, October 13, 2015), https://www.luminafoundation.org/files/resources/its-not-just-the-money.pdf 8 Jeanne Batalova and Jie Zong, “Cuban Immigrants in the United States,” Migration Policy Institute, November 9, 2017, https://www.migrationpolicy.org/ article/cuban-immigrants-united-states 9 Cynthia Feliciano, “Does Selective Migration Matter? Explaining Ethnic Disparities in Educational Attainment Among Immigrants’ Children,” International Migration Review, October 6, 2006, http://onlinelibrary.wiley.com/doi/10.1111/j.1747-7379.2005.tb00291.x/abstract 10 Ivy Morgan and Ary Amerikaner, Funding Gaps 2018 (Washington, D.C.: The Education Trust, February 27, 2018), https://edtrust.org/resource/funding- gaps-2018/ 11 Civil Rights Data Collection, Data Snapshot: Teacher Equity, Issue Brief No. 4 (Washington, D.C.: U.S. Department of Education Office for Civil Rights, March 2014), https://www2.ed.gov/about/offices/list/ocr/docs/crdc-teacher-equity-snapshot.pdf 12 Emily Deruy, “Where Calculus Class Isn’t an Option,” The Atlantic, June 7, 2006, https://www.theatlantic.com/education/archive/2016/06/where- calculus-class-isnt-an-option/485987/ 13 Course, Counselor, and Teacher Gaps: Addressing the College Readiness Challenge in High-Poverty High Schools (Washington, D.C.: CLASP, June 2015), https://www.clasp.org/sites/default/files/public/resources-and-publications/publication-1/CollegeReadinessPaperFINALJune.pdf
  • 11. 11 EDTRUST.ORG ABOUT THE EDUCATION TRUST The EducationTrust is a nonprofit organization that promotes closing opportunity gaps by expanding excellence and equity in education for students of color and those from low-income families from pre-kindergarten through college. Through research and advocacy, the organization builds and engages diverse communities that care about education equity, increases political and public will to act on equity issues, and increases college access and completion for historically underserved students. ACKNOWLEDGMENTS We are grateful to Lumina Foundation for providing support for this project.The views expressed in this publication are those of the authors and do not necessarily represent those of Lumina Foundation, its officers or employees. 1250 H STREET, NW, SUITE 700, WASHINGTON, D.C. 20005 P 202-293-1217 F 202-293-2605 WWW.EDTRUST.ORG Copyright © 2017 The Education Trust. All rights reserved.