Shibboleth statistics using Raptor
•
1 gefällt mir•863 views

The document discusses using the Raptor software suite to generate statistics from Shibboleth authentication data. Raptor allows generating graphs of authentication events over time grouped by different fields and exporting them as images, CSVs, or PDFs. It also explores pulling additional user data from LDAP directories and using Raptor's modular components like the MUA and PostgreSQL database with R and shell scripts to build a prototype for viewing service provider authentication statistics.

Empfohlen
Empfohlen
Weitere ähnliche Inhalte
Was ist angesagt?
Was ist angesagt? (18)
Andere mochten auch
Andere mochten auch (20)
Ähnlich wie Shibboleth statistics using Raptor
Ähnlich wie Shibboleth statistics using Raptor (20)
Mehr von EDINA, University of Edinburgh
Mehr von EDINA, University of Edinburgh (20)
Shibboleth statistics using Raptor
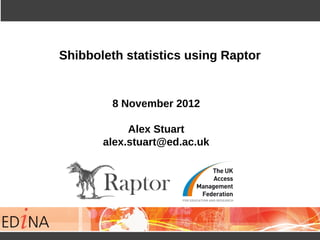
- 1. Shibboleth statistics using Raptor 8 November 2012 Alex Stuart alex.stuart@ed.ac.uk
- 2. Shibboleth statistics using Raptor What is Raptor? A software suite for accounting of authentication information Modular: ICA / MUA / WEB https://iam.cf.ac.uk/trac/RAPTOR What is Raptor mdzfbjn
- 3. Shibboleth statistics using Raptor IdP statistics (1/2) Graphs over a defined interval, grouped by a particular field, extensions to pull more information from institutional LDAP etc. PNG on screen Export as CSV Export as PDF (+ template)
- 4. Shibboleth statistics using Raptor IdP statistics (2/2) Intention to incorporate authentication events in EDINA dashboard but no dedicated software engineer time. So build a prototype & explore structure of Raptor database... Raptor MUA PostgreSQL R Shell scripts
- 5. Shibboleth statistics using Raptor SP statistics UK Federation test SP https://test.ukfederation.org.uk Testing Troubleshooting Automated access (no thanks!) Interfederation test applicationId not stored Web interface tuned for IdPs