
Empfohlen

Empfohlen
Weitere ähnliche Inhalte
Mehr von MODAS DIVERSAS DEL PERU - MODIPSA
Mehr von MODAS DIVERSAS DEL PERU - MODIPSA (7)
Happy planet 2012
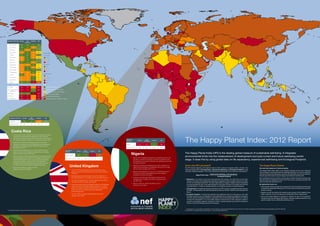
- 1. Countries in HPI rank Life Exp Exp Footprint HPI well-being 2050 target 87.0 8.0 1.7 89.0 1 Costa Rica 79.3 7.3 2.5 64.0 2 Vietnam 75.2 5.8 1.4 60.4 3 Colombia 73.7 6.4 1.8 59.8 Colour keys: 4 Belize 76.1 6.5 2.1 59.3 Life expectancy 5 El Salvador 72.2 6.7 2.0 58.9 > 75 years 6 Jamaica 73.1 6.2 1.7 58.5 60 – 75 years 7 Panama 76.1 7.3 3.0 57.8 < 60 years Exp well-being 8 Nicaragua 74.0 5.7 1.6 57.1 > 6.2 9 Venezuela 74.4 7.5 3.0 56.9 4.8 – 6.2 10 Guatemala 71.2 6.3 1.8 56.9 < 4.8 11 Bangladesh 68.9 5.0 0.7 56.3 Ecological Footprint 12 Cuba 79.1 5.4 1.9 56.2 < 1.78 13 Honduras 73.1 5.9 1.7 56.0 1.78 – 3.56 14 Indonesia 69.4 5.5 1.1 55.5 3.56 – 7.12 15 Israel 81.6 7.4 4.0 55.2 > 7.12 HPI 147 Mali 51.4 3.8 1.9 26.0 All three components good 148 Central African 48.4 3.6 1.4 25.3 Two components good, one middling Republic One component good, and two middling 149 Qatar 78.4 6.6 11.7 25.2 Three components middling 150 Chad 49.6 3.7 1.9 24.7 Any with one component poor 151 Botswana 53.2 3.6 2.8 22.6 Two components poor, or “deep red” footprint Exp Countries in HPI rank Life Exp Footprint HPI Well-being Costa Rica 79.3 7.3 2.5 64.0 Rank (out of 151) 28th 13th 77th* 1st Costa Rica • For the second time, Costa Rica tops the Happy Planet Index. The Happy Planet Index: 2012 Report It has the second highest life expectancy in the Americas, experienced well-being higher than many richer nations, and a per capita Ecological Footprint one third the size of the USA’s. Countries in Exp Life Exp Footprint HPI HPI rank Well-being • Costa Rica’s experienced well-being score is lower than Denmark’s, the country with the highest level of experienced Nigeria 51.9 4.8 1.4 33.6 well-being, but higher than that of the USA, which has an average score of 7.2. Rank (out of 151) 139th 98th 42nd* 125th • Costa Rica’s life expectancy is 4.1 years lower than that of Countries in Exp Life Exp Footprint HPI Japan, the country with highest life expectancy, but higher HPI rank Well-being than the USA’s, which is 78.5 years. United Kingdom 80.2 7.0 4.7 47.9 Nigeria The Happy Planet Index (HPI) is the leading global measure of sustainable well-being. It integrates • Costa Rica has embraced sustainability in its national policies: • Nigeria has the biggest population of sub-Saharan Africa, and environmental limits into the measurement of development and puts current and future well-being centre it produces 99% of its energy from renewable sources, has reversed deforestation in the country, and has committed Rank (out of 151) 20th 19th 121st* 41st like other countries in the region, its HPI score reflects a low stage. It does this by using global data on life expectancy, experienced well-being and Ecological Footprint. to becoming carbon neutral by 2021. But Costa Rica’s life expectancy, low levels of experienced well-being, and a low Ecological Footprint is still larger than it would need to be Ecological Footprint. for it to live within its fair share of planetary resources. • Costa Rica’s GDP per capita is $11,569, United Kingdom • Nigeria’s experienced well-being score is low. Although it is higher than the average in sub-Saharan Africa (4.3) it is lower How is the HPI calculated? The HPI blends subjective and objective data to build a picture of progress within a country. The The Happy Planet Charter We need new measures of human progress. around a quarter of the USA’s. than the world average, which is 5.3. Index uses global data on life expectancy, experienced well-being and Ecological Footprint to rank • The UK’s HPI score reflects a high life expectancy, high The Happy Planet Index offers us an excellent example of how such measures levels of experienced well-being, and a very high Ecological • Nigeria’s life expectancy is very low. It is considerably lower countries. It asks the question: “how much well-being is achieved per unit of resource consumption?” work in practice. It shows that while the challenges faced by rich resource-intensive Footprint. than both the world average (69.9 years) the average in Experienced well-being x Life expectancy nations and those with high levels of poverty and deprivation may be very different, sub-Saharan Africa (54.8 years). Happy Planet Index ≈ • Average experienced well-being in the UK is lower than in Ecological Footprint the end goal is the same: long and happy lives that don’t cost the earth. the United States (7.2), but higher than that of Germany (6.7). • If everyone had the same Ecological Footprint as the We must balance the prominence currently given to GDP with those measures that average citizen of Nigeria, the world’s Footprint would • Well-being. If you want to know how well someone’s life is going, your best bet is to ask them take seriously the challenges we face in the 21st century: creating economies that • The UK’s life expectancy is 1.7 years higher than the USA’s, be 50% lower. directly. In this year’s HPI, experienced well-being is assessed using a question called the ‘Ladder deliver sustainable well-being for all. but lower than that of Japan (83.4 years). • Nigeria’s GDP per capita is $2,399, around a of Life’ from the Gallup World Poll. This asks respondents to imagine a ladder, where 0 represents • If everyone had the same Ecological Footprint as the average the worst possible life and 10 the best possible life, and report the step of the ladder they feel they By signing this charter we: twentieth of the USA’s. citizen of the UK, the world’s Footprint would be 1.7 times currently stand on.1 Evidence indicates that this is an effective measure of overall well-being. • Call on governments to adopt new measures of human progress that put the goal larger. This means we would need to reduce our Footprints • Life expectancy. Alongside experienced well-being, the HPI includes a universally important measure of delivering sustainable well-being for all at the heart of societal and economic by a factor of 2.5 in order to stay within sustainable of health – life expectancy. We used life expectancy data from the 2011 UNDP Human Development decision-making environmental limits. Report. • Resolve to build the political will needed across society to fully establish these • The UK’s GDP per capita is $35,686, just over three • Ecological Footprint. A society that achieves high well-being now, but consumes so much that better measures of human progress by working with partner organisations quarters of the USA’s. the same resources are not available for future generations can hardly be considered successful. • Call on the United Nations to develop an indicator as part of the post-2015 The HPI uses the Ecological Footprint promoted by the environmental NGO WWF as a measure framework that, like the Happy Planet Index, measures progress towards the key of resource consumption.2 It is a per capita measure of the amount of land required to sustain a goal for a better future: sustainable well-being for all. country’s consumption patterns, measured in terms of global hectares (g ha) which represent a hectare of land with average productive biocapacity. 1 See Appendix 1 in our full report for explanation of why this measure of experienced well-being was used in this report. See http://www.gallup.com/poll/122453/understanding-gallup-uses-cantril-scale.aspx * For Ecological Footprint, being ranked top means having the smallest Footprint for information on how Gallup have used this indicator. 2 See www.footprintnetwork.org.