SlideShare ist ein Scribd-Unternehmen logo
1 von 30
Downloaden Sie, um offline zu lesen
Article
Composition and Variation of the Human Milk
Microbiota Are Influenced by Maternal and Early-Life
Factors
Graphical Abstract
Highlights
d Milk microbiota variability is affected by maternal factors and
other milk components
d Some factors have phylum-specific effects
d Some variations in milk microbiota are sex-specific
d Feeding method (at the breast versus pumped) was strongly
associated with milk microbiota
Authors
Shirin Moossavi, Shadi Sepehri,
Bianca Robertson, ...,
Malcolm R. Sears, Ehsan Khafipour,
Meghan B. Azad
Correspondence
meghan.azad@umanitoba.ca
In Brief
Moossavi et al. examine human milk
microbiota in the CHILD birth cohort and
use causal modeling to describe sex-
specific associations with maternal,
infant, and early-life factors. A strong
association with feeding method (i.e.,
pumped versus directly at the breast)
suggests some milk bacteria originate
from the infant oral cavity.
Moossavi et al., 2019, Cell Host & Microbe 25, 324–335
February 13, 2019 ª 2019 Elsevier Inc.
https://doi.org/10.1016/j.chom.2019.01.011
Cell Host & Microbe
Article
Composition and Variation of the Human
Milk Microbiota Are Influenced
by Maternal and Early-Life Factors
Shirin Moossavi,1,2,3,4 Shadi Sepehri,2 Bianca Robertson,5 Lars Bode,5,6 Sue Goruk,7 Catherine J. Field,7 Lisa M. Lix,8
Russell J. de Souza,9,10,11 Allan B. Becker,2,3 Piushkumar J. Mandhane,12 Stuart E. Turvey,13 Padmaja Subbarao,14,15
Theo J. Moraes,14 Diana L. Lefebvre,16 Malcolm R. Sears,16 Ehsan Khafipour,2,17 and Meghan B. Azad2,3,18,*
1Medical Microbiology and Infectious Diseases, University of Manitoba, Winnipeg, MB, Canada
2Children’s Hospital Research Institute of Manitoba, Pediatrics and Child Health, Winnipeg, MB, Canada
3Developmental Origins of Chronic Diseases in Children Network (DEVOTION), Winnipeg, MB, Canada
4Digestive Oncology Research Center, Digestive Disease Research Institute, Tehran University of Medical Sciences, Tehran, Iran
5Pediatrics, University of California, San Diego, La Jolla, CA, USA
6Larsson-Rosenquist Foundation Mother-Milk-Infant Center of Research Excellence, University of California, San Diego, La Jolla, CA, USA
7Agricultural Food, and Nutritional Science, University of Alberta, Edmonton, AB, Canada
8Community Health Sciences, University of Manitoba, Winnipeg, MB, Canada
9Clinical Epidemiology and Biostatistics, McMaster University, Hamilton, ON, Canada
10Nutritional Sciences, University of Toronto, Toronto, ON, Canada
11Li Ka Shing Knowledge Institute, St. Michael’s Hospital, Toronto, ON, Canada
12Pediatrics, University of Alberta, Edmonton, AB, Canada
13Pediatrics, University of British Columbia, Vancouver, BC, Canada
14Division of Respiratory Medicine, Pediatrics, Hospital for Sick Children, University of Toronto, Toronto, ON, Canada
15Physiology, University of Toronto, Toronto, ON, Canada
16Medicine, McMaster University, Hamilton, ON, Canada
17Animal Science, University of Manitoba, Winnipeg, MB, Canada
18Lead Contact
*Correspondence: meghan.azad@umanitoba.ca
https://doi.org/10.1016/j.chom.2019.01.011
SUMMARY
Breastmilk contains a complex community of bacte-
ria that may help seed the infant gut microbiota. The
composition and determinants of milk microbiota are
poorly understood. Among 393 mother-infant dyads
from the CHILD cohort, we found that milk micro-
biota at 3–4 months postpartum was dominated by
inversely correlated Proteobacteria and Firmicutes,
and exhibited discrete compositional patterns. Milk
microbiota composition and diversity were associ-
ated with maternal factors (BMI, parity, and mode
of delivery), breastfeeding practices, and other milk
components in a sex-specific manner. Causal
modeling identified mode of breastfeeding as a key
determinant of milk microbiota composition. Specif-
ically, providing pumped breastmilk was consistently
associated with multiple microbiota parameters
including enrichment of potential pathogens and
depletion of bifidobacteria. Further, these data sup-
port the retrograde inoculation hypothesis, whereby
the infant oral cavity impacts the milk microbiota.
Collectively, these results identify features and de-
terminants of human milk microbiota composition,
with potential implications for infant health and
development.
INTRODUCTION
Although previously considered sterile, breastmilk is now
known to contain a complex community of bacteria that helps
establish the infant gut microbiota (Parigi et al., 2015). If this
process is disrupted, the infant may develop a dysbiotic micro-
biota, causing predisposition to chronic diseases such as
allergy, asthma, and obesity (Gomez-Gallego et al., 2016).
Recent studies on human milk microbiota suggest that it might
be affected by local pathologies of the breast, mode of delivery,
antibiotics, maternal health, and gestational age (Bode et al.,
2014). However, these findings have not been reproduced in
large-scale studies, and the determinants of milk microbiota
are still mostly unknown.
Two main pathways have been proposed to explain the
origin of milk microbiota: entero-mammary translocation of the
maternal gut microbiota and retrograde inoculation by the in-
fant’s oral microbiota (McGuire and McGuire, 2017). The fact
that colostrum collected even before the first infant feeding
already contains a microbial community (Damaceno et al.,
2017) supports the entero-mammary pathway, while the similar-
ity of infant oral microbiota to breastmilk microbiota (Bisanz
et al., 2015) supports the retrograde pathway. It is plausible
that both pathways are contributing to the bacterial content of
human milk.
Depending on the source of bacteria, different factors could
contribute to shaping the milk microbiota. Factors influencing
the mother’s gut microbiota such as obesity (Collado et al.,
324 Cell Host & Microbe 25, 324–335, February 13, 2019 ª 2019 Elsevier Inc.
2008) or diet (Wu et al., 2011) could affect the bacteria originating
from the maternal gut, while factors influencing the infant’s mi-
crobiota (Laforest-Lapointe and Arrieta, 2017) such as mode of
delivery, older siblings, complementary feeding, and mode of
breastfeeding (directly at the breast versus pumped and bottled
breastmilk) could potentially alter the bacteria derived from the
infant’s oral cavity. Other milk components such as human
milk oligosaccharides (HMOs), milk fatty acids, hormones, im-
mune cells, and antibodies could also modulate the milk ‘‘micro-
environment’’ and create a niche constraint affecting composi-
tion of the microbial community. Additionally, factors that
could impact the overall milk composition such as circadian
rhythm (Nozad et al., 2012) and lactation stage could indirectly
affect the milk microbial community.
Studies addressing these potential determinants of milk mi-
crobiota have been limited by small sample size, low sequencing
depth, and lack of control for confounding factors. The objective
of this study was to profile the milk microbiota in a large sample
of healthy mother-infant dyads and examine the association of
maternal, infant, early-life, and milk factors with milk microbiota
composition.
RESULTS
We studied a representative subset of 393 breastfeeding dyads
from the CHILD birth cohort (Table S1). The majority were
Caucasian (74%), about half (54%) were primiparous, and a
quarter (24%) delivered by Cesarean section. The mean ± SD
duration of any breastfeeding was 13 ± 6 months and the
mean lactation stage at sample collection was 17 ± 5 weeks.
We obtained a mean of 47,710 ± 18,643 high-quality
sequencing reads per sample, compared with 46,770 ± 13,479
reads from the mock community and 627 ± 1,034 reads in
sequencing negative controls. Profiles were significantly
different by sample type, but not by sequencing runs or PCR re-
actions (Figure S1A). Sequencing contaminants (n = 173 from
9,884 total amplicon sequence variants [ASVs]) were identified
and removed using the decontam package (Davis et al., 2018);
this did not measurably affect sequencing depth (Figure S1B)
or microbiota structure (Figure S1C). We observed strong con-
sistency between the observed and expected composition of
the mock community (Figure S1D).
Milk Microbiota Is Dominated by Inversely Correlated
Proteobacteria and Firmicutes with High Inter-individual
Variability
Following removal of rare taxa with <20 reads in total (Fig-
ure S1E), 18 unique phyla comprising 1,972 ASVs were detected,
with the majority of taxa detected belonging to Proteobacteria
(mean ± SD relative abundance: 67% ± 24%, range 3%–99%),
Firmicutes (26% ± 22%, range 0.1%–91%), Actinobacteria
(4% ± 4%, range 0%–61%), and Bacteroidetes (1% ± 3%, range
0%–44%) (Figure 1A). Proteobacteria and Firmicutes relative
abundances were inversely correlated (Pearson r = À0.97, p <
0.001). At the genus level (Table S2), the most abundant taxa
were Streptococcus (16% ± 17%), Ralstonia (5% ± 3%), and
Staphylococcus (5% ± 11%). We defined core milk microbiota
as ASVs present in at least 95% of individuals with minimum
1% mean relative abundance (Astudillo-Garcı´a et al., 2017;
Shade and Handelsman, 2012). Overall, 12 core ASVs were
identified (Table S3); the five most abundant belonged
to unclassified Burkholderiales (6% ± 3%), Staphylococcus
(5% ± 12%), Ralstonia (5% ± 3%), unclassified Comamonada-
ceae (4% ± 3%), and Acidovorax (4% ± 2%). These and other
core ASVs were present in 100% of samples compared to
0%–20% of sequencing negative controls (Table S3).
Milk Microbiota Profiles Exhibit Discrete Compositional
Patterns
To identify potential inherent patterns in the milk microbiota,
hierarchical clustering was performed on the core microbiota
(Figure 1B). Four clusters (C1–C4) were identified (Tibshirani
et al., 2001) (Figure S2) and were predominantly separated
based on the relative abundances of Moraxellaceae, Enterobac-
teriaceae, and Pseudomonadaceae (enriched in C1, n = 42);
Streptococcaceae, Staphylococcaceae, and Oxalobacteraceae
(C2, n = 98); Oxalobacteriaceae and Comamonadaceae (C3,
n = 161); and Streptococcaceae and Comamonadaceae (C4,
n = 92) (Figure 1C; Table S4). C1 and C2 had the lowest a
diversity, while C3 was the most diverse (Figure 1D). Clusters
were well separated on PCoA plots of the core (Figure 1E) and
overall (>0.01% mean relative abundance; Figure S2C) milk mi-
crobiota. C1 and C2 had higher heterogeneity compared to C3
and C4 (Figure S2B), suggesting they may be more enriched
with exogenously derived bacteria from maternal skin or breast
pump microbiota. Indeed, the majority of mothers in C1 (86%)
fed their infants pumped milk (indirect breastfeeding), compared
to 66%, 53%, and 48% in C2, C3, and C4, respectively
(Table S5; Figure 1F). C1 also had the highest rate of pump
versus manual expression (94%, compared to 78%–83% in
the other clusters) (Table S5).
Milk Microbiota Diversity Is Associated with Mode
of Breastfeeding, Method of Milk Expression,
and Other Maternal Factors
Overall, milk samples had a mean ± SD richness (observed
ASVs) of 147 ± 44 and diversity (inverse Simpson index) of
15.8 ± 8.7. We explored the association of a diversity with
multiple maternal and infant factors (Tables 1 and S6). In multi-
variable linear regression adjusting for infant sex, mode of
feeding, mode of delivery, and parity (number of older sib-
lings), indirect breastfeeding was independently associated
with lower milk bacterial richness (adjusted bb–18.9, 95% CI,
À27.9, À9.9, p < 0.001) and diversity (adjusted bbÀ2.08, 95%
CI, À3.91, À0.25, p < 0.05; Table 1). In a subset with
data on milk expression method, pump versus manual expres-
sion was associated with significantly lower bacterial richness
(bb = À39.6, 95% CI, À60.5, À18.7, p < 0.001). Within the
range of lactation that we studied (17 ± 5 weeks), we did not
detect significant associations of lactation stage with a
diversity. In addition, we found no association between
overall a diversity and mode of delivery, maternal ethnicity,
history of atopy, smoking, BMI, secretor status, HMO diver-
sity, or total HMO concentration (Table S6). There were
some notable differences when examining within-phylum a di-
versity (Figure 2). For example, while maternal BMI was not
associated with overall a diversity, it was inversely associated
with Proteobacteria diversity and positively associated with
Cell Host & Microbe 25, 324–335, February 13, 2019 325
Firmicutes diversity. Maternal atopy and multiparity were
associated with higher Actinobacteria richness.
Milk Microbiota Composition Is Associated with
Breastfeeding Practices, Multiparity, and Other
Maternal Factors in a Sex-Specific Manner
To identify factors associated with milk microbiota composition,
we first examined the relative abundance of taxa at species
and genus levels. Among the many factors examined, only
mode of breastfeeding was associated with differential relative
abundance for a few individual taxa (Figure 5D). Gemellaceae,
Vogesella, and Nocardioides had higher relative abundances
with direct breastfeeding whereas Enterobacteriaceae and
Pseudomonas were relatively more abundant with indirect
breastfeeding. No associations were observed between individ-
ual taxa and other factors examined, including maternal secretor
status, ethnicity, atopy, parity, mode of delivery, or intrapartum
antibiotics (data not shown).
Next, we assessed associations with core milk microbiota
cluster membership (Figure 1F; Table S5). Clusters C3 and C4
had lower frequency of indirect breastfeeding compared to clus-
ters C1 and C2 while exclusive breastfeeding and primaparity
were more frequent in cluster C1 (Table S5). Maternal age, atopy,
infant birth weight, gestational age, and intrapartum antibiotics
were not associated with cluster membership (data not shown).
Next, we explored the association of each factor with the
entire microbiota composition using redundancy analysis
(RDA; Figure 3). Consistent with the cluster analyses, breast-
feeding mode (p = 0.001) was significantly associated with the
overall composition. Several additional factors including
B
EDC
A
F
Figure 1. Milk Microbiota Profiles Are Highly Variable between Women, and Exhibit Discrete Compositional Patterns
(A) Milk microbiota profile at phylum level across samples.
(B) Hierarchical clustering of the core milk ASVs defined as present in at least 95% of samples with minimum 1% mean relative abundance; see also Figure S2.
(C) Relative abundance of dominant bacterial families in different clusters; see also Table S5.
(D) Comparison of a diversity between clusters *p < 0.05, **p < 0.001; NS, not significant.
(E) Comparison of b diversity between clusters using PERMANOVA.
(F) Prevalence of mode of breastfeeding, infant sex, mode of delivery (C/S, cesarean section; NVD, normal vaginal delivery), and parity in different clusters.
326 Cell Host & Microbe 25, 324–335, February 13, 2019
exclusive breastfeeding, lactation stage, parity, maternal BMI,
ethnicity, and infant sex were significantly associated with the
milk microbiota composition, albeit with very low redundancy
values (each accounting for <1% of the variation in the milk
microbiota). The fact that these factors were associated with
overall microbiota composition, but not with cluster member-
ship, suggests their influence on the non-core (inter-individual
variable) component of the milk microbiota. There was a trend
toward association of HMO composition with milk microbiota
(R2
= 0.055, p = 0.074) (Figure 3).
A multivariable RDA including mode of breastfeeding and
lactation stage accounted for 2.2% of variation in the milk
microbiota (p = 0.001) while additional inclusion of HMO
composition increased the total variation explained to 7.3%
(p = 0.001). Interestingly, the amount of variation explained
was considerably higher when RDA models were stratified by
infant sex (male, 13.3%, p = 0.005; female, 11.6%, p = 0.17).
Sex specificity was also observed for univariate RDA associa-
tions for mode of breastfeeding and lactation stage (higher R2
in males), as well as parity, mode of delivery, and maternal
BMI (significant in females only) in stratified analyses. The com-
bined contribution of all the factors accounted for 35.5% of vari-
ation in males (p = 0.001) and 34.1% in female infants (p = 0.079)
(Figure 3).
Table 1. Factors Associated with Milk Microbiota a Diversity
Factor n (%)
Richness: Observed OTUs Diversity: Inverse Simpson
Univariatea
Model 1b
Univariatea
Model 1b
Model 2c
Richness
(Mean ± SD)
Crude
b (95% CI)
Adjusted
b (95% CI)
Diversity
(Mean ± SD)
Crude
b (95% CI)
Adjusted
b (95% CI)
Adjusted
b (95% CI)
Breastfeeding Mode
All direct 162
(41.9)
157.8 ± 37.0 Ref. Ref. 17.1 ± 8.2 Ref. Ref. Ref.
Some indirect 225
(58.1)
138.7 ± 46.9 À19.1
(À27.8, À10.4)f
À18.7
(À27.7, À9.64)f
14.9 ± 9.2 - 2.2
(À3.9, À0.36)e
À2.04
(À3.88, À0.20)e
À2.20
(À4.01, À0.40)e
Milk Expressiond
Manual 20
(18.8)
170.1 ± 40.0 Ref. – 15.8 ± 7.9 Ref. – –
Pump 91
(81.2)
130.5 ± 43.2 À39.6
(À60.5, À18.7)f
13.8 ± 9.0 À2.08
(À6.40, 2.25)
Mode of Delivery
Vaginal 294
(76.0)
148.5 ± 43.9 Ref. Ref. 16.3 ± 8.8 Ref. Ref. Ref.
C/S emergency 47
(12.1)
133.5 ± 47.3 À14.9
(À28.5, À1.5)e
À11.3
(À25.0, 2.5)
14.5 ± 9.2 À1.74
(À4.46, 0.99)
À1.02
(À3.81, 1.78)
À1.29
(À4.01, 1.44)
C/S elective 46
(11.9)
151.1 ± 39.0 2.6
(À11.0, 16.3)
2.5
(À11.2, 16.1)
14.2 ± 8.6 À2.09
(À4.84, 0.67)
À2.03
(À4.81, 0.76)
À1.89
(À4.65, 0.88)
Infant Sex
Female 192
(48.9)
151.0 ± 43.3 Ref. Ref. 16.7 ± 8.8 Ref. Ref. Ref.
Male 201
(51.1)
142.8 ± 43.9 À8.2
(À16.9, 0.4)
À7.3
(À16.0, 1.4)
14.9 ± 8.9 À1.81
(À3.56, À0.06)e
À1.65
(À3.43, 0.12)
À1.62
(À3.39, 0.15)
Older Siblings
No 211
(53.7)
143.7 ± 47.5 Ref. Ref. 15.2 ± 9.1 Ref. Ref. –
One 126
(32.1)
147.1 ± 39.7 3.4
(À6.3, 13.0)
À2.2
(À12.3, 7.8)
16.4 ± 8.6 1.22
(À0.74, 3.18)
0.68
(À1.37, 2.73)
Two or more 56 (14.2) 157.7 ± 35.8 13.9
(1.1, 26.8)e
7.5
(À6.0, 20.9)
16.7 ± 8.5 1.47
(À1.15, 4.08)
1.11
(À1.64, 3.85)
N = 393 dyads from the CHILD cohort. Data are presented as mean ± SD. BMI, body mass index; C/S, Caesarean section.
a
All factors showing an association (p < 0.05) on univariate analysis are shown. For other factors examined without significant associations, see Table
S6: maternal BMI, lactation stage (interquartile range 14–19 weeks), maternal age, maternal atopy, maternal secretor status (defined based on the
presence or absence of 20
-FL or LNFP HMOs), maternal prenatal smoking, maternal ethnicity, milk fatty acids PC1, HMO diversity, and total HMO
concentration.
b
Linear regression adjusted for breastfeeding mode, infant sex, mode of delivery, older siblings, and sample processing time; N = 381.
c
Linear regression adjusted for breastfeeding mode, infant sex, mode of delivery, and sample processing time; N = 381.
d
n = 111. Method of milk expression was not systematically captured but was analyzed for samples where it was noted.
e
p < 0.05.
f
p < 0.001.
Cell Host & Microbe 25, 324–335, February 13, 2019 327
Structural Equation Modeling Identifies Mode of
Breastfeeding as a Key Determinant of Milk Microbiota,
and Defines Other Causal Pathways Influencing Milk
Composition
None of the results above account for the theoretical framework
of causal pathways by which different factors could affect milk mi-
crobiota (Figure 4A) We performed confirmatory factor analysis
(CFA) (Kline, 2016), a variant of structural equation modeling
(SEM), to evaluate and compare different plausible frameworks
(Figures 4B and S3). We modeled the milk environment as a latent
(unobserved) construct with HMOs, fatty acids, insulin, and leptin
as indicators. Our variable selection in the CFA was guided by the
current literature on proposed mechanisms of mammary gland
colonization. Variables potentially important for the retrograde
pathway are mode of delivery, infant sex, and older siblings
(factors shaping the infant microbiota), as well as mode of breast-
feeding (because indirect feeding eliminates contact with the in-
fant oral cavity). Variables potentially important for the entero-
mammary route include maternal BMI and dietary pattern, which
could be correlated with the maternal gut microbiota.
In our final model, breastfeeding mode was directly associated
with milk microbiota with b coefficient of 0.19 (p < 0.001) (Figure 4).
There was a trend in the direct association of infant sex with
milk microbiota (b = 0.09, p = 0.072), whereas no association
Inverse Simpson
Index
coefficient
**
* Observed ASVs
*
**
*
*
*
*
**
*
*
*
*
*
*
**
Infant Sex (Male vs. Female)
Fatty Acids (%) PC1
Some Indirect Breastfeeding
Lactation Stage (per week)
Two Older Siblings (vs. none)
One Older Sibling (vs. none)
Elective C/S (vs. Vaginal)
Emergency C/S (vs. Vaginal)
Prenatal Smoking
Maternal Atopy
Other (vs. Caucasian)
First Nations (vs. Caucasian)
Asian (vs. Caucasian)
Maternall Overweight/Obesity
Maternal Age (per year)
Observed
ASVs
Inverse Simpson
Index
**
*
Proteobacteria
Proteobacteria
Firmicutes
Actinobacteria
Firmicutes
Actinobacteria
Figure 2. Factors Associated with Milk Mi-
crobiota Within-Phylum a Diversity
b coefficients of univariate associations with linear
regression are visualized for observed ASVs and
inverse Simpson index for major milk microbiota
phyla. *p < 0.05, **p < 0.001.C/S, Ceasarean
section.
was detected for birth mode or maternal
BMI (b < 0.10, p > 0.05). Maternal diet
influenced maternal BMI, and BMI was
significantly associated with the milk envi-
ronment latent construct. Overall, we did
not detect a significant association be-
tween the milk environment and the milk
microbiota (b = À0.049, p = 0.45) (Figures
4, S3A, and S3B).
We assessed other plausible causal
pathways in equivalent models (Figure S3;
Table S7). For example, we removed the
indirect effect of BMI on milk microbiota
mediated by the milk environment (Fig-
ure S3C); however, the model was not a
good fit, suggesting that BMI both directly
and indirectly affects the milk microbiota.
Furthermore, we observed that the
effect of mode of breastfeeding on the
milk microbiota was not mediated via
the milk environment (Figure S3D). We
also incorporated some known associa-
tions such as the direct effect of diet on
milk fatty acids (Figure S3E) and potential
direct effect of HMOs on milk microbiota
(Figure S3F). Controlling for these addi-
tional associations, mode of breastfeed-
ing was the only consistent factor directly associated with the
milk microbiota composition. Overall, the CFA suggests that (1)
mode of breastfeeding directly influences the milk microbiota,
and (2) maternal diet influences BMI, which affects non-bacterial
milk components that do not directly influence milk microbiota.
Indirect Breastfeeding Is Associated with Enrichment of
Potential Pathogens and Depletion of Bifidobacteria in
Milk Microbiota
Given the consistent association of breastfeeding mode with
different milk microbiota measures using different analytical ap-
proaches (above), we conducted further analyses to explore
this relationship (Figure 5). Indirect breastfeeding was associated
with lower a (within sample) diversity and higher b (between sam-
ple) diversity (Figures 5A–5C). Using a standard ANOVA test,
several taxa were differentially abundant based on mode of
breastfeeding. Enterobacteriaceae and Enterococcaceae were
more abundant with indirect breastfeeding while Gemellaceae
and Vogesella were enriched with direct breastfeeding (FDR p <
0.05). Notably, although Enterobacteriaceae was present in
70% of samples regardless of the mode of breastfeeding, it had
a 5-fold lower mean relative abundance in direct versus indirect
breastfeeding (1.1% ± 3.5% versus 5.0% ± 13.5%, p = 0.002).
Linear discriminant analysis (Segata et al., 2011) (Figure 5D)
328 Cell Host & Microbe 25, 324–335, February 13, 2019
identified several discriminant taxa that were not differentially
abundant in conventional analysis. For example, members of
the Actinobacteria phylum and Veillonellaceae (a member of
oral microbiota) were enriched with direct breastfeeding while
Stenotrophomonas and Pseudomonadaceae (potential opportu-
nistic pathogens) were enriched with indirect breastfeeding (Fig-
ure 5D), further suggesting that direct breastfeeding facilitates
acquisition of oral microbiota while indirect breastfeeding leads
to enrichment by environmental (pump-associated) bacteria.
We next examined association of mode of breastfeeding with
Bifidobacterium spp. as they constitute the majority of shared
taxa between mother’s milk and infant stool (Biagi et al., 2017).
We identified Bifidobacterium bifidum and B. animalis, as well
as two unclassified Bifidobacterium spp., in the milk microbiota
Figure 5. The most prevalent Bifidobacterium spp. in breastmilk
was present in 48% of direct versus 30% of indirect breastfeed-
ing (p < 0.001) (Figure 5E).
To assess whether associations with breastfeeding mode
were related to the method of milk sample collection, we per-
formed a sensitivity analysis among samples with available infor-
mation on method of milk collection (n = 111; Figure S4). Overall,
pumping versus manual expression was associated with lower
milk microbiota richness (Table 1). Stratified analyses showed
that richness was significantly lower with indirect breastfeeding
regardless of the method of sample collection (Figure S4A), sug-
gesting that feeding mode and collection mode independently
influence milk microbiota composition.
DISCUSSION
Using multiple analytic approaches to study the human milk mi-
crobiota in a general population cohort, we provide evidence
Analysis
All Dyads
(n=393)
Male
(n=201)
Female
(n=192)
Variables R2 p R2 p R2 p
Univariable
Maternal BMI 0.43 * 0.54 1.02 *
Maternal secretor status 0.38 ~ 0.62 0.61
Mode of delivery 0.62 0.73 1.71 *
Number of older siblings 0.84 * 1.08 1.53 *
Child antibiotics at sample collection 0.25 0.80 ~ 0.67
Mother antibiotics at sample collection 0.21 0.70 0.51
Lactation stage 0.59 ** 0.84 ~ 0.60
Mode of breastfeeding (BF) 1.34 *** 2.17 *** 0.97 *
Exclusive breastfeeding 0.93 *** 1.38 ** 0.87 *
Total HMO concentration 0.31 0.50 0.60
HMO compositional profile 5.50 ~ 10.40 10.50
Milk insulin 0.32 0.69 0.50
Milk leptin 0.28 0.42 0.63
Milk fatty acid profile 7.80 15.50 15.50
Multivariable
Model 1
Mode of BF, older siblings, total HMO
2.27 *** 3.63 *** 2.89 *
Model 2
Mode of BF, lactation stage
2.15 *** 3.58 *** 1.55 *
Model 3
Mode of BF, lactation stage, HMO profile
7.29 *** 13.25 ** 11.57
Model 4
All factors in table
18.19 ** 35.47 *** 34.11 ~
Figure 3. Redundancy Analysis of Associa-
tions of Maternal and Infant Factors with
Overall Milk Microbiota Composition among
393 Dyads in the CHILD Cohort
Redundancy values (R2
) indicate the percent (%)
variation explained by each individual factor (in
univariate analyses) or each multivariable model.
Shading reflects magnitude of R2
. Maternal age,
history of atopy, infant birth weight, gestational
age, and intrapartum antibiotics were not signifi-
cantly associated with milk microbiota composi-
tion in RDA and are not shown. BMI, body mass
index; HMO, human milk oligosaccharide. $p <
0.10, *p < 0.05, **p < 0.01, ***p < 0.001.
that its composition and diversity are
influenced by maternal factors, early life
events, breastfeeding practices, and
other milk components. To our knowl-
edge, this is among the largest studies
of human milk microbiota performed to
date, and it is the only study to apply a
multivariable causal modeling approach.
We identified four main clusters within
the milk microbiota and found that
mode of breastfeeding was significantly
associated with milk microbiota compo-
sition. Some additional factors (e.g., maternal BMI and parity)
were associated with microbiota composition in a sex-specific
manner, while others (e.g., maternal atopy and smoking) were
associated with microbiota diversity in a phylum-specific
manner. We also uniquely integrated other milk components
(e.g., HMOs and fatty acids) in our analyses. Together, these
results considerably expand upon existing knowledge about
milk microbiota, providing evidence for the importance of
breastfeeding practices, maternal factors, and potential sex
differences in the pathways determining milk microbiota
composition.
Milk Microbiota Clusters Reflect Different Sources of
Exogenous Milk Bacteria
Dominant milk bacteria in our cohort were in accordance with
previously published results (McGuire and McGuire, 2017).
Also in agreement with previous reports (Bode et al., 2014),
milk microbiota demonstrated a high degree of inter-individual
variability with only a minority of taxa shared across the study
population. Though we acknowledge that discrete clusters
might not exist within the milk microbiota (Knights et al., 2014),
we used hierarchical clustering to identify inherent patterns in
the milk microbial community, finding four main clusters. While
C1 was dominated by Enterobacteriaceae, Moraxellaceae, and
Pseudomonadaceae, C2 had the highest relative abundances
of Streptococcaceae and Staphylococcaceae as well as low
abundance of potential reagent contaminants. Given the
decreasing proportions of indirect breastfeeding as well as
pump-expressed milk from C1 to C2, it is plausible that the
clusters, at least partially, reflect a gradient of infant oral versus
environmental (e.g., breast pump apparatus biofilm) sources of
exogenous milk bacteria (Jime´ nez et al., 2017). In a previous
Cell Host & Microbe 25, 324–335, February 13, 2019 329
report, three clusters were identified in the milk microbiota of
Chinese women with dominance of Streptococcaceae, Staphy-
lococcaceae, and Pseudomonadaceae defining the three clus-
ters (Li et al., 2017). Differences in the cluster-dominating spe-
cies compared to our study could be the consequence of
different clustering methods, inclusion criteria (e.g., restriction
to ‘‘core’’ taxa in our study), prevalence of key exposure vari-
ables (e.g., indirect breastfeeding), milk collection methods
(e.g., aseptic protocol with electric pump in the Chinese study),
or geographic variations in the milk microbiota. Further research
is warranted to explore the existence and biological relevance of
compositional patterns in milk microbiota.
Support for the Exogenous Sources of Milk Colonization
Our study contributes evidence to the ongoing debate
regarding the origins of milk microbiota. Two main pathways
have been proposed to explain the origin of milk microbiota: en-
tero-mammary translocation of the maternal gut microbiota and
retrograde inoculation by the infant’s oral microbiota. While it
has been hypothesized that the mammary gland may be
colonized by a complex microbial community, it has also been
suggested that milk microbiota is merely the result of contami-
nation at multiple steps of collection, processing, and storage
(Rainard, 2017). Identification of microbial communities within
BMIMicro-
biota
Milk
Envir.
Fatty
Acids Leptin HMOInsulin
BF
Mode
Infant
Sex
Birth
Mode
Diet
PC1
Diet
PC2
** ****** ** **
**
Milk environment
HMOs
Lipids
Cytokines
etc.
Milk
microbiota
Maternal factors
BMI
Age
Ethnicity
Diet
Breastfeeding factors
Mode
Exclusivity
Time to the last feed
Maternal
Gut microbiota
Early life factors
Mode of delivery
Antibiotics
Older siblings
Infant factors
Sex
Birth weight
A
B
Figure 4. Theoretical Framework and
Causal Modeling of Maternal and Infant
Factors Influencing the Milk Microbiota
(A) Theoretical framework of how different factors
are associated with milk microbiota composition.
Maternal factors are more likely to indirectly in-
fluence the milk microbiota via modulating other
milk components or the maternal gut microbiota,
while early-life and infant factors could more
directly shape the milk microbiota by influencing
the infant oral microbiota.
(B) Mode of breastfeeding is significantly associ-
ated with the milk microbiota in structural equation
modeling. Standardized b coefficients are re-
ported. BMI, maternal body mass index; CFI,
comparative fix index; CI, confidence interval;
RSMEA, root-mean-square error of approxima-
tion; SRMR, standardized root-mean residuals;
*p < 0.05, **p < 0.01. Green, positive; red, nega-
tive.
See also Figure S3 and Table S7.
the breast tissue of non-lactating women
suggests that the mammary gland is
indeed colonized (Urbaniak et al.,
2014), and recent data confirm that bac-
teria are present in human milk collected
under aseptic conditions (Sakwinska
et al., 2016). However, the same study
found a higher abundance and different
composition of microbiota in milk
collected using a non-aseptic protocol,
indicating a substantial contribution
from skin microbiota or other externally
acquired bacteria. The ‘‘retrograde inoc-
ulation’’ hypothesis is also supported by
the observation that bacterial load gradually decreases over the
course of each feed (West et al., 1979).
Our study provides intriguing evidence to further support the
retrograde hypothesis, showing that indirect breastfeeding
(defined as at least one serving of pumped milk in the preced-
ing 2 weeks) was significantly associated with milk microbiota
diversity and composition. This striking association was
consistently replicated using different analytical methods
(multivariable regression, redundancy analysis, discriminant
analysis, and structural equation modeling), providing confi-
dence that these observed associations could be causal.
Our results suggest that both the act of pumping and the
lack of contact with the infant oral cavity may independently
influence the milk microbiota, although we cannot definitively
distinguish between these related factors, nor identify the
sources of the exogenously derived bacteria in the expressed
breast milk. Nevertheless, based on lower richness associated
with indirect versus direct breastfeeding in both manually ex-
pressed and pumped milk samples, we speculate that expo-
sure to the infant oral cavity has a persistent impact on
shaping the milk microbiota community. Further research is
needed to characterize this ‘‘retrograde inoculation’’ process,
and to explore the possible impact of pumping on the micro-
biota of expressed milk.
330 Cell Host & Microbe 25, 324–335, February 13, 2019
Mechanistic Explanation for a Clinical Observation
Our current findings on indirect breastfeeding also suggest a
possible explanation for our recent observation that infants fed
pumped milk are at increased risk for pediatric asthma compared
to those fed exclusively at the breast (Klopp et al., 2017). In the
current study of milk microbiota, we found that one Bifidobacte-
rium spp. existed in milk at relatively high prevalence and was
significantly depleted with indirect breastfeeding. This could
have important implications for infant immune development and
asthma risk because Bifidobacterium spp. constitute the majority
of shared taxa between mother’s milk and infant stool (Biagi et al.,
2017), which is typically dominated by Bifidobacterium spp.
(Asnicar et al., 2017; Biagi et al., 2017). Gut microbiota is crucial
in the development and education of the infant immune system
(Li et al., 2014), and disruption of gut microbiota in the first few
months of life is associated with atopy and asthma later in child-
hood (Azad et al., 2015; Bridgman et al., 2016). We acknowledge
that bifidobacteria may be underrepresented in our study due to
known biases against detecting this species using 16S rRNA
gene sequencing (Walker et al., 2015); however, the lower preva-
lence of Bifidobacterium spp. associated with indirect breast-
feeding among the uniformly processed samples in our study
suggests that modifiable factors could indeed impact the propor-
tions of this bacterium in milk. We also found that Enterobacteri-
aceae and potential pathogens were enriched with indirect
breastfeeding, consistent with culture-dependent studies where
pump expression increased the abundance of Enterobacteri-
aceae and other gram-negative bacteria in milk (Jime´ nez et al.,
2017). Increased exposure to potential pathogens in breastmilk
could pose a risk of respiratory infection in the infant, representing
Figure 5. Milk Microbiota Is Associated with Mode of Breastfeeding
(A) a diversity.
(B) Homogeneity of dispersion.
(C) b diversity.
(D) Discriminant analysis of taxa enrichment.
(E) Prevalence of Bifidobacterium species.
See also Figure S4.
Cell Host & Microbe 25, 324–335, February 13, 2019 331
another possible mechanism for increasing asthma risk (Beigel-
man and Bacharier, 2016). Further research is warranted to
explore the impact of pump expression and indirect breastfeed-
ing on milk microbiota and its subsequent effect on infant gut mi-
crobiota, immune development, and related health outcomes.
Sex-Specific Variations in Milk Microbiota
We observed intriguing differences in milk microbiota a diversity
and overall community structure according to infant sex. There
was a trend in direct association of infant sex with milk microbiota
in our SEM analysis, and we also found sex-dependent associa-
tions of breastfeeding mode, exclusivity, and lactation stage
(higher R2
in males), as well as parity, mode of delivery, and
maternal BMI (significant in females only) with milk microbiota in
RDA. Lack of sex-stratified analysis could potentially explain
why previous studies have reported inconclusive results on the
association of the above-mentioned factors with milk microbiota.
The mechanism for the observed sex differences in milk micro-
biota remains to be determined. Sex differences in gut microbiota
have been reported, and are usually attributed to hormonal differ-
ences between male and female hosts (Markle et al., 2013). While
the host is always female in the case of milk microbiota, it is sus-
pected (as described above) that milk microbiota is partially
derived from the infant oral cavity, which may differ in male versus
female infants (Takeshita et al., 2016). The sex differences we
have observed in milk microbiota could therefore be interpreted
as additional evidence supporting the retrograde inoculation hy-
pothesis. Other mechanisms for these sex differences are also
possible, as sex-dependent variations have been observed in
other milk components including calcium, cortisol, and fat (Fujita
et al., 2012; Hinde, 2007; Hinde et al., 2013; Sullivan et al., 2011).
Milk Microbiota and Other Milk Components
Our study uniquely investigated the relationship of milk micro-
biota and other milk components such as fatty acids, maternal
hormones, and HMOs, which may shape the overall milk envi-
ronment and create the niche for the milk microbiota (Williams
et al., 2017). Using RDA, we observed a trend in the association
of milk fatty acid and HMO profiles with milk microbiota compo-
sition. However, using SEM we did not detect a directional or
correlational association of the overall milk environment with
the milk microbiota composition, perhaps because our study
lacked information on other key components of the milk environ-
ment (e.g., immune cells, cytokines, and micro- and macro-nutri-
ents). Further research is warranted to explore the interaction be-
tween milk microbiota and other milk components, and to study
their combined impact on infant development.
Modifiable Maternal Factors and Milk Microbiota
There is great interest in identifying modifiable factors influencing
the milk microbiota, with studies to date reporting inconsistent as-
sociations for mode of delivery, maternal diet, and maternal BMI
(Cabrera-Rubio et al., 2012; Li et al., 2017; McGuire and McGuire,
2017; Sakwinska et al., 2016; Urbaniak et al., 2016). Maternal diet
and BMI are interrelated, and both can modify gut microbiota
composition (Collado et al., 2008; Wu et al., 2011) as well as the
macro- and micro-nutrient profile of human milk (Mazurier et al.,
2017; McGuire et al., 2017), altering the niche for milk microbiota.
Maternal BMI is also positively associated with Caesarean section
delivery (Pettersen-Dahl et al., 2018). In our SEM analysis,
maternal diet, maternal BMI, and delivery mode did not directly
affect milk microbiota. However, controlling for the maternal die-
tary pattern as a factor either affecting the maternal BMI or directly
modulating milk fatty acid composition, we observed that BMI
could indirectly (via the effect on the overall milk environment)
influence the milk microbiota. Using RDA, we found that mode
ofdelivery and maternal BMI were associated withmilk microbiota
in female infants only, although the effect sizes were small (<2% of
variation explained). We also observed a trend toward lower bac-
terial richness following emergency Caesarean section after con-
trolling for relevant confounding factors. Overall, these associa-
tions were relatively subtle and sex-specific, which may explain
why previous smaller studies have not found a consistent overall
effect of delivery mode on milk microbiota composition.
Strengths and Limitations
The main strength of this study is our unique multi-variable and
multi-methodapproachtoassessingtheeffectofdiversematernal,
infant, early-life, and milk factors on the milk microbiota, using the
rich data and large sample size afforded by the CHILD cohort.
Notably, however, the many factors we evaluated collectively ex-
plained less than a third of the total variation observed in milk mi-
crobiota composition, indicating that other unmeasured factors
are contributing to the large inter-individual variation in milk micro-
biota profiles. The main limitation of our study is that milk samples
were pooled from multiple feeds and were not collected asepti-
cally. While this collection protocol precludes analysis of potential
diurnal variations and limits our ability to strictly study the milk mi-
crobiota (without skin or other ‘‘contaminants’’), it provides an ac-
curate representation of the microbiota that infants ingest, which is
arguably more biologically relevant to infant health outcomes.
Although refrigeration could potentially impact the microbial profile
of the milk samples (Sosa and Barness 1987), we did not find any
association between sample processing time and milk microbiota
composition. We collected a single sample from each mother, so
we could not examine longitudinal changes in milk microbiota
composition over time. Although we identified potential reagent
contaminants at the sequencing step, sequencing results were
not available for DNA extraction negative controls, and thus we
were not able to identify and remove potential contaminants that
might have been introduced during the extraction. Finally, as with
all culture-independent microbiota studies, we could not quantify
bacterial load or confirm the viability of bacteria identified in our
samples (McGuire and McGuire, 2015). As 16S rRNA gene
sequencing has limited capacity to resolve the taxa to species
and strain levels, further metagenomic and/or culturomic studies
are required to confirm and validate the results of this study.
Future Directions
Our results indicate that fixed and modifiable factors can influ-
ence the milk microbiota in a sex-specific manner. Whether
milk provides bacteria to colonize the infant gut or merely pro-
vides selective nutrients to foster a permissive environment is
still an open question. Further investigation is needed to deter-
mine if milk effectively transfers maternal microbiota or simply
enriches and protects the infant oral microbiota for a safe pas-
sage to the infant’s distal gut. Studies are also needed to identify
sources of exogenously derived bacteria; characterize other
332 Cell Host & Microbe 25, 324–335, February 13, 2019
elements of the milk microbiota, including fungi and viruses; and
determine the impact of pumping on the microbiota of expressed
milk. Finally, the impact of milk microbiota on infant gut micro-
biota development and health remains to be explored and could
have important implications for microbiota-based strategies for
early-life prevention of chronic conditions.
Conclusions
In this large and comprehensive study, we have used multivari-
able approaches to explore many features and potential deter-
minants of human milk microbiota composition. Our results sug-
gest that multiple maternal, infant, and environmental factors
interactively influence milk microbiota composition. Most strik-
ingly, indirect breastfeeding and pump expression were consis-
tently associated with milk microbiota composition, highlighting
the importance of breastfeeding practices. Interesting sex differ-
ences were also identified, as well as potential associations be-
tween microbiota and other milk components. Further research
is warranted to replicate these findings in other populations
and explore their implications for infant health and development.
STAR+METHODS
Detailed methods are provided in the online version of this paper
and include the following:
d KEY RESOURCES TABLE
d CONTACT FOR REAGENT AND RESOURCE SHARING
d EXPERIMENTAL MODEL AND SUBJECT DETAILS
B Inclusion and Exclusion of Study Participants
B Maternal, Infant and Early-Life Factors
d METHOD DETAILS
B Sample Collection and Processing
B Milk Microbiota Analysis
B Analysis of Other Milk Components
d QUANTIFICATION AND STATISTICAL ANALYSIS
B Microbial Data Pre-processing and Reagent Contami-
nant Removal
B Handling Missing Data
B Exclusion of Data
B Linear Association of a Diversity with Maternal, Infant,
and Milk Factors
B Linear Relationships between Taxa Abundance and
Maternal, Infant, and Milk Factors
B Redundancy Analysis
B Hierarchical Clustering of the Core Microbiota
B Structural Equation Modeling
B Linear Discriminant Analysis
B Presence/Absence Analysis by Mode of Breastfeeding
d DATA AND SOFTWARE AVAILABILITY
SUPPLEMENTAL INFORMATION
Supplemental Information includes four figures and seven tables and can be
found with this article online at https://doi.org/10.1016/j.chom.2019.01.011.
ACKNOWLEDGMENTS
We are grateful to all the families who took part in this study, and the whole
CHILD team, which includes interviewers, nurses, computer and laboratory
technicians, clerical workers, research scientists, volunteers, managers, and
receptionists. The full list of CHILD study investigators is listed separately.
We thank Leah Stiemsma for creating the antibiotic variables, Lorena Vehling
for creating the breastfeeding variables, and Sonia S Anand for creating the
maternal dietary pattern variables. We also thank Hooman Derakhshani for
constructive discussion during the revision. The Canadian Institutes of Health
Research (CIHR) and the Allergy, Genes and Environment Network of Centres
of Excellence (AllerGen NCE) provided core support for the CHILD Study. This
research was specifically funded by the Heart and Stroke Foundation and Ca-
nadian Lung Association, in partnership with the Canadian Respiratory
Research Network and AllerGen NCE. Additional support was provided by
the Natural Science and Engineering Research Council of Canada (NSERC)
Discovery Program and internal grants from the University of Manitoba. Infra-
structure at the Gut Microbiome Laboratory was supported by grants from the
Canadian Foundation for Innovation. This research was supported, in part, by
the Canada Research Chairs program. S.M. holds a Research Manitoba
Doctoral Studentship. These entities had no role in the design and conduct
of the study; collection, management, analysis, and interpretation of the
data; and preparation, review, or approval of the manuscript. CHILD investiga-
tors include P.S. (Director), The Hospital for Sick Children and University of
Toronto; S.E.T. (co-Director), University of British Columbia; M.R.S. (Founding
Director), McMaster University; S.S. Anand, McMaster University; M.B.A., Uni-
versity of Manitoba; A.B.B., University of Manitoba; A.D. Befus, University of
Alberta; M. Brauer, University of British Columbia; J.R. Brook, University of
Toronto; E. Chen, Northwestern University, Chicago; M.M. Cyr, McMaster Uni-
versity; D. Daley, University of British Columbia; S.D. Dell, The Hospital for Sick
Children and University of Toronto; J.A. Denburg, McMaster University; Q.L.
Duan, Queen’s University; T. Eiwegger, The Hospital for Sick Children and Uni-
versity of Toronto; H. Grasemann, The Hospital for Sick Children and Univer-
sity of Toronto; K. HayGlass, University of Manitoba; R.G. Hegele, The Hospital
for Sick Children and University of Toronto; D.L. Holness, University of Tor-
onto; P. Hystad, Oregon State University; M. Kobor, University of British
Columbia; T.R. Kollmann, University of British Columbia; A.L. Kozyrskyj, Uni-
versity of Alberta; C. Laprise, Universite´ du Que´ bec a` Chicoutimi; W.Y.W.
Lou, University of Toronto; J. Macri, McMaster University; P.J.M., University
of Alberta; G. Miller, Northwestern University, Chicago; T.J.M., The Hospital
for Sick Children and University of Toronto; P. Pare´ , University of British
Columbia; C. Ramsey, University of Manitoba; F. Ratjen, The Hospital for
Sick Children and University of Toronto; A. Sandford, University of British
Columbia; J.A. Scott, University of Toronto; J. Scott, University of Toronto;
F. Silverman, University of Toronto; E. Simons, University of Manitoba; T. Ta-
karo, Simon Fraser University; S.J. Tebbutt, University of British Columbia; and
T. To, The Hospital for Sick Children and University of Toronto.
AUTHOR CONTRIBUTIONS
Conceptualization, M.B.A.; Methodology, S.M., E.K., S.S., L.B., and L.M.L.;
Investigation, S.M., B.R., and S.G.; Writing – Original Draft, S.M. and M.B.A.;
Writing – Review & Editing, S.S., B.R., L.B., S.G., C.J.F., L.M.L., R.J.S.,
A.B.B., P.J.M., S.E.T., P.S., T.J.M., D.L.L., M.R.S., and E.K.; Funding Acquisi-
tion, M.B.A.; Resources, R.J.S., A.B.B., P.J.M., S.E.T., P.S., D.L.L., and
M.R.S.; Supervision, M.B.A. and E.K.
DECLARATION OF INTERESTS
The authors declare no competing interests.
Received: July 8, 2018
Revised: November 2, 2018
Accepted: January 3, 2019
Published: February 13, 2019
REFERENCES
Alderete, T.L., Autran, C., Brekke, B.E., Knight, R., Bode, L., Goran, M.I., and
Fields, D.A. (2015). Associations between human milk oligosaccharides and
infant body composition in the first 6 mo of life. Am. J. Clin. Nutr. 102,
1381–1388.
Cell Host & Microbe 25, 324–335, February 13, 2019 333
Asnicar, F., Manara, S., Zolfo, M., Truong, D.T., Scholz, M., Armanini, F.,
Ferretti, P., Gorfer, V., Pedrotti, A., Tett, A., et al. (2017). Studying vertical mi-
crobiome transmission from mothers to infants by strain-level metagenomic
profiling. mSystems 2, e00164–00116.
Astudillo-Garcı´a, C., Bell, J.J., Webster, N.S., Glasl, B., Jompa, J., Montoya,
J.M., and Taylor, M.W. (2017). Evaluating the core microbiota in complex com-
munities: a systematic investigation. Environ. Microbiol. 19, 1450–1462.
Azad, M.B., Konya, T., Guttman, D.S., Field, C.J., Sears, M.R., HayGlass, K.T.,
Mandhane, P.J., Turvey, S.E., Subbarao, P., Becker, A.B., et al.; CHILD Study
Investigators (2015). Infant gut microbiota and food sensitization: associations
in the first year of life. Clin. Exp. Allergy 45, 632–643.
Beigelman, A., and Bacharier, L.B. (2016). Early-life respiratory infections and
asthma development: role in disease pathogenesis and potential targets for
disease prevention. Curr. Opin. Allergy Clin. Immunol. 16, 172–178.
Benjamini, Y., and Hochberg, Y. (1995). Controlling the false discovery rate: a
practical and powerful approach to multiple testing. J. R. Stat. Soc. B 57,
289–300.
Biagi, E., Quercia, S., Aceti, A., Beghetti, I., Rampelli, S., Turroni, S., Faldella,
G., Candela, M., Brigidi, P., and Corvaglia, L. (2017). The bacterial ecosystem
of mother’s milk and infant’s mouth and gut. Front. Microbiol. 8, 1214.
Bisanz, J.E., Enos, M.K., PrayGod, G., Seney, S., Macklaim, J.M., Chilton, S.,
Willner, D., Knight, R., Fusch, C., Fusch, G., et al. (2015). Microbiota at
multiple body sites during pregnancy in a rural Tanzanian population and
effects of moringa-supplemented probiotic yogurt. Appl. Environ. Microbiol.
81, 4965–4975.
Bode, L., McGuire, M., Rodriguez, J.M., Geddes, D.T., Hassiotou, F.,
Hartmann, P.E., and McGuire, M.K. (2014). It’s alive: microbes and cells in
human milk and their potential benefits to mother and infant. Adv. Nutr. 5,
571–573.
Bridgman, S.L., Kozyrskyj, A.L., Scott, J.A., Becker, A.B., and Azad, M.B.
(2016). Gut microbiota and allergic disease in children. Ann. Allergy Asthma
Immunol. 116, 99–105.
Cabrera-Rubio, R., Collado, M.C., Laitinen, K., Salminen, S., Isolauri, E., and
Mira, A. (2012). The human milk microbiome changes over lactation and is
shaped by maternal weight and mode of delivery. Am. J. Clin. Nutr. 96,
544–551.
Callahan, B.J., McMurdie, P.J., Rosen, M.J., Han, A.W., Johnson, A.J., and
Holmes, S.P. (2016). DADA2: high-resolution sample inference from Illumina
amplicon data. Nat. Methods 13, 581–583.
Caporaso, J.G., Kuczynski, J., Stombaugh, J., Bittinger, K., Bushman, F.D.,
Costello, E.K., Fierer, N., Pen˜ a, A.G., Goodrich, J.K., Gordon, J.I., et al.
(2010). QIIME allows analysis of high-throughput community sequencing
data. Nat. Methods 7, 335–336.
Caporaso, J.G., Lauber, C.L., Walters, W.A., Berg-Lyons, D., Huntley, J.,
Fierer, N., Owens, S.M., Betley, J., Fraser, L., Bauer, M., et al. (2012). Ultra-
high-throughput microbial community analysis on the Illumina HiSeq and
MiSeq platforms. ISME J. 6, 1621–1624.
Chan, D., Goruk, S., Becker, A.B., Subbarao, P., Mandhane, P.J., Turvey, S.E.,
Lefebvre, D., Sears, M.R., Field, C.J., and Azad, M.B. (2018). Adiponectin, lep-
tin and insulin in breast milk: associations with maternal characteristics and in-
fant body composition in the first year of life. Int. J. Obes. 42, 36–43.
Collado, M.C., Isolauri, E., Laitinen, K., and Salminen, S. (2008). Distinct
composition of gut microbiota during pregnancy in overweight and normal-
weight women. Am. J. Clin. Nutr. 88, 894–899.
Cruz-Hernandez, C., Goeuriot, S., Giuffrida, F., Thakkar, S.K., and Destaillats,
F. (2013). Direct quantification of fatty acids in human milk by gas chromatog-
raphy. J. Chromatogr. A 1284, 174–179.
Damaceno, Q.S., Souza, J.P., Nicoli, J.R., Paula, R.L., Assis, G.B., Figueiredo,
H.C., Azevedo, V., and Martins, F.S. (2017). Evaluation of potential probiotics
isolated from human milk and colostrum. Probiotics Antimicrob. Proteins 9,
371–379.
Davis, N.M., Proctor, D.M., Holmes, S.P., Relman, D.A., and Callahan, B.J.
(2018). Simple statistical identification and removal of contaminant sequences
in marker-gene and metagenomics data. Microbiome 6, 226.
de Souza, R.J., Zulyniak, M.A., Desai, D., Shaikh, M.R., Campbell, N.C.,
Lefebvre, D.L., Gupta, M., Wilson, J., Wahi, G., Atkinson, S.A., et al.;
NutriGen Alliance Investigators (2016). Harmonization of food-frequency ques-
tionnaires and dietary pattern analysis in 4 ethnically diverse birth cohorts.
J. Nutr. 146, 2343–2350.
Derakhshani, H., Tun, H.M., and Khafipour, E. (2016). An extended single-in-
dex multiplexed 16S rRNA sequencing for microbial community analysis on
MiSeq illumina platforms. J. Basic Microbiol. 56, 321–326.
DeSantis, T.Z., Hugenholtz, P., Larsen, N., Rojas, M., Brodie, E.L., Keller, K.,
Huber, T., Dalevi, D., Hu, P., and Andersen, G.L. (2006). Greengenes, a
chimera-checked 16S rRNA gene database and workbench compatible with
ARB. Appl. Environ. Microbiol. 72, 5069–5072.
Epskamp, S., and Stuber, S. (2017). semPlot: path diagrams and visual
analysis of various SEM packages’ output. R package version 1.1.
Fields, D.A., and Demerath, E.W. (2012). Relationship of insulin, glucose,
leptin, IL-6 and TNF-a in human breast milk with infant growth and body
composition. Pediatr. Obes. 7, 304–312.
Fujita, M., Roth, E., Lo, Y.J., Hurst, C., Vollner, J., and Kendell, A. (2012). In
poor families, mothers’ milk is richer for daughters than sons: a test of
Trivers-Willard hypothesis in agropastoral settlements in Northern Kenya.
Am. J. Phys. Anthropol. 149, 52–59.
Gloor, G.B., and Reid, G. (2016). Compositional analysis: a valid approach to
analyze microbiome high-throughput sequencing data. Can. J. Microbiol. 62,
692–703.
Gomez-Gallego, C., Garcia-Mantrana, I., Salminen, S., and Collado, M.C.
(2016). The human milk microbiome and factors influencing its composition
and activity. Semin. Fetal Neonatal Med. 21, 400–405.
Hinde, K. (2007). First-time macaque mothers bias milk composition in favor of
sons. Curr. Biol. 17, R958–R959.
Hinde, K., Foster, A.B., Landis, L.M., Rendina, D., Oftedal, O.T., and Power,
M.L. (2013). Daughter dearest: Sex-biased calcium in mother’s milk among
rhesus macaques. Am. J. Phys. Anthropol. 151, 144–150.
Hytten, F.E. (1954). Clinical and chemical studies in human lactation. BMJ 1,
175–182.
Jime´ nez, E., Arroyo, R., Ca´ rdenas, N., Marı´n, M., Serrano, P., Ferna´ ndez, L.,
and Rodrı´guez, J.M. (2017). Mammary candidiasis: a medical condition
without scientific evidence? PLoS One 12, e0181071.
Karstens, L., Asquith, M., Davin, S., Fair, D., Gregory, W.T., Wolfe, A.J., Braun,
J., and McWeeney, S. (2018). Controlling for contaminants in low biomass
16S rRNA gene sequencing experiments. bioRxiv. https://doi.org/10.1101/
329854.
Kline, R.B. (2016). Principles and Practices of Structural Equation Modeling,
Fourth Edition (The Guilford Press).
Klopp, A., Vehling, L., Becker, A.B., Subbarao, P., Mandhane, P.J., Turvey,
S.E., Lefebvre, D.L., Sears, M.R., and Azad, M.B.; CHILD Study
Investigators (2017). Modes of infant feeding and the risk of childhood asthma:
a Prospective Birth Cohort study. J. Pediatr. 190, 192–199.e2.
Knights, D., Ward, T.L., McKinlay, C.E., Miller, H., Gonzalez, A., McDonald, D.,
and Knight, R. (2014). Rethinking ‘‘enterotypes’’. Cell Host Microbe 16,
433–437.
Korkmaz, S., Goksuluk, D., and Zararsiz, G. (2014). MVN: an R package for
assessing multivariate normality. R J. 6, 151–162.
Laforest-Lapointe, I., and Arrieta, M.C. (2017). Patterns of early-life gut micro-
bial colonization during human immune development: an ecological perspec-
tive. Front. Immunol. 8, 788.
Li, M., Wang, M., and Donovan, S.M. (2014). Early development of the gut mi-
crobiome and immune-mediated childhood disorders. Semin. Reprod. Med.
32, 74–86.
Li, S.W., Watanabe, K., Hsu, C.C., Chao, S.H., Yang, Z.H., Lin, Y.J., Chen,
C.C., Cao, Y.M., Huang, H.C., Chang, C.H., and Tsai, Y.C. (2017). Bacterial
composition and diversity in breast milk samples from mothers living in
Taiwan and mainland China. Front. Microbiol. 8, 965.
Markle, J.G., Frank, D.N., Mortin-Toth, S., Robertson, C.E., Feazel, L.M.,
Rolle-Kampczyk, U., von Bergen, M., McCoy, K.D., Macpherson, A.J., and
334 Cell Host & Microbe 25, 324–335, February 13, 2019
Danska, J.S. (2013). Sex differences in the gut microbiome drive hormone-
dependent regulation of autoimmunity. Science 339, 1084–1088.
Mazurier, E., Rigourd, V., Perez, P., Buffin, R., Couedelo, L., Vaysse, C.,
Belcadi, W., Sitta, R., Nacka, F., Lamireau, D., et al. (2017). Effects of maternal
supplementation with omega-3 precursors on human milk composition.
J. Hum. Lact. 33, 319–328.
McGuire, M.K., and McGuire, M.A. (2015). Human milk: mother nature’s pro-
totypical probiotic food? Adv. Nutr. 6, 112–123.
McGuire, M.K., and McGuire, M.A. (2017). Got bacteria? The astounding,
yet not-so-surprising, microbiome of human milk. Curr. Opin. Biotechnol.
44, 63–68.
McGuire, M.K., Meehan, C.L., McGuire, M.A., Williams, J.E., Foster, J., Sellen,
D.W., Kamau-Mbuthia, E.W., Kamundia, E.W., Mbugua, S., Moore, S.E., et al.
(2017). What’s normal? Oligosaccharide concentrations and profiles in milk
produced by healthy women vary geographically. Am. J. Clin. Nutr. 105,
1086–1100.
McMurdie, P.J., and Holmes, S. (2013). phyloseq: an R package for reproduc-
ible interactive analysis and graphics of microbiome census data. PLoS One 8,
e61217.
Moraes, T.J., Lefebvre, D.L., Chooniedass, R., Becker, A.B., Brook, J.R.,
Denburg, J., HayGlass, K.T., Hegele, R.G., Kollmann, T.R., Macri, J., et al.;
CHILD Study Investigators (2015). The Canadian healthy infant longitudinal
development birth cohort study: biological samples and biobanking.
Paediatr. Perinat. Epidemiol. 29, 84–92.
Nozad, S., Ramin, A.G., and Asri Rezaie, S. (2012). Diurnal variations in milk
macro-mineral concentrations in Holstein dairy cows in Urmia, Iran. Vet.
Res. Forum 3, 281–285.
Oksanen, J., Blanchet, F.G., Friendly, M., Kindt, R., Legendre, P., McGlinn, D.,
Minchin, P.R., O’Hara, R.B., Simpson, G.L., Solymos, P., et al. (2017). Vegan:
community ecology package. R package version 2.4-3.
Palarea-Albaladejo, J., and Martin-Fernandez, J.A. (2015). zCompositions - R
package for multivariate imputation of left-censored data under a composi-
tional approach. Chemom. Intell. Lab. Syst. 143, 85–96.
Parigi, S.M., Eldh, M., Larssen, P., Gabrielsson, S., and Villablanca, E.J. (2015).
Breast milk and solid food shaping intestinal immunity. Front. Immunol. 6, 415.
Pettersen-Dahl, A., Murzakanova, G., Sandvik, L., and Laine, K. (2018).
Maternal body mass index as a predictor for delivery method. Acta Obstet.
Gynecol. Scand. 97, 212–218.
R Core Team (2017). R: A language and environment for statistical computing.
R Foundation for Statistical Computing, Vienna, Austria.
Rainard, P. (2017). Mammary microbiota of dairy ruminants: fact or fiction?
Vet. Res. 48, 25.
Rosseel, Y. (2012). lavaan: an R package for structural equation modeling.
J. Stat. Softw. 48, 1–36.
Sakwinska, O., Moine, D., Delley, M., Combremont, S., Rezzonico, E.,
Descombes, P., Vinyes-Pares, G., Zhang, Y., Wang, P., and Thakkar, S.K.
(2016). Microbiota in breast milk of Chinese lactating mothers. PLoS One 11,
e0160856.
Salter, S.J., Cox, M.J., Turek, E.M., Calus, S.T., Cookson, W.O., Moffatt, M.F.,
Turner, P., Parkhill, J., Loman, N.J., and Walker, A.W. (2014). Reagent and
laboratory contamination can critically impact sequence-based microbiome
analyses. BMC Biol. 12, 87.
Segata, N., Izard, J., Waldron, L., Gevers, D., Miropolsky, L., Garrett, W.S., and
Huttenhower, C. (2011). Metagenomic biomarker discovery and explanation.
Genome Biol. 12, R60.
Shade, A., and Handelsman, J. (2012). Beyond the Venn diagram: the hunt for
a core microbiome. Environ. Microbiol. 14, 4–12.
Sosa, R., and Barness, L. (1987). Bacterial growth in refrigerated human milk.
Am. J. Dis. Child. 141, 111–112.
Subbarao, P., Anand, S.S., Becker, A.B., Befus, A.D., Brauer, M., Brook, J.R.,
Denburg, J.A., HayGlass, K.T., Kobor, M.S., Kollmann, T.R., et al.; CHILD
Study investigators (2015). The Canadian Healthy Infant Longitudinal
Development (CHILD) Study: examining developmental origins of allergy and
asthma. Thorax 70, 998–1000.
Sullivan, E.C., Hinde, K., Mendoza, S.P., and Capitanio, J.P. (2011). Cortisol
concentrations in the milk of rhesus monkey mothers are associated with
confident temperament in sons, but not daughters. Dev. Psychobiol.
53, 96–104.
Takeshita, T., Kageyama, S., Furuta, M., Tsuboi, H., Takeuchi, K., Shibata, Y.,
Shimazaki, Y., Akifusa, S., Ninomiya, T., Kiyohara, Y., and Yamashita, Y.
(2016). Bacterial diversity in saliva and oral health-related conditions: the
Hisayama Study. Sci. Rep. 6, 22164.
Tibshirani, R., Walther, G., and Hastie, T. (2001). Estimating the number of
clusters in a data set via the gap statistic. J. R. Stat. Soc. B 63, 411–423.
Urbaniak, C., Cummins, J., Brackstone, M., Macklaim, J.M., Gloor, G.B.,
Baban, C.K., Scott, L., O’Hanlon, D.M., Burton, J.P., Francis, K.P., et al.
(2014). Microbiota of human breast tissue. Appl. Environ. Microbiol. 80,
3007–3014.
Urbaniak, C., Angelini, M., Gloor, G.B., and Reid, G. (2016). Human milk micro-
biota profiles in relation to birthing method, gestation and infant gender.
Microbiome 4, 1.
van Buuren, S., and Groothuis-Oudshoorn, K. (2011). mice: multivariate impu-
tation by chained equations in R. J. Stat. Softw. 45, 1–67.
Walker, A.W., Martin, J.C., Scott, P., Parkhill, J., Flint, H.J., and Scott, K.P.
(2015). 16S rRNA gene-based profiling of the human infant gut microbiota
is strongly influenced by sample processing and PCR primer choice.
Microbiome 3, 26.
West, P.A., Hewitt, J.H., and Murphy, O.M. (1979). Influence of methods of
collection and storage on the bacteriology of human milk. J. Appl. Bacteriol.
46, 269–277.
Williams, J.E., Price, W.J., Shafii, B., Yahvah, K.M., Bode, L., McGuire, M.A.,
and McGuire, M.K. (2017). Relationships among microbial communities,
maternal cells, oligosaccharides, and macronutrients in human milk. J. Hum.
Lact. 33, 540–551.
Wu, G.D., Chen, J., Hoffmann, C., Bittinger, K., Chen, Y.Y., Keilbaugh, S.A.,
Bewtra, M., Knights, D., Walters, W.A., Knight, R., et al. (2011). Linking long-
term dietary patterns with gut microbial enterotypes. Science 334, 105–108.
Cell Host & Microbe 25, 324–335, February 13, 2019 335
STAR+METHODS
KEY RESOURCES TABLE
CONTACT FOR REAGENT AND RESOURCE SHARING
Further information and requests for resources and reagents should be directed to and will be fulfilled by the Lead Contact, Meghan
Azad (meghan.azad@umanitoba.ca).
EXPERIMENTAL MODEL AND SUBJECT DETAILS
Inclusion and Exclusion of Study Participants
We studied a representative subset of 428 mothers in the Canadian Healthy Infant Longitudinal Development (CHILD) cohort, a
population-based birth cohort designed to study the developmental origins of pediatric asthma and allergy (Subbarao et al.,
2015). Women with singleton pregnancies were enrolled between 2008 and 2012 (n = 3407) and remained eligible if they deliv-
ered a healthy infant > 35 weeks gestation (n = 3264). For the current study, we selected a representative subset of 428 mother-
infant dyads with available milk samples, ensuring equal representation across the 4 study sites, excluding dyads missing key
maternal (e.g., diet, BMI) or infant (1y clinical) data, and then randomly selecting among the rest (Table S1). This study was
approved by the Human Research Ethics Boards at McMaster University and the Universities of Manitoba, Alberta, Toronto
and British Columbia.
REAGENT or RESOURCE SOURCE IDENTIFIER
Biological Samples
Breastmilk (1ml) Moraes et al., 2015 CHILD study http://childstudy.ca
Commercial Kits
Quick-DNA Fungal/Bacterial extraction kit Zymo Research Cat# D6005
MiSeq Reagent Kit v3 (600-cycle) Illumina Cat# MS-102-3003
Deposited Data
Raw data This paper 16S rRNA sequence data (NCBI) BioProject:
PRJNA481046, Sequence Read Archive, SRA:
SRP153543
Primers
16S rRNA-Forward Primer 515F:
GTGCCAGCMGCCGCGGTAA
Caporaso et al., 2012 N/A
16S rRNA-Reverse Primer 806R:
GGACTACHVGGGTWTCTAAT
Caporaso et al., 2012 N/A
Software and Algorithms
QIIME2 v.2018.6 Caporaso et al., 2010 https://qiime2.org
Greengenes v. 13.8 DeSantis et al., 2006 http://greengenes.secondgenome.com
Phyloseq v. 1.19.1 McMurdie and Holmes, 2013 https://joey711.github.io/phyloseq/index.html
Decontam v. 1.1.0 (Davis et al., 2018) https://benjjneb.github.io/decontam/vignettes/
decontam_intro.html
MICE v. 2.30 van Buuren and Groothuis-
Oudshoorn, 2011
https://github.com/stefvanbuuren/mice
CoDaSeq v. 0.99.1 Gloor and Reid, 2016 https://github.com/ggloor/CoDaSeq
Vegan v. 2.4-4 Oksanen et al., 2017 https://cran.r-project.org/web/packages/vegan/
vegan.pdf
LEFSe Segata et al., 2011 http://huttenhower.sph.harvard.edu/galaxy/
Lavaan v. 0.5-23.1097 Rosseel, 2012 N/A
R v. 3.3.3 and 3.5.1 R Core Team https://www.r-project.org
e1 Cell Host & Microbe 25, 324–335.e1–e4, February 13, 2019
Maternal, Infant and Early-Life Factors
Infant feeding was reported by standardized questionnaire at 3, 6, 12, 18 and 24 months. At the time of sample collection
(3-4 months), breastfeeding status was classified as exclusive (human milk only) or partial (human milk supplemented with infant for-
mula or solid food). The mode of breastmilk feeding was reported for breastfed infants at three months of age and classified as ‘‘direct
only’’ (no feeding of pumped milk), or ‘‘some indirect’’ (at least one serving of pumped milk in the past two weeks) (Klopp et al., 2017).
Maternal age, infant sex, birth weight, gestational age, method of birth, parity, and intrapartum antibiotic use were documented from
hospital records. Mode of delivery was categorised as normal vaginal delivery (NVD), emergency, or elective Caesarean section.
Maternal ethnicity, tobacco smoking, history of asthma diagnosis, and maternal and child intravenous and/or oral antibiotic before
sample collection use were reported by standardized questionnaire. Maternal dietary patterns were determined by principal compo-
nents analysis (PCA) from a modified food frequency questionnaire (de Souza et al., 2016).
METHOD DETAILS
Sample Collection and Processing
Each mother provided one sample of milk at 3-4 months postpartum [mean (SD) 17 (5) weeks postpartum] in a sterile milk container
provided by CHILD study. To control for differences in the milk composition of fore- and hindmilk (Hytten, 1954) as well as the diurnal
variation (Nozad et al., 2012); a mix of foremilk and hindmilk from multiple feeds during a 24-hour period was collected. Hand expres-
sion was recommended, but pumping was also acceptable. The sample was not collected aseptically. Samples were refrigerated at
home for up to 24 hours before being collected and processed by study staff (Moraes et al., 2015). Samples were stored at À80
C
until analysis. The time between sample pick-up from home and processing by the CHILD laboratory personnel was recorded. We did
not observe any associations of sample processing time with milk microbiota richness, diversity, taxa relative abundance, overall
composition, and cluster membership (not shown).
Milk Microbiota Analysis
Genomic DNA was extracted from 1 mL breastmilk using Quick-DNA Fungal/Bacterial extraction kit following the manufacturer’s
instructions (Zymo Research, USA). The samples were centrifuged (13,000 g at 4
C for 20 min), the fat rim was carefully removed
using a sterile swab, and the supernatant stored for future analysis. Total DNA was extracted from the pellet. Samples were
sequenced following amplification of V4 hypervariable region of the 16S rRNA gene with modified F515/R806 primers (Caporaso
et al., 2012) on a MiSeq platform (Illumina, San Diego, CA, USA) as previously described (Derakhshani et al., 2016). Sterile DNA-
free water was used as negative controls in sequencing library preparation. A mock community consisting of DNA extracted
from of 10 species with known theoretical relative abundances (Zymo Research, USA) were also run as positive control. Over-
lapping paired-end reads were processed with dada2 pipeline (Callahan et al., 2016) using the open-source software QIIME
2 v.2018.6 (https://qiime2.org) (Caporaso et al., 2010). Unique amplicon sequence variants (ASVs) were assigned a taxonomy
and aligned to the 2013 release of the Greengenes reference database at 99% sequence similarity (DeSantis et al., 2006).
Demultiplexed sequencing data was deposited into the Sequence Read Archive (SRA) of NCBI and can be accessed via acces-
sion number SRA: SRP153543.
Analysis of Other Milk Components
Human milk oligosaccharides (HMOs), milk fatty acids (MFA), and milk metabolic hormones (insulin and leptin) were measured in
the same milk samples. HMO analysis was performed at the University of California, San Diego, as previously described (Fields and
Demerath, 2012). Briefly, raffinose was added to each sample as an internal standard for absolute quantification. HMOs were iso-
lated by high-throughput solid-phase extraction, fluorescently labeled, and analyzed by high-performance liquid chromatography
with fluorescence detection. 19 HMOs were detected and quantified on the basis of retention time comparison with commercial
standard oligosaccharides and mass spectrometry analysis. These 19 HMOs typically account for  90% of total HMO content;
their concentrations were summed to estimate total HMO concentration. The relative abundance of each HMO was calculated.
Maternal secretor status was defined by the presence of 20
-fucosyllactose (20
-FL) or lacto-N-fucopentaose (LNFP) (Alderete
et al., 2015). Milk metabolic hormones (leptin and insulin) were measured using the Mesoscale Discovery System at University
of Alberta as previously described (Chan et al., 2018). Briefly, measurements were done in duplicate using kits precoated with
the antibody to each hormone following the manufacturer’s instructions (MesoScale Discovery, Gaithersburg, MD, USA). Results
were measured on the MesoScale Discovery Sector Imager 2400 plate reader and the Discovery Workbench 3.0 software was
used to generate standard curves and calculate analyte concentrations in each sample. MFAs were analyzed by gas liquid chro-
matography at University of Alberta as previously described (Cruz-Hernandez et al., 2013). Briefly, total milk lipids were extracted
using a modified Folch protocol. The total lipid extracted was resuspended in 500 mL fresh hexane and injected into a gas liquid
chromatograph. Fatty acid methyl esters were prepared using HCl/Methanol (3N) as a catalyst followed by gas liquid chromatog-
raphy. An internal triglyceride standard was added to identify the fatty acids and determine their relative concentration. Fatty acids
were identified according to commercial standards 502 and 643 (Nu-Chek Prep, Elysian, MN, USA) and expressed as a relative
percent of total identified fatty acids.
Cell Host  Microbe 25, 324–335.e1–e4, February 13, 2019 e2
QUANTIFICATION AND STATISTICAL ANALYSIS
Microbial Data Pre-processing and Reagent Contaminant Removal
Data analysis was conducted in R (R Core Team, 2017). Initial preprocessing of the ASV table was conducted using the Phyloseq
package (McMurdie and Holmes, 2013). Potential reagent contaminants (Salter et al., 2014) were identified using decontam package
based on either the frequency of the ASV in the negative control or the negative correlation with DNA concentration (Davis et al.,
2018). Decontam package could remove 70%–90% of contaminants specifically when the source of contamination was not well-
defined (Karstens et al., 2018). Overall, 9,711 unique ASVs were detected and 173 were identified as contaminants and excluded.
Mock community composition was assessed and agreement with theoretical composition verified (Figure S1D). Samples with
less than 25,000 sequencing reads were excluded (n = 35) and the remaining samples (n = 393) were rarefied to the minimum
25,000 sequencing reads per sample. ASVs only present in the mock community or negative controls (n = 894) and ASVs belonging
to phylum Cyanobacteria, family of mitochondria, and class of chloroplast (n = 240) were removed. ASVs with less than 20 reads
across the entire dataset (n = 6,173) were also removed, resulting in 1,972 remaining ASVs. The contribution of the excluded rare
ASVs to the total reads per sample was deemed negligible (Figure S1E). The numbers of sequencing reads of taxa were then rela-
tivized to the total sum of 25,000. This dataset was used for analysis unless otherwise specified.
Handling Missing Data
Missing data in HMOs (n = 4) and MFA (n = 5) matrices was imputed using multivariate imputation by chained equations (MICE) pack-
age (van Buuren and Groothuis-Oudshoorn, 2011). Dimension reduction of ASVs, HMOs, and MFAs was achieved by principal
component analysis (PCA). Samples with missing data for other covariates were excluded from multivariable analyses.
Exclusion of Data
Sequencing reads were excluded if they were deemed to be potential reagent contaminants. Samples were excluded if they had less
than 25,000 sequencing reads. Additionally, samples were excluded from multivariable analyses if they were missing essential co-
variate data.
Linear Association of a Diversity with Maternal, Infant, and Milk Factors
a diversity was assessed by the observed ASVs (richness) and inverse Simpson Index (diversity). Association of a diversity with
maternal, infant, early life, and milk factors was assessed by linear regression adjusting for factors with p value of  0.05 in univariate
analysis.
Linear Relationships between Taxa Abundance and Maternal, Infant, and Milk Factors
To control for the compositional nature of the data, ASV counts were center log-ratio transformed following zero-replacement
(Gloor and Reid, 2016; Palarea-Albaladejo and Martin-Fernandez, 2015). After this transformation, taxa relative abundances
were compared at species, genus, and phylum levels by one-way analysis of variance (ANOVA). P values were corrected with
Benjamini-Hochberg’s false discovery rate (FDR) method (Benjamini and Hochberg, 1995).
Redundancy Analysis
The association of maternal, infant, early life, and milk factors with milk microbiota composition was assessed by redundancy
analysis (RDA) with 1000 permutations using the vegan package (Oksanen et al., 2017).
Hierarchical Clustering of the Core Microbiota
Hierarchical clustering was performed on Bray-Curtis dissimilarity matrix of core ASVs (n = 12, defined as being present in at least
95% of samples with minimum of 1% mean relative abundance), with ward sum-of-square algorithm. The optimal number of clusters
was determined using Gap statistics, which compares the observed change in within-cluster dispersion versus the expected change
under an appropriate reference null distribution (Tibshirani et al., 2001). Dissimilarity (b diversity) of clusters was assessed by permu-
tational ANOVA (PERMANOVA) using the vegan package (Oksanen et al., 2017). Association of factors with cluster membership was
assessed using ANOVA (Tukey post hoc) for continuous and c2 (post hoc) for categorical variables.
Structural Equation Modeling
Structural equation modeling (SEM) was performed using confirmatory factor analysis (CFA) to assess the direct versus indirect
association of determinant factors of the milk microbiota. SEM was conducted using the lavaan package (Rosseel, 2012) and
path diagrams were visualized using semPlot package (Epskamp and Stuber, 2017). Variable selection was informed by the results
of statistical tests explained above. The milk environment was modeled as a latent construct with principal component (PC) 1 axes of
HMOs, MFAs, and hormones as indicators. The milk microbiota PC1 was used as the milk microbiota variable. Multivariate normality
was assessed by Henze-Zirkler’s tests (Korkmaz et al., 2014). Given the non-normality of the data and inclusion of dichotomous cat-
egorical variables, the model was estimated using maximum likelihood (ML) parameter estimation with bootstrapping (n = 1000)
(Kline, 2016). The latent variable was scaled to have variance of one. Model fit was assessed by c2 test, the comparative fix
index (CFI), root mean square error of approximation (RSMEA) and its 90% confidence interval (CI), and the standardized root
e3 Cell Host  Microbe 25, 324–335.e1–e4, February 13, 2019
mean residuals (SRMR). Non-significant c2 test, CFI R 0.9, RMSEA  0.05, and SRMR  0.08 were considered as indications of good
model fit (Kline, 2016). Equivalents of the final model were explored and defined by changing the directionality of associations or
implying co-variation instead of causation.
Linear Discriminant Analysis
Taxa enrichment based on mode of breastfeeding was assessed by linear discriminant analysis (LDA) effect size (LEfSe) with default
parameters and logarithmic LDA score threshold of three (Segata et al., 2011).
Presence/Absence Analysis by Mode of Breastfeeding
Bifidobacterium and Enterobacteriaceae prevalence according to the mode of breastfeeding was assessed by c2 test.
DATA AND SOFTWARE AVAILABILITY
The accession numbers for the 16S rRNA sequence data reported in this paper are BioProject: PRJNA481046 and SRA: SRP153543.
Cell Host  Microbe 25, 324–335.e1–e4, February 13, 2019 e4
Cell Host  Microbe, Volume 25
Supplemental Information
Composition and Variation of the Human
Milk Microbiota Are Influenced
by Maternal and Early-Life Factors
Shirin Moossavi, Shadi Sepehri, Bianca Robertson, Lars Bode, Sue Goruk, Catherine J.
Field, Lisa M. Lix, Russell J. de Souza, Allan B. Becker, Piushkumar J. Mandhane, Stuart E.
Turvey, Padmaja Subbarao, Theo J. Moraes, Diana L. Lefebvre, Malcolm R. Sears, Ehsan
Khafipour, and Meghan B. Azad
1
Table S1. Characteristics of mother-infant dyads from the CHILD cohort included in this
analysis (n=393) in comparison with all eligible dyads (n=2536) related to STAR
Methods.
Table S2. Most abundant bacterial genera (1% mean relative abundance) in the human milk
microbiota among 393 mothers in the CHILD cohort related to Figure 1.
Table S3. Core milk microbiotaa
among 393 mothers in the CHILD cohort in comparison to
the negative controls related to Figure 1.
Table S4. Comparison of milk microbiota composition at family level, by cluster related to
Figure 1.
Table S5. Univariate associations of maternal and infant factors with milk microbiota
composition and cluster membership among 393 dyads in the CHILD cohort related
to Figure 1.
Table S6. Factors not associated with milk microbiota α diversity among 393 mothers in the
CHILD cohort related to Table 1.
Table S7. Comparison the equivalent models of the final structural equation model related to
Figure 4.
Figure S1. Data quality control related to STAR Methods. .
Figure S2. Hierarchical clustering of core milk microbiota among 393 mothers in the CHILD
cohort related to Figure 1.
Figure S3. Equivalent structural equation models assessing other potentially plausible models
of associations of milk microbiota determinants among 393 mothers in the
CHILD cohort related to Figure 4.
Figure S4. Expressed milk microbiota is influenced by collection method related to Figure 5.
2
Table S1. Characteristics of mother-infant dyads from the CHILD cohort included in this
analysis (n=393) in comparison with all eligible dyads (n=2536) related to STAR Methods.
Factor Characteristics
Mean ± SD or n (%)a
Subset for
this study
N=393
All eligible
dyads
N=2536b
Maternal
Age (years) 33.0 ± 4.2 32.7 ± 4.2
Pre-pregnancy BMI (Kg/m2
) 24.3 ± 5.2 24.5 ± 6.3
History of atopy 251 (63.9) 1624 (65.4)
Secretor status 279 (71.7) 901 (74.7)c
Ethnicity
Caucasian
Asian
First Nations
Other
287 (73.0)
73 (18.6)
15 (3.8)
18 (4.6)
1870 (74.3)
403 (16.0)
87 (3.5)
158 (6.3)
Infant
Birth weight (g) 3469 ± 469 3450 ± 479
Female sex 192 (48.9) 1198 (47.2)
Gestational age (weeks) 39.2 ± 1.3 39.2 ± 1.2
Earlylife
Mode of delivery
Elective C/S
Emergency C/S
Vaginal
46 (11.9)
47 (12.1)
294 (76.0)
264 (10.6)
339 (13.6)
1893 (75.8)
Maternal intrapartum antibiotics 139 (35.8) 996 (39.9)
Maternal postpartum antibiotics before 3-4 months 41 (10.6) 265 (10.8)
Child antibiotics before 3-4 months 11 (2.8) 75 (3.1)
Older siblings
None
One
Two or more
211 (53.7)
126 (32.1)
56 (14.2)
1345 (53.1)
860 (33.9)
330 (13.0)
Breastfeeding
Lactation stage at sample collection (weeks) 17.3 ± 5.3 16.5 ± 5.0
Exclusive BF (breast milk only) at sample collection 190 (48.3) 1393 (55.9)
Direct BF (at the breast) only 162 (41.9) 1018 (40.1)
Duration of BF (months) 13.2 ± 5.8 12.5 ± 5.6
Duration of exclusive BF (months) 3.5 ± 2.3 3.7 ± 2.3
Milk
HMO concentration (mg/mL) 10.2 ± 2.1 10.3 ± 2.1c
HMO Simpson’s diversity 4.9 ± 1.4 4.9 ± 1.3c
Insulin (pg/mL) 760 ± 664 Unknown
Leptin (pg/mL) 556 ± 601 Unknown
a
Percentages are calculated after excluding dyads with missing data. BF, breastfeeding; BMI,
body mass index; C/S, Caesarean section; HMO, human milk oligosaccharide; NVD, normal
vaginal delivery
b
Those who breastfed ≥12 weeks and provided a milk sample
c
available for N=1206
3
Table S2. Most abundant bacterial genera (1% mean relative abundance) in the human
milk microbiota among 393 mothers in the CHILD cohort related to Figure 1.
Lineage Genus
Prevalence
(%)a
Relative abundance (%)
Mean±SD CV Range
Firmicutes - Streptococcaceae Streptococcus 98.7 16.2 ± 16.7 1.0 87.4
Firmicutes - Staphylococcaceae Staphylococcus 99.8 4.9 ± 11.5 2.4 87.5
Proteobacteria - Oxalobacteraceae Ralstonia 99.2 4.8 ± 2.8 0.6 9.4
Proteobacteria - Comamonadaceae Acidovorax 99.5 3.9 ± 2.3 0.6 13.3
Proteobacteria - Moraxellaceae Acinetobacter 48.6 3.7 ± 12.0 3.2 87.3
Proteobacteria - Comamonadaceae Aquabacterium 99.5 3.2 ± 1.9 0.6 7.6
Proteobacteria - Oxalobacteraceae Massilia 99.8 2.4 ± 1.4 0.6 6.5
Proteobacteria - Rhizobiaceae Agrobacterium 99.2 1.9 ± 1.1 0.6 4.5
Proteobacteria - Uncl. Alteromonadales Rheinheimera 99.5 1.9 ± 1.2 0.6 4.7
Firmicutes - Veillonellaceae Veillonella 78.1 1.5 ± 2.7 1.8 21.0
Proteobacteria - Neisseriaceae Vogesella 99.2 1.2 ± 0.7 0.6 3.0
Actinobacteria - Nocardioidaceae Nocardioides 99.2 1.1 ± 0.6 0.6 2.6
Proteobacteria - Pseudomonadaceae Pseudomonas 33.3 1.0 ± 7.2 6.9 72.8
a
Percentage of samples where the taxa was present.
CV, coefficient of variation; Uncl, unclassified.
4
Table S3. Core milk microbiotaa
among 393 mothers in the CHILD cohort in comparison
to the negative controls related to Figure 1.
Lineage Genus
Samples
(n=393)
Negative
controls
(n=15)
Mean±SD Maximum Prevalence Prevalence
Proteobacteria - Burkholderiales Unclassified 5.86 ± 3.43 12.56 100% 13%
Firmicutes - Staphylococcaceae Staphylococcus 4.86 ± 11.5 87.5 100% 20%
Proteobacteria - Oxalobacteraceae Ralstonia 4.79 ± 2.76 9.41 100% 7%
Proteobacteria - Comamonadaceae Unclassified 4.42 ± 2.58 9.75 100% 7%
Proteobacteria - Comamonadaceae Acidovorax 3.95 ± 2.34 13.33 100% 20%
Proteobacteria - Oxalobacteraceae Massilia 2.37 ± 1.40 6.47 100% 13%
Proteobacteria – Uncl. Alteromonadales Rheinheimera 1.89 ± 1.15 4.74 100% 0
Proteobacteria - Rhizobiaceae Agrobacterium 1.85 ± 1.08 4.51 100% 7%
Proteobacteria - Rhodospirillaceae Unclassified 1.61 ± 1.07 5.24 100% 7%
Proteobacteria - Neisseriaceae Vogesella 1.23 ± 0.74 3.04 100% 0
Actinobacteria - Nocardioidaceae Nocardioides 1.09 ± 0.65 2.61 100% 13%
Proteobacteria - Burkholderiales Unclassified 1.07 ± 0.64 2.63 100% 0
a
Defined as amplicon sequence variants (ASVs) present in at least 95% of samples with mean
relative abundance of more than 1% after removing potential reagent contaminants. Uncl, unclassified.
5
Table S4. Comparison of milk microbiota composition at family level, by cluster related to
Figure 1.
Family C1
(n=42)
C2
(n=98)
C3
(n=161)
C4
(n=92)
q value
Unclassified Alteromonadales 0.08 ± 0.08 0.85 ± 0.4 2.95 ± 0.6 1.98 ± 0.5 0.001
Veillonellaceae 1.18 ± 3.38 2.5 ± 3.8 0.67 ± 1.1 2.2 ± 2.4 c 0.001
Neisseriaceae 0.06 ± 0.05 0.55 ± 0.3 1.9 ± 0.4 1.29 ± 0.3 0.001
Pseudomonadaceae 3.31 ± 11.3 2.40 ± 12.1 0.14 ± 0.9 0.07 ± 0.2 0.007
Oxalobacteraceae 0.38 ± 0.29 3.27 ± 1.5 11.2 ± 1.5 7.37 ± 1.1 0.001
Moraxellaceae 17.8 ± 22.2 6.31 ± 15.6 0.18 ± 1.2 0.75 ± 2.9 0.001
Enterobacteriaceae 7.6 ± 13.9 1.59 ± 4.9 0.31 ± 1.8 0.41 ± 1.8 0.001
Comamonadaceae 0.9 ± 2.1 5.20 ± 2.4 17.9 ± 2.3 11.9 ± 1.8 0.001
Rhizobiaceae 0.1 ± 0.1 0.85 ± 0.38 2.9 ± 0.5 1.91 ± 0.4 0.001
Nocardioidaceae 0.06 ± 0.06 0.49 ± 0.23 1.7 ± 0.3 1.13 ± 0.2 0.001
Streptococcaceae 7.1 ± 17.8 22.8 ± 22.8 9.45 ± 7.2 25.1 ± 12.6 0.001
Staphylococcaceae 1.3 ± 2.1 11.0 ± 20.8 2.48 ± 3.3 4.12 ± 5.6 0.001
Other 60.0 ± 26.8 41.5 ± 22.8 45.6 ± 4.8 40.2 ± 9.9 -
Families with 1% overall mean relative abundance are shown. Relative abundances of dominant families
within each cluster are in bold. Data is presented as mean ± SD. Relative abundances were compared by
one-way analysis of variance (ANOVA).
6
Table S5. Univariate associations of maternal and infant factors with milk microbiota composition and
cluster membership among 393 dyads in the CHILD cohort related to Figure 1. p values 0.05 are in
bold. Data are presented as mean±SD.
Factor
Microbiota Cluster Membership a
C1
(n = 42)
C2
(n = 98)
C3
(n = 161)
C4
(n = 92)
Overall
p-value
BMI (Kg/m2
) 25.8 ± 7.4 24.6 ± 4.8 24.2 ± 4.7 23.8 ± 4.5 0.17
Secretor status, n (%)
Secretor
Non-secretor
30 (71.4)
12 (28.6)
76 (79.2)
20 (20.8)
104 (65.4)
55 (34.6)
69 (75.0)
23 (25.0)
0.10
Ethnicity, n (%)
Asian
Caucasian
First Nation
Other
6 (14.2)
33 (78.6)
1 (2.4)
2 (4.8)
21 (21.4)
68 (69.4)
5 (5.1)
4 (4.1)
36 (22.4)
112 (69.6)
6 (3.7)
7 (4.3)
10 (10.9)
74 (80.4)
3 (3.3)
5 (5.4)
0.61
Lactation stage at sample collection (weeks) 17.6 ± 5.2 17.7 ± 6.16 16.8 ± 4.9 17.5 ± 5.3 0.51
Mode of breastfeeding, n (%)
Indirect
Direct
36 (85.7)
6 (14.3) cde
63 (65.6)
33 (34.4) cfg
83 (52.5)
75 (47.5) dg
43 (47.3)
48 (52.7) ef
0.001
Milk expression b
Manual
Pump
1 (6.3)
15 (93.7)
6 (19.4)
25 (80.6)
9 (29.6)
31 (70.4)
4 (16.7)
20 (83.3)
0.54
Exclusive breastfeeding at sample collection, n (%)
No
Yes
29 (69.1)
13 (30.9) g
54 (55.1)
44 (44.9)
74 (46.0)
87 (54.0) g
46 (50.0)
46 (50.0)
0.052
Total HMO (mg/mL) 9.9 ± 1.9 10.6 ± 2.1 10.1 ± 2.1 10.2 ± 2.2 0.18
Insulin (pg/mL) 741 ± 591 788 ± 552 748 ± 687 760 ± 765 0.97
Leptin (pg/mL) 612 ± 615 564 ± 581 554 ± 604 528 ± 617 0.91
Number of older siblings, n (%)
None
One
Two or more
30 (71.4)
9 (21.4)
3 (7.2) gh
54 (55.1)
31 (31.6)
13 (13.3)
81 (50.3)
55 (34.2)
25 (15.5) g
46 (50.0)
31 (33.7)
15 (16.3) h
0.08
Infant sex
Female
Male
17 (40.5)
25 (59.5)
46 (46.9)
52 (53.1)
90 (55.9)
71 (44.1)
39 (42.4)
53 (57.6)
0.11
Mode of delivery
Vaginal
Caesarean section - emergency
Caesarean section - elective
29 (69.1)
9 (21.4)
4 (9.5)
68 (80.0)
11 (12.9)
6 (7.1)
127 (79.3)
19 (11.9)
14 (8.8)
70 (77.8)
8 (8.9)
12 (13.3)
0.22
a
Associations were tested by ANOVA (Tukey post hoc) for continuous and χ2 (post hoc) for categorical variables.
b
n= 112. Method of milk expression was not systematically captured, but was analyzed for samples where it was noted.
The frequency is calculated in the subset with available data.
c, d, e, f
p0.05 for overall and pairwise comparison of clusters. gh
p0.1. Same superscript denotes pairwise significant
difference.
Not Shown: Maternal age, history of atopy, infant birth weight, gestational age, intrapartum antibiotics, and antibiotics
before the time of sample collection by mother or child were not significantly associated with the clusters. BMI, body mass
index; HMO, human milk oligosaccharide
7
Table S6. Factors not associated with milk microbiota α diversity among 393 mothers in
the CHILD cohort related to Table 1.
Factor n (%)
Observed
ASVs
Inverse
Simpson
Maternal age (years)
20-30
30-40
 40
100 (25.3)
270 (68.4)
25 (6.3)
149 ± 43
147 ± 44
140 ± 42
16.1 ± 9.0
15.8 ± 8.7
14.5 ± 9.7
Maternal weight class
Normal
Overweight/obese
260 (65.8)
135 (34.2)
147 ± 43
146 ± 45
15.9 ± 8.8
15.6 ± 8.9
Maternal ethnicity
Caucasian
Asian
First Nation
Other
276 (73.6)
70 (18.7)
15 (4.0)
14 (3.7)
148 ± 45
139 ± 38
148 ± 56
153 ± 33
15.9 ± 8.9
15.3 ± 8.5
16.4 ± 10.5
16.0 ± 7.4
Maternal atopy
No
Yes
134 (35.7)
241 (64.3)
142 ± 44
150 ± 43
15.2 ± 9.1
16.1 ± 8.7
Maternal secretor status
Secretor
Non-secretor
269 (71.7)
106 (28.3)
147 ± 43
145 ± 40
15.4 ± 8.8
16.6 ± 8.7
Maternal ever smoking
No
Yes
307 (77.7)
88 (22.3)
147 ± 42
145 ± 48
15.9 ± 8.8
15.4 ± 9.2
Maternal prenatal smoking
No
Yes
377 (95.4)
18 (4.6)
147 ± 43
140 ± 61
15.9 ± 8.9
12.6 ± 8.3
Lactation stage (weeks)
10-15
15-21
21-27
27-32
32
175 (44.5)
133 (33.8)
56 (14.2)
21 (5.4)
8 (2.1)
149 ± 45
144 ± 39
142 ± 47
152 ± 50
144 ± 26
16.1 ± 8.9
15.4 ± 8.8
14.9 ± 8.9
17.5 ± 9.6
14.2 ± 5.5
Univariate linear regression, all p  0.05
Sample processing time, HMO diversity, or total HMO concentration were also not significantly
associated with α diversity (not shown).
8
Table S7. Comparison the equivalent models of the final structural equation model related
to Figure 4. See also Figure S5.
Model Difference from final model Df χ2 p value CFI RMSEA
(90% CI)
SRMR AIC
Final
model
Causative effect of milk on
microbiota
40 0.247 0.985
0.019
(0.00 – 0.042)
0.040 11401
A
Causative effect of microbiota on
milk
40 0.251 0.985
0.019
(0.00 – 0.042)
0.040 11401
B
Milk environment and microbiota
correlation
40 0.247 0.985
0.019
(0.00 – 0.042)
0.040 11401
C Effect of BMI on milk removed 41  0.001 0.404
0.119
(0.106 – 0.133)
0.108 11614
D
Effect of mode of breastfeeding on
the milk environment
40 0.028 0.949
0.035
(0.012 – 0.054)
0.046 11414
E Effect of maternal diet on MFA 38 0.210 0.982
0.022
(0.00 – 0.044)
0.040 11404
F Direct effect of HMO on microbiota 39 0.241 0.984
0.020
(0.00 – 0.043)
0.040 11402
AIC, Akaike information criterion; BMI, body mass index; CFI, comparative fix index; CI, confidence interval;
HMO, human milk oligosaccharide; MFA, milk fatty acid; RSMEA, root mean square error of approximation;
SRMR, standardized root mean residuals.
Indications of poor model fit are in bold: χ2 p-value 0.05, CFI 0.9, RMSEA  0.05, and SRMR0.08
9
Figure S1. Data quality control related to STAR Methods. A) Milk microbiota β diversity by
sample type, sequencing run, and PCR plates, prior to removal of potential contaminant ASVs
using the decontam package. β diversity was assessed on Bray-Curtis dissimilarity and tested by
PERMANOVA. There was a significant difference based on sample type but not sequencing
runs or PCR plates. Comparison of B) Sequencing depth and C) Composition of the top 500
most abundant ASVs before and after contaminant removal. D) Relative abundance of most
abundant bacterial genera (1% mean relative abundance) in the mock community in comparison
with the theoretical composition, each bar represents a replicate. E) Sequencing output
processing to remove low abundance ASVs. The 393 individual samples are on the X axis and
relative abundances of the sums of sequence reads per sample are plotted along the Y axis. The
initial ASV table following contaminant removal contained 8145 ASVs. Following exclusion of
ASVs with less than 20 reads across the entire dataset, 1,972 ASVs remained. Exclusion of
ASVs with less than 0.01% and 1% relative abundance resulted in 301 and 22 remaining ASVs,
respectively. Analyses have been performed on the 1,972 ASVs with 20 reads in total, unless
stated otherwise. N samples = 428, N mock =18, N negative control =15,
Sequencingreads
persample(x103
)
Totalsequence
reads(x106
)
Before contaminant
removal
After contaminant
removalB) C)
Mock Negative Sample Mock Negative Sample Mock Negative Sample
p=0.001
Sample type Sequencing run PCR Plates
NS NS
A)
Theoretical
composition
Observed composition in
mock community replicates
RelativeAbundance(%)
D) E)
RelativeAbundance(%)
10
Figure S2. Hierarchical clustering of core milk microbiota among 393 mothers in the
CHILD cohort related to Figure 1. The optimum numbers of clusters in our data were
determined by Gap statistics. According to the gap statistics, there are four main clusters. A) Gap
statistics plot, B) heterogeneity of clusters in terms of the milk microbiota compositional
dispersion, C) PCoA plot on Bray-Curtis dissimilarity among ASVs with more than 0.01% mean
relative abundance (n=301). β diversity between clusters was assessed by PERMANOVA; p-
values are shown in panels B and C.
A)
B)
C)
ASVs  0.01% mean relative abundance
p overall  0.001
p pairwise  0.001
R2 = 0.33
p overall  0.001
11
Figure S3. Equivalent structural equation models assessing other potentially plausible
models of associations of milk microbiota determinants among 393 mothers in the CHILD
cohort related to Figure 4. Compared to the final model depicted in Figure 3B, these models
assessed: A) causative effect of milk microbiota on milk environment, B) correlation of milk
microbiota and milk microenvironment, C) only direct effect of BMI on milk microbiota
retained, D) effect of mode of breastfeeding on the milk environment, E) maternal diet effect on
milk fatty acids, F) direct effect of HMOs on milk microbiota. Standardized β coefficients are
reported. Abbreviations: mlk, milk environment; MFA, milk fatty acid PC1; INS, insulin; LEP,
leptin; HMO, human milk oligosaccharide PC1; microbiota, milk microbiota PC1; BMI,
maternal body mass; DEL, mode of delivery; SEX, infant sex; MOD: mode of breastfeeding;
DRC1 and DRC2, maternal diet PC1 and PC2. * p0.05, ** p0.01. Green (positive), red
(negative). See also Table S7.
** ***
** ****** ****
** **** **
**
***
A)
B)
C)
**
Micro-
biota
Micro-
biota
Micro-
biota
*
** **** *
*
*
F)
Micro-
biota
** ****
*
***
D)
** ** ** **** *
** **
**
**
**
***
E)
Micro-
biota
Micro-
biota
**
*
**
*
12
Figure S4. Expressed milk microbiota is influenced by collection method related to Figure
5. A) α diversity, B) β diversity.
B)
Direct Only
Some Indirect
Direct Only
Some Indirect
A)

Weitere ähnliche Inhalte

Ähnlich wie Composition and Variation of the Human Milk Microbiota Are Influenced by Maternal and Early-Life Factors

Veile and Kramer AJHB 2016
Veile and Kramer AJHB 2016Veile and Kramer AJHB 2016
Veile and Kramer AJHB 2016Kristen Chalmers
 
Conway yakultfoundation2015
Conway yakultfoundation2015Conway yakultfoundation2015
Conway yakultfoundation2015neerjayakult
 
Maternal diet during pregnancy is related with the infant stool microbiome in...
Maternal diet during pregnancy is related with the infant stool microbiome in...Maternal diet during pregnancy is related with the infant stool microbiome in...
Maternal diet during pregnancy is related with the infant stool microbiome in...BARRY STANLEY 2 fasd
 
Campus How Does Breast Feeding Compared to Bottle Feeding.pdf
Campus How Does Breast Feeding Compared to Bottle Feeding.pdfCampus How Does Breast Feeding Compared to Bottle Feeding.pdf
Campus How Does Breast Feeding Compared to Bottle Feeding.pdfbkbk37
 
Dietary tools for shaping the gut microbiome
Dietary tools for shaping the gut microbiomeDietary tools for shaping the gut microbiome
Dietary tools for shaping the gut microbiomeNutrition & Biosciences
 
Afaf first lecture on gutbiota
Afaf first lecture on gutbiota Afaf first lecture on gutbiota
Afaf first lecture on gutbiota Asma AlQahtani
 
Infant Formula Contaminated By Enterobacteria
Infant Formula Contaminated By EnterobacteriaInfant Formula Contaminated By Enterobacteria
Infant Formula Contaminated By EnterobacteriaBiblioteca Virtual
 
Powdered Infant Formula How Safe Is It
Powdered Infant Formula   How Safe Is ItPowdered Infant Formula   How Safe Is It
Powdered Infant Formula How Safe Is ItBiblioteca Virtual
 
The Pregnancy Microbiome: The Link Between Maternal Periodontitis and Adverse...
The Pregnancy Microbiome: The Link Between Maternal Periodontitis and Adverse...The Pregnancy Microbiome: The Link Between Maternal Periodontitis and Adverse...
The Pregnancy Microbiome: The Link Between Maternal Periodontitis and Adverse...Crimsonpublishers-IGRWH
 
microbiome and breastmilk and breastfeeding and advantages and disadvantages ...
microbiome and breastmilk and breastfeeding and advantages and disadvantages ...microbiome and breastmilk and breastfeeding and advantages and disadvantages ...
microbiome and breastmilk and breastfeeding and advantages and disadvantages ...ChiranthGowda9
 
Breakthrough of Human Milk Oligosaccharides
Breakthrough of Human Milk OligosaccharidesBreakthrough of Human Milk Oligosaccharides
Breakthrough of Human Milk OligosaccharidesKhaled Saad
 
Early total enteral feeding in stable preterm infants a systematic review and...
Early total enteral feeding in stable preterm infants a systematic review and...Early total enteral feeding in stable preterm infants a systematic review and...
Early total enteral feeding in stable preterm infants a systematic review and...dineshdharel13
 
The relationship between trace mineral concentrations of amniotic fluid with ...
The relationship between trace mineral concentrations of amniotic fluid with ...The relationship between trace mineral concentrations of amniotic fluid with ...
The relationship between trace mineral concentrations of amniotic fluid with ...Ali Olfati
 
1-s2.0-S2305050016300331-main
1-s2.0-S2305050016300331-main1-s2.0-S2305050016300331-main
1-s2.0-S2305050016300331-mainAli Olfati
 

Ähnlich wie Composition and Variation of the Human Milk Microbiota Are Influenced by Maternal and Early-Life Factors (20)

Veile and Kramer AJHB 2016
Veile and Kramer AJHB 2016Veile and Kramer AJHB 2016
Veile and Kramer AJHB 2016
 
Conway yakultfoundation2015
Conway yakultfoundation2015Conway yakultfoundation2015
Conway yakultfoundation2015
 
Maternal diet during pregnancy is related with the infant stool microbiome in...
Maternal diet during pregnancy is related with the infant stool microbiome in...Maternal diet during pregnancy is related with the infant stool microbiome in...
Maternal diet during pregnancy is related with the infant stool microbiome in...
 
Microbiota
MicrobiotaMicrobiota
Microbiota
 
Campus How Does Breast Feeding Compared to Bottle Feeding.pdf
Campus How Does Breast Feeding Compared to Bottle Feeding.pdfCampus How Does Breast Feeding Compared to Bottle Feeding.pdf
Campus How Does Breast Feeding Compared to Bottle Feeding.pdf
 
Dietary tools for shaping the gut microbiome
Dietary tools for shaping the gut microbiomeDietary tools for shaping the gut microbiome
Dietary tools for shaping the gut microbiome
 
Afaf first lecture on gutbiota
Afaf first lecture on gutbiota Afaf first lecture on gutbiota
Afaf first lecture on gutbiota
 
Infant Formula Contaminated By Enterobacteria
Infant Formula Contaminated By EnterobacteriaInfant Formula Contaminated By Enterobacteria
Infant Formula Contaminated By Enterobacteria
 
DYSBIOSIS IN CHILDREN BORN BY CAESAREAN SECTION
DYSBIOSIS IN CHILDREN BORN BY CAESAREAN SECTIONDYSBIOSIS IN CHILDREN BORN BY CAESAREAN SECTION
DYSBIOSIS IN CHILDREN BORN BY CAESAREAN SECTION
 
Powdered Infant Formula How Safe Is It
Powdered Infant Formula   How Safe Is ItPowdered Infant Formula   How Safe Is It
Powdered Infant Formula How Safe Is It
 
The Pregnancy Microbiome: The Link Between Maternal Periodontitis and Adverse...
The Pregnancy Microbiome: The Link Between Maternal Periodontitis and Adverse...The Pregnancy Microbiome: The Link Between Maternal Periodontitis and Adverse...
The Pregnancy Microbiome: The Link Between Maternal Periodontitis and Adverse...
 
American Journal of Epidemiology & Public Health
American Journal of Epidemiology & Public HealthAmerican Journal of Epidemiology & Public Health
American Journal of Epidemiology & Public Health
 
Lactancia 2014
Lactancia 2014Lactancia 2014
Lactancia 2014
 
Poster Final Final Draft
Poster Final Final DraftPoster Final Final Draft
Poster Final Final Draft
 
microbiome and breastmilk and breastfeeding and advantages and disadvantages ...
microbiome and breastmilk and breastfeeding and advantages and disadvantages ...microbiome and breastmilk and breastfeeding and advantages and disadvantages ...
microbiome and breastmilk and breastfeeding and advantages and disadvantages ...
 
Breakthrough of Human Milk Oligosaccharides
Breakthrough of Human Milk OligosaccharidesBreakthrough of Human Milk Oligosaccharides
Breakthrough of Human Milk Oligosaccharides
 
Bruno pot
Bruno pot Bruno pot
Bruno pot
 
Early total enteral feeding in stable preterm infants a systematic review and...
Early total enteral feeding in stable preterm infants a systematic review and...Early total enteral feeding in stable preterm infants a systematic review and...
Early total enteral feeding in stable preterm infants a systematic review and...
 
The relationship between trace mineral concentrations of amniotic fluid with ...
The relationship between trace mineral concentrations of amniotic fluid with ...The relationship between trace mineral concentrations of amniotic fluid with ...
The relationship between trace mineral concentrations of amniotic fluid with ...
 
1-s2.0-S2305050016300331-main
1-s2.0-S2305050016300331-main1-s2.0-S2305050016300331-main
1-s2.0-S2305050016300331-main
 

Kürzlich hochgeladen

Dyslexia AI Workshop for Slideshare.pptx
Dyslexia AI Workshop for Slideshare.pptxDyslexia AI Workshop for Slideshare.pptx
Dyslexia AI Workshop for Slideshare.pptxcallscotland1987
 
This PowerPoint helps students to consider the concept of infinity.
This PowerPoint helps students to consider the concept of infinity.This PowerPoint helps students to consider the concept of infinity.
This PowerPoint helps students to consider the concept of infinity.christianmathematics
 
Accessible Digital Futures project (20/03/2024)
Accessible Digital Futures project (20/03/2024)Accessible Digital Futures project (20/03/2024)
Accessible Digital Futures project (20/03/2024)Jisc
 
Unit-IV; Professional Sales Representative (PSR).pptx
Unit-IV; Professional Sales Representative (PSR).pptxUnit-IV; Professional Sales Representative (PSR).pptx
Unit-IV; Professional Sales Representative (PSR).pptxVishalSingh1417
 
2024-NATIONAL-LEARNING-CAMP-AND-OTHER.pptx
2024-NATIONAL-LEARNING-CAMP-AND-OTHER.pptx2024-NATIONAL-LEARNING-CAMP-AND-OTHER.pptx
2024-NATIONAL-LEARNING-CAMP-AND-OTHER.pptxMaritesTamaniVerdade
 
Basic Civil Engineering first year Notes- Chapter 4 Building.pptx
Basic Civil Engineering first year Notes- Chapter 4 Building.pptxBasic Civil Engineering first year Notes- Chapter 4 Building.pptx
Basic Civil Engineering first year Notes- Chapter 4 Building.pptxDenish Jangid
 
Unit-IV- Pharma. Marketing Channels.pptx
Unit-IV- Pharma. Marketing Channels.pptxUnit-IV- Pharma. Marketing Channels.pptx
Unit-IV- Pharma. Marketing Channels.pptxVishalSingh1417
 
Activity 01 - Artificial Culture (1).pdf
Activity 01 - Artificial Culture (1).pdfActivity 01 - Artificial Culture (1).pdf
Activity 01 - Artificial Culture (1).pdfciinovamais
 
Understanding Accommodations and Modifications
Understanding  Accommodations and ModificationsUnderstanding  Accommodations and Modifications
Understanding Accommodations and ModificationsMJDuyan
 
1029-Danh muc Sach Giao Khoa khoi 6.pdf
1029-Danh muc Sach Giao Khoa khoi  6.pdf1029-Danh muc Sach Giao Khoa khoi  6.pdf
1029-Danh muc Sach Giao Khoa khoi 6.pdfQucHHunhnh
 
How to Create and Manage Wizard in Odoo 17
How to Create and Manage Wizard in Odoo 17How to Create and Manage Wizard in Odoo 17
How to Create and Manage Wizard in Odoo 17Celine George
 
Unit-V; Pricing (Pharma Marketing Management).pptx
Unit-V; Pricing (Pharma Marketing Management).pptxUnit-V; Pricing (Pharma Marketing Management).pptx
Unit-V; Pricing (Pharma Marketing Management).pptxVishalSingh1417
 
Holdier Curriculum Vitae (April 2024).pdf
Holdier Curriculum Vitae (April 2024).pdfHoldier Curriculum Vitae (April 2024).pdf
Holdier Curriculum Vitae (April 2024).pdfagholdier
 
Google Gemini An AI Revolution in Education.pptx
Google Gemini An AI Revolution in Education.pptxGoogle Gemini An AI Revolution in Education.pptx
Google Gemini An AI Revolution in Education.pptxDr. Sarita Anand
 
Single or Multiple melodic lines structure
Single or Multiple melodic lines structureSingle or Multiple melodic lines structure
Single or Multiple melodic lines structuredhanjurrannsibayan2
 
Explore beautiful and ugly buildings. Mathematics helps us create beautiful d...
Explore beautiful and ugly buildings. Mathematics helps us create beautiful d...Explore beautiful and ugly buildings. Mathematics helps us create beautiful d...
Explore beautiful and ugly buildings. Mathematics helps us create beautiful d...christianmathematics
 
Kodo Millet PPT made by Ghanshyam bairwa college of Agriculture kumher bhara...
Kodo Millet  PPT made by Ghanshyam bairwa college of Agriculture kumher bhara...Kodo Millet  PPT made by Ghanshyam bairwa college of Agriculture kumher bhara...
Kodo Millet PPT made by Ghanshyam bairwa college of Agriculture kumher bhara...pradhanghanshyam7136
 
Towards a code of practice for AI in AT.pptx
Towards a code of practice for AI in AT.pptxTowards a code of practice for AI in AT.pptx
Towards a code of practice for AI in AT.pptxJisc
 
Fostering Friendships - Enhancing Social Bonds in the Classroom
Fostering Friendships - Enhancing Social Bonds  in the ClassroomFostering Friendships - Enhancing Social Bonds  in the Classroom
Fostering Friendships - Enhancing Social Bonds in the ClassroomPooky Knightsmith
 
ICT role in 21st century education and it's challenges.
ICT role in 21st century education and it's challenges.ICT role in 21st century education and it's challenges.
ICT role in 21st century education and it's challenges.MaryamAhmad92
 

Kürzlich hochgeladen (20)

Dyslexia AI Workshop for Slideshare.pptx
Dyslexia AI Workshop for Slideshare.pptxDyslexia AI Workshop for Slideshare.pptx
Dyslexia AI Workshop for Slideshare.pptx
 
This PowerPoint helps students to consider the concept of infinity.
This PowerPoint helps students to consider the concept of infinity.This PowerPoint helps students to consider the concept of infinity.
This PowerPoint helps students to consider the concept of infinity.
 
Accessible Digital Futures project (20/03/2024)
Accessible Digital Futures project (20/03/2024)Accessible Digital Futures project (20/03/2024)
Accessible Digital Futures project (20/03/2024)
 
Unit-IV; Professional Sales Representative (PSR).pptx
Unit-IV; Professional Sales Representative (PSR).pptxUnit-IV; Professional Sales Representative (PSR).pptx
Unit-IV; Professional Sales Representative (PSR).pptx
 
2024-NATIONAL-LEARNING-CAMP-AND-OTHER.pptx
2024-NATIONAL-LEARNING-CAMP-AND-OTHER.pptx2024-NATIONAL-LEARNING-CAMP-AND-OTHER.pptx
2024-NATIONAL-LEARNING-CAMP-AND-OTHER.pptx
 
Basic Civil Engineering first year Notes- Chapter 4 Building.pptx
Basic Civil Engineering first year Notes- Chapter 4 Building.pptxBasic Civil Engineering first year Notes- Chapter 4 Building.pptx
Basic Civil Engineering first year Notes- Chapter 4 Building.pptx
 
Unit-IV- Pharma. Marketing Channels.pptx
Unit-IV- Pharma. Marketing Channels.pptxUnit-IV- Pharma. Marketing Channels.pptx
Unit-IV- Pharma. Marketing Channels.pptx
 
Activity 01 - Artificial Culture (1).pdf
Activity 01 - Artificial Culture (1).pdfActivity 01 - Artificial Culture (1).pdf
Activity 01 - Artificial Culture (1).pdf
 
Understanding Accommodations and Modifications
Understanding  Accommodations and ModificationsUnderstanding  Accommodations and Modifications
Understanding Accommodations and Modifications
 
1029-Danh muc Sach Giao Khoa khoi 6.pdf
1029-Danh muc Sach Giao Khoa khoi  6.pdf1029-Danh muc Sach Giao Khoa khoi  6.pdf
1029-Danh muc Sach Giao Khoa khoi 6.pdf
 
How to Create and Manage Wizard in Odoo 17
How to Create and Manage Wizard in Odoo 17How to Create and Manage Wizard in Odoo 17
How to Create and Manage Wizard in Odoo 17
 
Unit-V; Pricing (Pharma Marketing Management).pptx
Unit-V; Pricing (Pharma Marketing Management).pptxUnit-V; Pricing (Pharma Marketing Management).pptx
Unit-V; Pricing (Pharma Marketing Management).pptx
 
Holdier Curriculum Vitae (April 2024).pdf
Holdier Curriculum Vitae (April 2024).pdfHoldier Curriculum Vitae (April 2024).pdf
Holdier Curriculum Vitae (April 2024).pdf
 
Google Gemini An AI Revolution in Education.pptx
Google Gemini An AI Revolution in Education.pptxGoogle Gemini An AI Revolution in Education.pptx
Google Gemini An AI Revolution in Education.pptx
 
Single or Multiple melodic lines structure
Single or Multiple melodic lines structureSingle or Multiple melodic lines structure
Single or Multiple melodic lines structure
 
Explore beautiful and ugly buildings. Mathematics helps us create beautiful d...
Explore beautiful and ugly buildings. Mathematics helps us create beautiful d...Explore beautiful and ugly buildings. Mathematics helps us create beautiful d...
Explore beautiful and ugly buildings. Mathematics helps us create beautiful d...
 
Kodo Millet PPT made by Ghanshyam bairwa college of Agriculture kumher bhara...
Kodo Millet  PPT made by Ghanshyam bairwa college of Agriculture kumher bhara...Kodo Millet  PPT made by Ghanshyam bairwa college of Agriculture kumher bhara...
Kodo Millet PPT made by Ghanshyam bairwa college of Agriculture kumher bhara...
 
Towards a code of practice for AI in AT.pptx
Towards a code of practice for AI in AT.pptxTowards a code of practice for AI in AT.pptx
Towards a code of practice for AI in AT.pptx
 
Fostering Friendships - Enhancing Social Bonds in the Classroom
Fostering Friendships - Enhancing Social Bonds  in the ClassroomFostering Friendships - Enhancing Social Bonds  in the Classroom
Fostering Friendships - Enhancing Social Bonds in the Classroom
 
ICT role in 21st century education and it's challenges.
ICT role in 21st century education and it's challenges.ICT role in 21st century education and it's challenges.
ICT role in 21st century education and it's challenges.
 

Composition and Variation of the Human Milk Microbiota Are Influenced by Maternal and Early-Life Factors

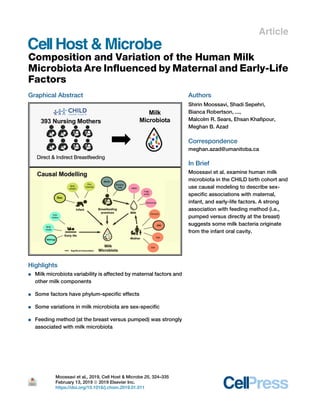
  • 1. Article Composition and Variation of the Human Milk Microbiota Are Influenced by Maternal and Early-Life Factors Graphical Abstract Highlights d Milk microbiota variability is affected by maternal factors and other milk components d Some factors have phylum-specific effects d Some variations in milk microbiota are sex-specific d Feeding method (at the breast versus pumped) was strongly associated with milk microbiota Authors Shirin Moossavi, Shadi Sepehri, Bianca Robertson, ..., Malcolm R. Sears, Ehsan Khafipour, Meghan B. Azad Correspondence meghan.azad@umanitoba.ca In Brief Moossavi et al. examine human milk microbiota in the CHILD birth cohort and use causal modeling to describe sex- specific associations with maternal, infant, and early-life factors. A strong association with feeding method (i.e., pumped versus directly at the breast) suggests some milk bacteria originate from the infant oral cavity. Moossavi et al., 2019, Cell Host & Microbe 25, 324–335 February 13, 2019 ª 2019 Elsevier Inc. https://doi.org/10.1016/j.chom.2019.01.011
  • 2. Cell Host & Microbe Article Composition and Variation of the Human Milk Microbiota Are Influenced by Maternal and Early-Life Factors Shirin Moossavi,1,2,3,4 Shadi Sepehri,2 Bianca Robertson,5 Lars Bode,5,6 Sue Goruk,7 Catherine J. Field,7 Lisa M. Lix,8 Russell J. de Souza,9,10,11 Allan B. Becker,2,3 Piushkumar J. Mandhane,12 Stuart E. Turvey,13 Padmaja Subbarao,14,15 Theo J. Moraes,14 Diana L. Lefebvre,16 Malcolm R. Sears,16 Ehsan Khafipour,2,17 and Meghan B. Azad2,3,18,* 1Medical Microbiology and Infectious Diseases, University of Manitoba, Winnipeg, MB, Canada 2Children’s Hospital Research Institute of Manitoba, Pediatrics and Child Health, Winnipeg, MB, Canada 3Developmental Origins of Chronic Diseases in Children Network (DEVOTION), Winnipeg, MB, Canada 4Digestive Oncology Research Center, Digestive Disease Research Institute, Tehran University of Medical Sciences, Tehran, Iran 5Pediatrics, University of California, San Diego, La Jolla, CA, USA 6Larsson-Rosenquist Foundation Mother-Milk-Infant Center of Research Excellence, University of California, San Diego, La Jolla, CA, USA 7Agricultural Food, and Nutritional Science, University of Alberta, Edmonton, AB, Canada 8Community Health Sciences, University of Manitoba, Winnipeg, MB, Canada 9Clinical Epidemiology and Biostatistics, McMaster University, Hamilton, ON, Canada 10Nutritional Sciences, University of Toronto, Toronto, ON, Canada 11Li Ka Shing Knowledge Institute, St. Michael’s Hospital, Toronto, ON, Canada 12Pediatrics, University of Alberta, Edmonton, AB, Canada 13Pediatrics, University of British Columbia, Vancouver, BC, Canada 14Division of Respiratory Medicine, Pediatrics, Hospital for Sick Children, University of Toronto, Toronto, ON, Canada 15Physiology, University of Toronto, Toronto, ON, Canada 16Medicine, McMaster University, Hamilton, ON, Canada 17Animal Science, University of Manitoba, Winnipeg, MB, Canada 18Lead Contact *Correspondence: meghan.azad@umanitoba.ca https://doi.org/10.1016/j.chom.2019.01.011 SUMMARY Breastmilk contains a complex community of bacte- ria that may help seed the infant gut microbiota. The composition and determinants of milk microbiota are poorly understood. Among 393 mother-infant dyads from the CHILD cohort, we found that milk micro- biota at 3–4 months postpartum was dominated by inversely correlated Proteobacteria and Firmicutes, and exhibited discrete compositional patterns. Milk microbiota composition and diversity were associ- ated with maternal factors (BMI, parity, and mode of delivery), breastfeeding practices, and other milk components in a sex-specific manner. Causal modeling identified mode of breastfeeding as a key determinant of milk microbiota composition. Specif- ically, providing pumped breastmilk was consistently associated with multiple microbiota parameters including enrichment of potential pathogens and depletion of bifidobacteria. Further, these data sup- port the retrograde inoculation hypothesis, whereby the infant oral cavity impacts the milk microbiota. Collectively, these results identify features and de- terminants of human milk microbiota composition, with potential implications for infant health and development. INTRODUCTION Although previously considered sterile, breastmilk is now known to contain a complex community of bacteria that helps establish the infant gut microbiota (Parigi et al., 2015). If this process is disrupted, the infant may develop a dysbiotic micro- biota, causing predisposition to chronic diseases such as allergy, asthma, and obesity (Gomez-Gallego et al., 2016). Recent studies on human milk microbiota suggest that it might be affected by local pathologies of the breast, mode of delivery, antibiotics, maternal health, and gestational age (Bode et al., 2014). However, these findings have not been reproduced in large-scale studies, and the determinants of milk microbiota are still mostly unknown. Two main pathways have been proposed to explain the origin of milk microbiota: entero-mammary translocation of the maternal gut microbiota and retrograde inoculation by the in- fant’s oral microbiota (McGuire and McGuire, 2017). The fact that colostrum collected even before the first infant feeding already contains a microbial community (Damaceno et al., 2017) supports the entero-mammary pathway, while the similar- ity of infant oral microbiota to breastmilk microbiota (Bisanz et al., 2015) supports the retrograde pathway. It is plausible that both pathways are contributing to the bacterial content of human milk. Depending on the source of bacteria, different factors could contribute to shaping the milk microbiota. Factors influencing the mother’s gut microbiota such as obesity (Collado et al., 324 Cell Host & Microbe 25, 324–335, February 13, 2019 ª 2019 Elsevier Inc.
  • 3. 2008) or diet (Wu et al., 2011) could affect the bacteria originating from the maternal gut, while factors influencing the infant’s mi- crobiota (Laforest-Lapointe and Arrieta, 2017) such as mode of delivery, older siblings, complementary feeding, and mode of breastfeeding (directly at the breast versus pumped and bottled breastmilk) could potentially alter the bacteria derived from the infant’s oral cavity. Other milk components such as human milk oligosaccharides (HMOs), milk fatty acids, hormones, im- mune cells, and antibodies could also modulate the milk ‘‘micro- environment’’ and create a niche constraint affecting composi- tion of the microbial community. Additionally, factors that could impact the overall milk composition such as circadian rhythm (Nozad et al., 2012) and lactation stage could indirectly affect the milk microbial community. Studies addressing these potential determinants of milk mi- crobiota have been limited by small sample size, low sequencing depth, and lack of control for confounding factors. The objective of this study was to profile the milk microbiota in a large sample of healthy mother-infant dyads and examine the association of maternal, infant, early-life, and milk factors with milk microbiota composition. RESULTS We studied a representative subset of 393 breastfeeding dyads from the CHILD birth cohort (Table S1). The majority were Caucasian (74%), about half (54%) were primiparous, and a quarter (24%) delivered by Cesarean section. The mean ± SD duration of any breastfeeding was 13 ± 6 months and the mean lactation stage at sample collection was 17 ± 5 weeks. We obtained a mean of 47,710 ± 18,643 high-quality sequencing reads per sample, compared with 46,770 ± 13,479 reads from the mock community and 627 ± 1,034 reads in sequencing negative controls. Profiles were significantly different by sample type, but not by sequencing runs or PCR re- actions (Figure S1A). Sequencing contaminants (n = 173 from 9,884 total amplicon sequence variants [ASVs]) were identified and removed using the decontam package (Davis et al., 2018); this did not measurably affect sequencing depth (Figure S1B) or microbiota structure (Figure S1C). We observed strong con- sistency between the observed and expected composition of the mock community (Figure S1D). Milk Microbiota Is Dominated by Inversely Correlated Proteobacteria and Firmicutes with High Inter-individual Variability Following removal of rare taxa with <20 reads in total (Fig- ure S1E), 18 unique phyla comprising 1,972 ASVs were detected, with the majority of taxa detected belonging to Proteobacteria (mean ± SD relative abundance: 67% ± 24%, range 3%–99%), Firmicutes (26% ± 22%, range 0.1%–91%), Actinobacteria (4% ± 4%, range 0%–61%), and Bacteroidetes (1% ± 3%, range 0%–44%) (Figure 1A). Proteobacteria and Firmicutes relative abundances were inversely correlated (Pearson r = À0.97, p < 0.001). At the genus level (Table S2), the most abundant taxa were Streptococcus (16% ± 17%), Ralstonia (5% ± 3%), and Staphylococcus (5% ± 11%). We defined core milk microbiota as ASVs present in at least 95% of individuals with minimum 1% mean relative abundance (Astudillo-Garcı´a et al., 2017; Shade and Handelsman, 2012). Overall, 12 core ASVs were identified (Table S3); the five most abundant belonged to unclassified Burkholderiales (6% ± 3%), Staphylococcus (5% ± 12%), Ralstonia (5% ± 3%), unclassified Comamonada- ceae (4% ± 3%), and Acidovorax (4% ± 2%). These and other core ASVs were present in 100% of samples compared to 0%–20% of sequencing negative controls (Table S3). Milk Microbiota Profiles Exhibit Discrete Compositional Patterns To identify potential inherent patterns in the milk microbiota, hierarchical clustering was performed on the core microbiota (Figure 1B). Four clusters (C1–C4) were identified (Tibshirani et al., 2001) (Figure S2) and were predominantly separated based on the relative abundances of Moraxellaceae, Enterobac- teriaceae, and Pseudomonadaceae (enriched in C1, n = 42); Streptococcaceae, Staphylococcaceae, and Oxalobacteraceae (C2, n = 98); Oxalobacteriaceae and Comamonadaceae (C3, n = 161); and Streptococcaceae and Comamonadaceae (C4, n = 92) (Figure 1C; Table S4). C1 and C2 had the lowest a diversity, while C3 was the most diverse (Figure 1D). Clusters were well separated on PCoA plots of the core (Figure 1E) and overall (>0.01% mean relative abundance; Figure S2C) milk mi- crobiota. C1 and C2 had higher heterogeneity compared to C3 and C4 (Figure S2B), suggesting they may be more enriched with exogenously derived bacteria from maternal skin or breast pump microbiota. Indeed, the majority of mothers in C1 (86%) fed their infants pumped milk (indirect breastfeeding), compared to 66%, 53%, and 48% in C2, C3, and C4, respectively (Table S5; Figure 1F). C1 also had the highest rate of pump versus manual expression (94%, compared to 78%–83% in the other clusters) (Table S5). Milk Microbiota Diversity Is Associated with Mode of Breastfeeding, Method of Milk Expression, and Other Maternal Factors Overall, milk samples had a mean ± SD richness (observed ASVs) of 147 ± 44 and diversity (inverse Simpson index) of 15.8 ± 8.7. We explored the association of a diversity with multiple maternal and infant factors (Tables 1 and S6). In multi- variable linear regression adjusting for infant sex, mode of feeding, mode of delivery, and parity (number of older sib- lings), indirect breastfeeding was independently associated with lower milk bacterial richness (adjusted bb–18.9, 95% CI, À27.9, À9.9, p < 0.001) and diversity (adjusted bbÀ2.08, 95% CI, À3.91, À0.25, p < 0.05; Table 1). In a subset with data on milk expression method, pump versus manual expres- sion was associated with significantly lower bacterial richness (bb = À39.6, 95% CI, À60.5, À18.7, p < 0.001). Within the range of lactation that we studied (17 ± 5 weeks), we did not detect significant associations of lactation stage with a diversity. In addition, we found no association between overall a diversity and mode of delivery, maternal ethnicity, history of atopy, smoking, BMI, secretor status, HMO diver- sity, or total HMO concentration (Table S6). There were some notable differences when examining within-phylum a di- versity (Figure 2). For example, while maternal BMI was not associated with overall a diversity, it was inversely associated with Proteobacteria diversity and positively associated with Cell Host & Microbe 25, 324–335, February 13, 2019 325
  • 4. Firmicutes diversity. Maternal atopy and multiparity were associated with higher Actinobacteria richness. Milk Microbiota Composition Is Associated with Breastfeeding Practices, Multiparity, and Other Maternal Factors in a Sex-Specific Manner To identify factors associated with milk microbiota composition, we first examined the relative abundance of taxa at species and genus levels. Among the many factors examined, only mode of breastfeeding was associated with differential relative abundance for a few individual taxa (Figure 5D). Gemellaceae, Vogesella, and Nocardioides had higher relative abundances with direct breastfeeding whereas Enterobacteriaceae and Pseudomonas were relatively more abundant with indirect breastfeeding. No associations were observed between individ- ual taxa and other factors examined, including maternal secretor status, ethnicity, atopy, parity, mode of delivery, or intrapartum antibiotics (data not shown). Next, we assessed associations with core milk microbiota cluster membership (Figure 1F; Table S5). Clusters C3 and C4 had lower frequency of indirect breastfeeding compared to clus- ters C1 and C2 while exclusive breastfeeding and primaparity were more frequent in cluster C1 (Table S5). Maternal age, atopy, infant birth weight, gestational age, and intrapartum antibiotics were not associated with cluster membership (data not shown). Next, we explored the association of each factor with the entire microbiota composition using redundancy analysis (RDA; Figure 3). Consistent with the cluster analyses, breast- feeding mode (p = 0.001) was significantly associated with the overall composition. Several additional factors including B EDC A F Figure 1. Milk Microbiota Profiles Are Highly Variable between Women, and Exhibit Discrete Compositional Patterns (A) Milk microbiota profile at phylum level across samples. (B) Hierarchical clustering of the core milk ASVs defined as present in at least 95% of samples with minimum 1% mean relative abundance; see also Figure S2. (C) Relative abundance of dominant bacterial families in different clusters; see also Table S5. (D) Comparison of a diversity between clusters *p < 0.05, **p < 0.001; NS, not significant. (E) Comparison of b diversity between clusters using PERMANOVA. (F) Prevalence of mode of breastfeeding, infant sex, mode of delivery (C/S, cesarean section; NVD, normal vaginal delivery), and parity in different clusters. 326 Cell Host & Microbe 25, 324–335, February 13, 2019
  • 5. exclusive breastfeeding, lactation stage, parity, maternal BMI, ethnicity, and infant sex were significantly associated with the milk microbiota composition, albeit with very low redundancy values (each accounting for <1% of the variation in the milk microbiota). The fact that these factors were associated with overall microbiota composition, but not with cluster member- ship, suggests their influence on the non-core (inter-individual variable) component of the milk microbiota. There was a trend toward association of HMO composition with milk microbiota (R2 = 0.055, p = 0.074) (Figure 3). A multivariable RDA including mode of breastfeeding and lactation stage accounted for 2.2% of variation in the milk microbiota (p = 0.001) while additional inclusion of HMO composition increased the total variation explained to 7.3% (p = 0.001). Interestingly, the amount of variation explained was considerably higher when RDA models were stratified by infant sex (male, 13.3%, p = 0.005; female, 11.6%, p = 0.17). Sex specificity was also observed for univariate RDA associa- tions for mode of breastfeeding and lactation stage (higher R2 in males), as well as parity, mode of delivery, and maternal BMI (significant in females only) in stratified analyses. The com- bined contribution of all the factors accounted for 35.5% of vari- ation in males (p = 0.001) and 34.1% in female infants (p = 0.079) (Figure 3). Table 1. Factors Associated with Milk Microbiota a Diversity Factor n (%) Richness: Observed OTUs Diversity: Inverse Simpson Univariatea Model 1b Univariatea Model 1b Model 2c Richness (Mean ± SD) Crude b (95% CI) Adjusted b (95% CI) Diversity (Mean ± SD) Crude b (95% CI) Adjusted b (95% CI) Adjusted b (95% CI) Breastfeeding Mode All direct 162 (41.9) 157.8 ± 37.0 Ref. Ref. 17.1 ± 8.2 Ref. Ref. Ref. Some indirect 225 (58.1) 138.7 ± 46.9 À19.1 (À27.8, À10.4)f À18.7 (À27.7, À9.64)f 14.9 ± 9.2 - 2.2 (À3.9, À0.36)e À2.04 (À3.88, À0.20)e À2.20 (À4.01, À0.40)e Milk Expressiond Manual 20 (18.8) 170.1 ± 40.0 Ref. – 15.8 ± 7.9 Ref. – – Pump 91 (81.2) 130.5 ± 43.2 À39.6 (À60.5, À18.7)f 13.8 ± 9.0 À2.08 (À6.40, 2.25) Mode of Delivery Vaginal 294 (76.0) 148.5 ± 43.9 Ref. Ref. 16.3 ± 8.8 Ref. Ref. Ref. C/S emergency 47 (12.1) 133.5 ± 47.3 À14.9 (À28.5, À1.5)e À11.3 (À25.0, 2.5) 14.5 ± 9.2 À1.74 (À4.46, 0.99) À1.02 (À3.81, 1.78) À1.29 (À4.01, 1.44) C/S elective 46 (11.9) 151.1 ± 39.0 2.6 (À11.0, 16.3) 2.5 (À11.2, 16.1) 14.2 ± 8.6 À2.09 (À4.84, 0.67) À2.03 (À4.81, 0.76) À1.89 (À4.65, 0.88) Infant Sex Female 192 (48.9) 151.0 ± 43.3 Ref. Ref. 16.7 ± 8.8 Ref. Ref. Ref. Male 201 (51.1) 142.8 ± 43.9 À8.2 (À16.9, 0.4) À7.3 (À16.0, 1.4) 14.9 ± 8.9 À1.81 (À3.56, À0.06)e À1.65 (À3.43, 0.12) À1.62 (À3.39, 0.15) Older Siblings No 211 (53.7) 143.7 ± 47.5 Ref. Ref. 15.2 ± 9.1 Ref. Ref. – One 126 (32.1) 147.1 ± 39.7 3.4 (À6.3, 13.0) À2.2 (À12.3, 7.8) 16.4 ± 8.6 1.22 (À0.74, 3.18) 0.68 (À1.37, 2.73) Two or more 56 (14.2) 157.7 ± 35.8 13.9 (1.1, 26.8)e 7.5 (À6.0, 20.9) 16.7 ± 8.5 1.47 (À1.15, 4.08) 1.11 (À1.64, 3.85) N = 393 dyads from the CHILD cohort. Data are presented as mean ± SD. BMI, body mass index; C/S, Caesarean section. a All factors showing an association (p < 0.05) on univariate analysis are shown. For other factors examined without significant associations, see Table S6: maternal BMI, lactation stage (interquartile range 14–19 weeks), maternal age, maternal atopy, maternal secretor status (defined based on the presence or absence of 20 -FL or LNFP HMOs), maternal prenatal smoking, maternal ethnicity, milk fatty acids PC1, HMO diversity, and total HMO concentration. b Linear regression adjusted for breastfeeding mode, infant sex, mode of delivery, older siblings, and sample processing time; N = 381. c Linear regression adjusted for breastfeeding mode, infant sex, mode of delivery, and sample processing time; N = 381. d n = 111. Method of milk expression was not systematically captured but was analyzed for samples where it was noted. e p < 0.05. f p < 0.001. Cell Host & Microbe 25, 324–335, February 13, 2019 327
  • 6. Structural Equation Modeling Identifies Mode of Breastfeeding as a Key Determinant of Milk Microbiota, and Defines Other Causal Pathways Influencing Milk Composition None of the results above account for the theoretical framework of causal pathways by which different factors could affect milk mi- crobiota (Figure 4A) We performed confirmatory factor analysis (CFA) (Kline, 2016), a variant of structural equation modeling (SEM), to evaluate and compare different plausible frameworks (Figures 4B and S3). We modeled the milk environment as a latent (unobserved) construct with HMOs, fatty acids, insulin, and leptin as indicators. Our variable selection in the CFA was guided by the current literature on proposed mechanisms of mammary gland colonization. Variables potentially important for the retrograde pathway are mode of delivery, infant sex, and older siblings (factors shaping the infant microbiota), as well as mode of breast- feeding (because indirect feeding eliminates contact with the in- fant oral cavity). Variables potentially important for the entero- mammary route include maternal BMI and dietary pattern, which could be correlated with the maternal gut microbiota. In our final model, breastfeeding mode was directly associated with milk microbiota with b coefficient of 0.19 (p < 0.001) (Figure 4). There was a trend in the direct association of infant sex with milk microbiota (b = 0.09, p = 0.072), whereas no association Inverse Simpson Index coefficient ** * Observed ASVs * ** * * * * ** * * * * * * ** Infant Sex (Male vs. Female) Fatty Acids (%) PC1 Some Indirect Breastfeeding Lactation Stage (per week) Two Older Siblings (vs. none) One Older Sibling (vs. none) Elective C/S (vs. Vaginal) Emergency C/S (vs. Vaginal) Prenatal Smoking Maternal Atopy Other (vs. Caucasian) First Nations (vs. Caucasian) Asian (vs. Caucasian) Maternall Overweight/Obesity Maternal Age (per year) Observed ASVs Inverse Simpson Index ** * Proteobacteria Proteobacteria Firmicutes Actinobacteria Firmicutes Actinobacteria Figure 2. Factors Associated with Milk Mi- crobiota Within-Phylum a Diversity b coefficients of univariate associations with linear regression are visualized for observed ASVs and inverse Simpson index for major milk microbiota phyla. *p < 0.05, **p < 0.001.C/S, Ceasarean section. was detected for birth mode or maternal BMI (b < 0.10, p > 0.05). Maternal diet influenced maternal BMI, and BMI was significantly associated with the milk envi- ronment latent construct. Overall, we did not detect a significant association be- tween the milk environment and the milk microbiota (b = À0.049, p = 0.45) (Figures 4, S3A, and S3B). We assessed other plausible causal pathways in equivalent models (Figure S3; Table S7). For example, we removed the indirect effect of BMI on milk microbiota mediated by the milk environment (Fig- ure S3C); however, the model was not a good fit, suggesting that BMI both directly and indirectly affects the milk microbiota. Furthermore, we observed that the effect of mode of breastfeeding on the milk microbiota was not mediated via the milk environment (Figure S3D). We also incorporated some known associa- tions such as the direct effect of diet on milk fatty acids (Figure S3E) and potential direct effect of HMOs on milk microbiota (Figure S3F). Controlling for these addi- tional associations, mode of breastfeed- ing was the only consistent factor directly associated with the milk microbiota composition. Overall, the CFA suggests that (1) mode of breastfeeding directly influences the milk microbiota, and (2) maternal diet influences BMI, which affects non-bacterial milk components that do not directly influence milk microbiota. Indirect Breastfeeding Is Associated with Enrichment of Potential Pathogens and Depletion of Bifidobacteria in Milk Microbiota Given the consistent association of breastfeeding mode with different milk microbiota measures using different analytical ap- proaches (above), we conducted further analyses to explore this relationship (Figure 5). Indirect breastfeeding was associated with lower a (within sample) diversity and higher b (between sam- ple) diversity (Figures 5A–5C). Using a standard ANOVA test, several taxa were differentially abundant based on mode of breastfeeding. Enterobacteriaceae and Enterococcaceae were more abundant with indirect breastfeeding while Gemellaceae and Vogesella were enriched with direct breastfeeding (FDR p < 0.05). Notably, although Enterobacteriaceae was present in 70% of samples regardless of the mode of breastfeeding, it had a 5-fold lower mean relative abundance in direct versus indirect breastfeeding (1.1% ± 3.5% versus 5.0% ± 13.5%, p = 0.002). Linear discriminant analysis (Segata et al., 2011) (Figure 5D) 328 Cell Host & Microbe 25, 324–335, February 13, 2019
  • 7. identified several discriminant taxa that were not differentially abundant in conventional analysis. For example, members of the Actinobacteria phylum and Veillonellaceae (a member of oral microbiota) were enriched with direct breastfeeding while Stenotrophomonas and Pseudomonadaceae (potential opportu- nistic pathogens) were enriched with indirect breastfeeding (Fig- ure 5D), further suggesting that direct breastfeeding facilitates acquisition of oral microbiota while indirect breastfeeding leads to enrichment by environmental (pump-associated) bacteria. We next examined association of mode of breastfeeding with Bifidobacterium spp. as they constitute the majority of shared taxa between mother’s milk and infant stool (Biagi et al., 2017). We identified Bifidobacterium bifidum and B. animalis, as well as two unclassified Bifidobacterium spp., in the milk microbiota Figure 5. The most prevalent Bifidobacterium spp. in breastmilk was present in 48% of direct versus 30% of indirect breastfeed- ing (p < 0.001) (Figure 5E). To assess whether associations with breastfeeding mode were related to the method of milk sample collection, we per- formed a sensitivity analysis among samples with available infor- mation on method of milk collection (n = 111; Figure S4). Overall, pumping versus manual expression was associated with lower milk microbiota richness (Table 1). Stratified analyses showed that richness was significantly lower with indirect breastfeeding regardless of the method of sample collection (Figure S4A), sug- gesting that feeding mode and collection mode independently influence milk microbiota composition. DISCUSSION Using multiple analytic approaches to study the human milk mi- crobiota in a general population cohort, we provide evidence Analysis All Dyads (n=393) Male (n=201) Female (n=192) Variables R2 p R2 p R2 p Univariable Maternal BMI 0.43 * 0.54 1.02 * Maternal secretor status 0.38 ~ 0.62 0.61 Mode of delivery 0.62 0.73 1.71 * Number of older siblings 0.84 * 1.08 1.53 * Child antibiotics at sample collection 0.25 0.80 ~ 0.67 Mother antibiotics at sample collection 0.21 0.70 0.51 Lactation stage 0.59 ** 0.84 ~ 0.60 Mode of breastfeeding (BF) 1.34 *** 2.17 *** 0.97 * Exclusive breastfeeding 0.93 *** 1.38 ** 0.87 * Total HMO concentration 0.31 0.50 0.60 HMO compositional profile 5.50 ~ 10.40 10.50 Milk insulin 0.32 0.69 0.50 Milk leptin 0.28 0.42 0.63 Milk fatty acid profile 7.80 15.50 15.50 Multivariable Model 1 Mode of BF, older siblings, total HMO 2.27 *** 3.63 *** 2.89 * Model 2 Mode of BF, lactation stage 2.15 *** 3.58 *** 1.55 * Model 3 Mode of BF, lactation stage, HMO profile 7.29 *** 13.25 ** 11.57 Model 4 All factors in table 18.19 ** 35.47 *** 34.11 ~ Figure 3. Redundancy Analysis of Associa- tions of Maternal and Infant Factors with Overall Milk Microbiota Composition among 393 Dyads in the CHILD Cohort Redundancy values (R2 ) indicate the percent (%) variation explained by each individual factor (in univariate analyses) or each multivariable model. Shading reflects magnitude of R2 . Maternal age, history of atopy, infant birth weight, gestational age, and intrapartum antibiotics were not signifi- cantly associated with milk microbiota composi- tion in RDA and are not shown. BMI, body mass index; HMO, human milk oligosaccharide. $p < 0.10, *p < 0.05, **p < 0.01, ***p < 0.001. that its composition and diversity are influenced by maternal factors, early life events, breastfeeding practices, and other milk components. To our knowl- edge, this is among the largest studies of human milk microbiota performed to date, and it is the only study to apply a multivariable causal modeling approach. We identified four main clusters within the milk microbiota and found that mode of breastfeeding was significantly associated with milk microbiota compo- sition. Some additional factors (e.g., maternal BMI and parity) were associated with microbiota composition in a sex-specific manner, while others (e.g., maternal atopy and smoking) were associated with microbiota diversity in a phylum-specific manner. We also uniquely integrated other milk components (e.g., HMOs and fatty acids) in our analyses. Together, these results considerably expand upon existing knowledge about milk microbiota, providing evidence for the importance of breastfeeding practices, maternal factors, and potential sex differences in the pathways determining milk microbiota composition. Milk Microbiota Clusters Reflect Different Sources of Exogenous Milk Bacteria Dominant milk bacteria in our cohort were in accordance with previously published results (McGuire and McGuire, 2017). Also in agreement with previous reports (Bode et al., 2014), milk microbiota demonstrated a high degree of inter-individual variability with only a minority of taxa shared across the study population. Though we acknowledge that discrete clusters might not exist within the milk microbiota (Knights et al., 2014), we used hierarchical clustering to identify inherent patterns in the milk microbial community, finding four main clusters. While C1 was dominated by Enterobacteriaceae, Moraxellaceae, and Pseudomonadaceae, C2 had the highest relative abundances of Streptococcaceae and Staphylococcaceae as well as low abundance of potential reagent contaminants. Given the decreasing proportions of indirect breastfeeding as well as pump-expressed milk from C1 to C2, it is plausible that the clusters, at least partially, reflect a gradient of infant oral versus environmental (e.g., breast pump apparatus biofilm) sources of exogenous milk bacteria (Jime´ nez et al., 2017). In a previous Cell Host & Microbe 25, 324–335, February 13, 2019 329
  • 8. report, three clusters were identified in the milk microbiota of Chinese women with dominance of Streptococcaceae, Staphy- lococcaceae, and Pseudomonadaceae defining the three clus- ters (Li et al., 2017). Differences in the cluster-dominating spe- cies compared to our study could be the consequence of different clustering methods, inclusion criteria (e.g., restriction to ‘‘core’’ taxa in our study), prevalence of key exposure vari- ables (e.g., indirect breastfeeding), milk collection methods (e.g., aseptic protocol with electric pump in the Chinese study), or geographic variations in the milk microbiota. Further research is warranted to explore the existence and biological relevance of compositional patterns in milk microbiota. Support for the Exogenous Sources of Milk Colonization Our study contributes evidence to the ongoing debate regarding the origins of milk microbiota. Two main pathways have been proposed to explain the origin of milk microbiota: en- tero-mammary translocation of the maternal gut microbiota and retrograde inoculation by the infant’s oral microbiota. While it has been hypothesized that the mammary gland may be colonized by a complex microbial community, it has also been suggested that milk microbiota is merely the result of contami- nation at multiple steps of collection, processing, and storage (Rainard, 2017). Identification of microbial communities within BMIMicro- biota Milk Envir. Fatty Acids Leptin HMOInsulin BF Mode Infant Sex Birth Mode Diet PC1 Diet PC2 ** ****** ** ** ** Milk environment HMOs Lipids Cytokines etc. Milk microbiota Maternal factors BMI Age Ethnicity Diet Breastfeeding factors Mode Exclusivity Time to the last feed Maternal Gut microbiota Early life factors Mode of delivery Antibiotics Older siblings Infant factors Sex Birth weight A B Figure 4. Theoretical Framework and Causal Modeling of Maternal and Infant Factors Influencing the Milk Microbiota (A) Theoretical framework of how different factors are associated with milk microbiota composition. Maternal factors are more likely to indirectly in- fluence the milk microbiota via modulating other milk components or the maternal gut microbiota, while early-life and infant factors could more directly shape the milk microbiota by influencing the infant oral microbiota. (B) Mode of breastfeeding is significantly associ- ated with the milk microbiota in structural equation modeling. Standardized b coefficients are re- ported. BMI, maternal body mass index; CFI, comparative fix index; CI, confidence interval; RSMEA, root-mean-square error of approxima- tion; SRMR, standardized root-mean residuals; *p < 0.05, **p < 0.01. Green, positive; red, nega- tive. See also Figure S3 and Table S7. the breast tissue of non-lactating women suggests that the mammary gland is indeed colonized (Urbaniak et al., 2014), and recent data confirm that bac- teria are present in human milk collected under aseptic conditions (Sakwinska et al., 2016). However, the same study found a higher abundance and different composition of microbiota in milk collected using a non-aseptic protocol, indicating a substantial contribution from skin microbiota or other externally acquired bacteria. The ‘‘retrograde inoc- ulation’’ hypothesis is also supported by the observation that bacterial load gradually decreases over the course of each feed (West et al., 1979). Our study provides intriguing evidence to further support the retrograde hypothesis, showing that indirect breastfeeding (defined as at least one serving of pumped milk in the preced- ing 2 weeks) was significantly associated with milk microbiota diversity and composition. This striking association was consistently replicated using different analytical methods (multivariable regression, redundancy analysis, discriminant analysis, and structural equation modeling), providing confi- dence that these observed associations could be causal. Our results suggest that both the act of pumping and the lack of contact with the infant oral cavity may independently influence the milk microbiota, although we cannot definitively distinguish between these related factors, nor identify the sources of the exogenously derived bacteria in the expressed breast milk. Nevertheless, based on lower richness associated with indirect versus direct breastfeeding in both manually ex- pressed and pumped milk samples, we speculate that expo- sure to the infant oral cavity has a persistent impact on shaping the milk microbiota community. Further research is needed to characterize this ‘‘retrograde inoculation’’ process, and to explore the possible impact of pumping on the micro- biota of expressed milk. 330 Cell Host & Microbe 25, 324–335, February 13, 2019
  • 9. Mechanistic Explanation for a Clinical Observation Our current findings on indirect breastfeeding also suggest a possible explanation for our recent observation that infants fed pumped milk are at increased risk for pediatric asthma compared to those fed exclusively at the breast (Klopp et al., 2017). In the current study of milk microbiota, we found that one Bifidobacte- rium spp. existed in milk at relatively high prevalence and was significantly depleted with indirect breastfeeding. This could have important implications for infant immune development and asthma risk because Bifidobacterium spp. constitute the majority of shared taxa between mother’s milk and infant stool (Biagi et al., 2017), which is typically dominated by Bifidobacterium spp. (Asnicar et al., 2017; Biagi et al., 2017). Gut microbiota is crucial in the development and education of the infant immune system (Li et al., 2014), and disruption of gut microbiota in the first few months of life is associated with atopy and asthma later in child- hood (Azad et al., 2015; Bridgman et al., 2016). We acknowledge that bifidobacteria may be underrepresented in our study due to known biases against detecting this species using 16S rRNA gene sequencing (Walker et al., 2015); however, the lower preva- lence of Bifidobacterium spp. associated with indirect breast- feeding among the uniformly processed samples in our study suggests that modifiable factors could indeed impact the propor- tions of this bacterium in milk. We also found that Enterobacteri- aceae and potential pathogens were enriched with indirect breastfeeding, consistent with culture-dependent studies where pump expression increased the abundance of Enterobacteri- aceae and other gram-negative bacteria in milk (Jime´ nez et al., 2017). Increased exposure to potential pathogens in breastmilk could pose a risk of respiratory infection in the infant, representing Figure 5. Milk Microbiota Is Associated with Mode of Breastfeeding (A) a diversity. (B) Homogeneity of dispersion. (C) b diversity. (D) Discriminant analysis of taxa enrichment. (E) Prevalence of Bifidobacterium species. See also Figure S4. Cell Host & Microbe 25, 324–335, February 13, 2019 331
  • 10. another possible mechanism for increasing asthma risk (Beigel- man and Bacharier, 2016). Further research is warranted to explore the impact of pump expression and indirect breastfeed- ing on milk microbiota and its subsequent effect on infant gut mi- crobiota, immune development, and related health outcomes. Sex-Specific Variations in Milk Microbiota We observed intriguing differences in milk microbiota a diversity and overall community structure according to infant sex. There was a trend in direct association of infant sex with milk microbiota in our SEM analysis, and we also found sex-dependent associa- tions of breastfeeding mode, exclusivity, and lactation stage (higher R2 in males), as well as parity, mode of delivery, and maternal BMI (significant in females only) with milk microbiota in RDA. Lack of sex-stratified analysis could potentially explain why previous studies have reported inconclusive results on the association of the above-mentioned factors with milk microbiota. The mechanism for the observed sex differences in milk micro- biota remains to be determined. Sex differences in gut microbiota have been reported, and are usually attributed to hormonal differ- ences between male and female hosts (Markle et al., 2013). While the host is always female in the case of milk microbiota, it is sus- pected (as described above) that milk microbiota is partially derived from the infant oral cavity, which may differ in male versus female infants (Takeshita et al., 2016). The sex differences we have observed in milk microbiota could therefore be interpreted as additional evidence supporting the retrograde inoculation hy- pothesis. Other mechanisms for these sex differences are also possible, as sex-dependent variations have been observed in other milk components including calcium, cortisol, and fat (Fujita et al., 2012; Hinde, 2007; Hinde et al., 2013; Sullivan et al., 2011). Milk Microbiota and Other Milk Components Our study uniquely investigated the relationship of milk micro- biota and other milk components such as fatty acids, maternal hormones, and HMOs, which may shape the overall milk envi- ronment and create the niche for the milk microbiota (Williams et al., 2017). Using RDA, we observed a trend in the association of milk fatty acid and HMO profiles with milk microbiota compo- sition. However, using SEM we did not detect a directional or correlational association of the overall milk environment with the milk microbiota composition, perhaps because our study lacked information on other key components of the milk environ- ment (e.g., immune cells, cytokines, and micro- and macro-nutri- ents). Further research is warranted to explore the interaction be- tween milk microbiota and other milk components, and to study their combined impact on infant development. Modifiable Maternal Factors and Milk Microbiota There is great interest in identifying modifiable factors influencing the milk microbiota, with studies to date reporting inconsistent as- sociations for mode of delivery, maternal diet, and maternal BMI (Cabrera-Rubio et al., 2012; Li et al., 2017; McGuire and McGuire, 2017; Sakwinska et al., 2016; Urbaniak et al., 2016). Maternal diet and BMI are interrelated, and both can modify gut microbiota composition (Collado et al., 2008; Wu et al., 2011) as well as the macro- and micro-nutrient profile of human milk (Mazurier et al., 2017; McGuire et al., 2017), altering the niche for milk microbiota. Maternal BMI is also positively associated with Caesarean section delivery (Pettersen-Dahl et al., 2018). In our SEM analysis, maternal diet, maternal BMI, and delivery mode did not directly affect milk microbiota. However, controlling for the maternal die- tary pattern as a factor either affecting the maternal BMI or directly modulating milk fatty acid composition, we observed that BMI could indirectly (via the effect on the overall milk environment) influence the milk microbiota. Using RDA, we found that mode ofdelivery and maternal BMI were associated withmilk microbiota in female infants only, although the effect sizes were small (<2% of variation explained). We also observed a trend toward lower bac- terial richness following emergency Caesarean section after con- trolling for relevant confounding factors. Overall, these associa- tions were relatively subtle and sex-specific, which may explain why previous smaller studies have not found a consistent overall effect of delivery mode on milk microbiota composition. Strengths and Limitations The main strength of this study is our unique multi-variable and multi-methodapproachtoassessingtheeffectofdiversematernal, infant, early-life, and milk factors on the milk microbiota, using the rich data and large sample size afforded by the CHILD cohort. Notably, however, the many factors we evaluated collectively ex- plained less than a third of the total variation observed in milk mi- crobiota composition, indicating that other unmeasured factors are contributing to the large inter-individual variation in milk micro- biota profiles. The main limitation of our study is that milk samples were pooled from multiple feeds and were not collected asepti- cally. While this collection protocol precludes analysis of potential diurnal variations and limits our ability to strictly study the milk mi- crobiota (without skin or other ‘‘contaminants’’), it provides an ac- curate representation of the microbiota that infants ingest, which is arguably more biologically relevant to infant health outcomes. Although refrigeration could potentially impact the microbial profile of the milk samples (Sosa and Barness 1987), we did not find any association between sample processing time and milk microbiota composition. We collected a single sample from each mother, so we could not examine longitudinal changes in milk microbiota composition over time. Although we identified potential reagent contaminants at the sequencing step, sequencing results were not available for DNA extraction negative controls, and thus we were not able to identify and remove potential contaminants that might have been introduced during the extraction. Finally, as with all culture-independent microbiota studies, we could not quantify bacterial load or confirm the viability of bacteria identified in our samples (McGuire and McGuire, 2015). As 16S rRNA gene sequencing has limited capacity to resolve the taxa to species and strain levels, further metagenomic and/or culturomic studies are required to confirm and validate the results of this study. Future Directions Our results indicate that fixed and modifiable factors can influ- ence the milk microbiota in a sex-specific manner. Whether milk provides bacteria to colonize the infant gut or merely pro- vides selective nutrients to foster a permissive environment is still an open question. Further investigation is needed to deter- mine if milk effectively transfers maternal microbiota or simply enriches and protects the infant oral microbiota for a safe pas- sage to the infant’s distal gut. Studies are also needed to identify sources of exogenously derived bacteria; characterize other 332 Cell Host & Microbe 25, 324–335, February 13, 2019
  • 11. elements of the milk microbiota, including fungi and viruses; and determine the impact of pumping on the microbiota of expressed milk. Finally, the impact of milk microbiota on infant gut micro- biota development and health remains to be explored and could have important implications for microbiota-based strategies for early-life prevention of chronic conditions. Conclusions In this large and comprehensive study, we have used multivari- able approaches to explore many features and potential deter- minants of human milk microbiota composition. Our results sug- gest that multiple maternal, infant, and environmental factors interactively influence milk microbiota composition. Most strik- ingly, indirect breastfeeding and pump expression were consis- tently associated with milk microbiota composition, highlighting the importance of breastfeeding practices. Interesting sex differ- ences were also identified, as well as potential associations be- tween microbiota and other milk components. Further research is warranted to replicate these findings in other populations and explore their implications for infant health and development. STAR+METHODS Detailed methods are provided in the online version of this paper and include the following: d KEY RESOURCES TABLE d CONTACT FOR REAGENT AND RESOURCE SHARING d EXPERIMENTAL MODEL AND SUBJECT DETAILS B Inclusion and Exclusion of Study Participants B Maternal, Infant and Early-Life Factors d METHOD DETAILS B Sample Collection and Processing B Milk Microbiota Analysis B Analysis of Other Milk Components d QUANTIFICATION AND STATISTICAL ANALYSIS B Microbial Data Pre-processing and Reagent Contami- nant Removal B Handling Missing Data B Exclusion of Data B Linear Association of a Diversity with Maternal, Infant, and Milk Factors B Linear Relationships between Taxa Abundance and Maternal, Infant, and Milk Factors B Redundancy Analysis B Hierarchical Clustering of the Core Microbiota B Structural Equation Modeling B Linear Discriminant Analysis B Presence/Absence Analysis by Mode of Breastfeeding d DATA AND SOFTWARE AVAILABILITY SUPPLEMENTAL INFORMATION Supplemental Information includes four figures and seven tables and can be found with this article online at https://doi.org/10.1016/j.chom.2019.01.011. ACKNOWLEDGMENTS We are grateful to all the families who took part in this study, and the whole CHILD team, which includes interviewers, nurses, computer and laboratory technicians, clerical workers, research scientists, volunteers, managers, and receptionists. The full list of CHILD study investigators is listed separately. We thank Leah Stiemsma for creating the antibiotic variables, Lorena Vehling for creating the breastfeeding variables, and Sonia S Anand for creating the maternal dietary pattern variables. We also thank Hooman Derakhshani for constructive discussion during the revision. The Canadian Institutes of Health Research (CIHR) and the Allergy, Genes and Environment Network of Centres of Excellence (AllerGen NCE) provided core support for the CHILD Study. This research was specifically funded by the Heart and Stroke Foundation and Ca- nadian Lung Association, in partnership with the Canadian Respiratory Research Network and AllerGen NCE. Additional support was provided by the Natural Science and Engineering Research Council of Canada (NSERC) Discovery Program and internal grants from the University of Manitoba. Infra- structure at the Gut Microbiome Laboratory was supported by grants from the Canadian Foundation for Innovation. This research was supported, in part, by the Canada Research Chairs program. S.M. holds a Research Manitoba Doctoral Studentship. These entities had no role in the design and conduct of the study; collection, management, analysis, and interpretation of the data; and preparation, review, or approval of the manuscript. CHILD investiga- tors include P.S. (Director), The Hospital for Sick Children and University of Toronto; S.E.T. (co-Director), University of British Columbia; M.R.S. (Founding Director), McMaster University; S.S. Anand, McMaster University; M.B.A., Uni- versity of Manitoba; A.B.B., University of Manitoba; A.D. Befus, University of Alberta; M. Brauer, University of British Columbia; J.R. Brook, University of Toronto; E. Chen, Northwestern University, Chicago; M.M. Cyr, McMaster Uni- versity; D. Daley, University of British Columbia; S.D. Dell, The Hospital for Sick Children and University of Toronto; J.A. Denburg, McMaster University; Q.L. Duan, Queen’s University; T. Eiwegger, The Hospital for Sick Children and Uni- versity of Toronto; H. Grasemann, The Hospital for Sick Children and Univer- sity of Toronto; K. HayGlass, University of Manitoba; R.G. Hegele, The Hospital for Sick Children and University of Toronto; D.L. Holness, University of Tor- onto; P. Hystad, Oregon State University; M. Kobor, University of British Columbia; T.R. Kollmann, University of British Columbia; A.L. Kozyrskyj, Uni- versity of Alberta; C. Laprise, Universite´ du Que´ bec a` Chicoutimi; W.Y.W. Lou, University of Toronto; J. Macri, McMaster University; P.J.M., University of Alberta; G. Miller, Northwestern University, Chicago; T.J.M., The Hospital for Sick Children and University of Toronto; P. Pare´ , University of British Columbia; C. Ramsey, University of Manitoba; F. Ratjen, The Hospital for Sick Children and University of Toronto; A. Sandford, University of British Columbia; J.A. Scott, University of Toronto; J. Scott, University of Toronto; F. Silverman, University of Toronto; E. Simons, University of Manitoba; T. Ta- karo, Simon Fraser University; S.J. Tebbutt, University of British Columbia; and T. To, The Hospital for Sick Children and University of Toronto. AUTHOR CONTRIBUTIONS Conceptualization, M.B.A.; Methodology, S.M., E.K., S.S., L.B., and L.M.L.; Investigation, S.M., B.R., and S.G.; Writing – Original Draft, S.M. and M.B.A.; Writing – Review & Editing, S.S., B.R., L.B., S.G., C.J.F., L.M.L., R.J.S., A.B.B., P.J.M., S.E.T., P.S., T.J.M., D.L.L., M.R.S., and E.K.; Funding Acquisi- tion, M.B.A.; Resources, R.J.S., A.B.B., P.J.M., S.E.T., P.S., D.L.L., and M.R.S.; Supervision, M.B.A. and E.K. DECLARATION OF INTERESTS The authors declare no competing interests. Received: July 8, 2018 Revised: November 2, 2018 Accepted: January 3, 2019 Published: February 13, 2019 REFERENCES Alderete, T.L., Autran, C., Brekke, B.E., Knight, R., Bode, L., Goran, M.I., and Fields, D.A. (2015). Associations between human milk oligosaccharides and infant body composition in the first 6 mo of life. Am. J. Clin. Nutr. 102, 1381–1388. Cell Host & Microbe 25, 324–335, February 13, 2019 333
  • 12. Asnicar, F., Manara, S., Zolfo, M., Truong, D.T., Scholz, M., Armanini, F., Ferretti, P., Gorfer, V., Pedrotti, A., Tett, A., et al. (2017). Studying vertical mi- crobiome transmission from mothers to infants by strain-level metagenomic profiling. mSystems 2, e00164–00116. Astudillo-Garcı´a, C., Bell, J.J., Webster, N.S., Glasl, B., Jompa, J., Montoya, J.M., and Taylor, M.W. (2017). Evaluating the core microbiota in complex com- munities: a systematic investigation. Environ. Microbiol. 19, 1450–1462. Azad, M.B., Konya, T., Guttman, D.S., Field, C.J., Sears, M.R., HayGlass, K.T., Mandhane, P.J., Turvey, S.E., Subbarao, P., Becker, A.B., et al.; CHILD Study Investigators (2015). Infant gut microbiota and food sensitization: associations in the first year of life. Clin. Exp. Allergy 45, 632–643. Beigelman, A., and Bacharier, L.B. (2016). Early-life respiratory infections and asthma development: role in disease pathogenesis and potential targets for disease prevention. Curr. Opin. Allergy Clin. Immunol. 16, 172–178. Benjamini, Y., and Hochberg, Y. (1995). Controlling the false discovery rate: a practical and powerful approach to multiple testing. J. R. Stat. Soc. B 57, 289–300. Biagi, E., Quercia, S., Aceti, A., Beghetti, I., Rampelli, S., Turroni, S., Faldella, G., Candela, M., Brigidi, P., and Corvaglia, L. (2017). The bacterial ecosystem of mother’s milk and infant’s mouth and gut. Front. Microbiol. 8, 1214. Bisanz, J.E., Enos, M.K., PrayGod, G., Seney, S., Macklaim, J.M., Chilton, S., Willner, D., Knight, R., Fusch, C., Fusch, G., et al. (2015). Microbiota at multiple body sites during pregnancy in a rural Tanzanian population and effects of moringa-supplemented probiotic yogurt. Appl. Environ. Microbiol. 81, 4965–4975. Bode, L., McGuire, M., Rodriguez, J.M., Geddes, D.T., Hassiotou, F., Hartmann, P.E., and McGuire, M.K. (2014). It’s alive: microbes and cells in human milk and their potential benefits to mother and infant. Adv. Nutr. 5, 571–573. Bridgman, S.L., Kozyrskyj, A.L., Scott, J.A., Becker, A.B., and Azad, M.B. (2016). Gut microbiota and allergic disease in children. Ann. Allergy Asthma Immunol. 116, 99–105. Cabrera-Rubio, R., Collado, M.C., Laitinen, K., Salminen, S., Isolauri, E., and Mira, A. (2012). The human milk microbiome changes over lactation and is shaped by maternal weight and mode of delivery. Am. J. Clin. Nutr. 96, 544–551. Callahan, B.J., McMurdie, P.J., Rosen, M.J., Han, A.W., Johnson, A.J., and Holmes, S.P. (2016). DADA2: high-resolution sample inference from Illumina amplicon data. Nat. Methods 13, 581–583. Caporaso, J.G., Kuczynski, J., Stombaugh, J., Bittinger, K., Bushman, F.D., Costello, E.K., Fierer, N., Pen˜ a, A.G., Goodrich, J.K., Gordon, J.I., et al. (2010). QIIME allows analysis of high-throughput community sequencing data. Nat. Methods 7, 335–336. Caporaso, J.G., Lauber, C.L., Walters, W.A., Berg-Lyons, D., Huntley, J., Fierer, N., Owens, S.M., Betley, J., Fraser, L., Bauer, M., et al. (2012). Ultra- high-throughput microbial community analysis on the Illumina HiSeq and MiSeq platforms. ISME J. 6, 1621–1624. Chan, D., Goruk, S., Becker, A.B., Subbarao, P., Mandhane, P.J., Turvey, S.E., Lefebvre, D., Sears, M.R., Field, C.J., and Azad, M.B. (2018). Adiponectin, lep- tin and insulin in breast milk: associations with maternal characteristics and in- fant body composition in the first year of life. Int. J. Obes. 42, 36–43. Collado, M.C., Isolauri, E., Laitinen, K., and Salminen, S. (2008). Distinct composition of gut microbiota during pregnancy in overweight and normal- weight women. Am. J. Clin. Nutr. 88, 894–899. Cruz-Hernandez, C., Goeuriot, S., Giuffrida, F., Thakkar, S.K., and Destaillats, F. (2013). Direct quantification of fatty acids in human milk by gas chromatog- raphy. J. Chromatogr. A 1284, 174–179. Damaceno, Q.S., Souza, J.P., Nicoli, J.R., Paula, R.L., Assis, G.B., Figueiredo, H.C., Azevedo, V., and Martins, F.S. (2017). Evaluation of potential probiotics isolated from human milk and colostrum. Probiotics Antimicrob. Proteins 9, 371–379. Davis, N.M., Proctor, D.M., Holmes, S.P., Relman, D.A., and Callahan, B.J. (2018). Simple statistical identification and removal of contaminant sequences in marker-gene and metagenomics data. Microbiome 6, 226. de Souza, R.J., Zulyniak, M.A., Desai, D., Shaikh, M.R., Campbell, N.C., Lefebvre, D.L., Gupta, M., Wilson, J., Wahi, G., Atkinson, S.A., et al.; NutriGen Alliance Investigators (2016). Harmonization of food-frequency ques- tionnaires and dietary pattern analysis in 4 ethnically diverse birth cohorts. J. Nutr. 146, 2343–2350. Derakhshani, H., Tun, H.M., and Khafipour, E. (2016). An extended single-in- dex multiplexed 16S rRNA sequencing for microbial community analysis on MiSeq illumina platforms. J. Basic Microbiol. 56, 321–326. DeSantis, T.Z., Hugenholtz, P., Larsen, N., Rojas, M., Brodie, E.L., Keller, K., Huber, T., Dalevi, D., Hu, P., and Andersen, G.L. (2006). Greengenes, a chimera-checked 16S rRNA gene database and workbench compatible with ARB. Appl. Environ. Microbiol. 72, 5069–5072. Epskamp, S., and Stuber, S. (2017). semPlot: path diagrams and visual analysis of various SEM packages’ output. R package version 1.1. Fields, D.A., and Demerath, E.W. (2012). Relationship of insulin, glucose, leptin, IL-6 and TNF-a in human breast milk with infant growth and body composition. Pediatr. Obes. 7, 304–312. Fujita, M., Roth, E., Lo, Y.J., Hurst, C., Vollner, J., and Kendell, A. (2012). In poor families, mothers’ milk is richer for daughters than sons: a test of Trivers-Willard hypothesis in agropastoral settlements in Northern Kenya. Am. J. Phys. Anthropol. 149, 52–59. Gloor, G.B., and Reid, G. (2016). Compositional analysis: a valid approach to analyze microbiome high-throughput sequencing data. Can. J. Microbiol. 62, 692–703. Gomez-Gallego, C., Garcia-Mantrana, I., Salminen, S., and Collado, M.C. (2016). The human milk microbiome and factors influencing its composition and activity. Semin. Fetal Neonatal Med. 21, 400–405. Hinde, K. (2007). First-time macaque mothers bias milk composition in favor of sons. Curr. Biol. 17, R958–R959. Hinde, K., Foster, A.B., Landis, L.M., Rendina, D., Oftedal, O.T., and Power, M.L. (2013). Daughter dearest: Sex-biased calcium in mother’s milk among rhesus macaques. Am. J. Phys. Anthropol. 151, 144–150. Hytten, F.E. (1954). Clinical and chemical studies in human lactation. BMJ 1, 175–182. Jime´ nez, E., Arroyo, R., Ca´ rdenas, N., Marı´n, M., Serrano, P., Ferna´ ndez, L., and Rodrı´guez, J.M. (2017). Mammary candidiasis: a medical condition without scientific evidence? PLoS One 12, e0181071. Karstens, L., Asquith, M., Davin, S., Fair, D., Gregory, W.T., Wolfe, A.J., Braun, J., and McWeeney, S. (2018). Controlling for contaminants in low biomass 16S rRNA gene sequencing experiments. bioRxiv. https://doi.org/10.1101/ 329854. Kline, R.B. (2016). Principles and Practices of Structural Equation Modeling, Fourth Edition (The Guilford Press). Klopp, A., Vehling, L., Becker, A.B., Subbarao, P., Mandhane, P.J., Turvey, S.E., Lefebvre, D.L., Sears, M.R., and Azad, M.B.; CHILD Study Investigators (2017). Modes of infant feeding and the risk of childhood asthma: a Prospective Birth Cohort study. J. Pediatr. 190, 192–199.e2. Knights, D., Ward, T.L., McKinlay, C.E., Miller, H., Gonzalez, A., McDonald, D., and Knight, R. (2014). Rethinking ‘‘enterotypes’’. Cell Host Microbe 16, 433–437. Korkmaz, S., Goksuluk, D., and Zararsiz, G. (2014). MVN: an R package for assessing multivariate normality. R J. 6, 151–162. Laforest-Lapointe, I., and Arrieta, M.C. (2017). Patterns of early-life gut micro- bial colonization during human immune development: an ecological perspec- tive. Front. Immunol. 8, 788. Li, M., Wang, M., and Donovan, S.M. (2014). Early development of the gut mi- crobiome and immune-mediated childhood disorders. Semin. Reprod. Med. 32, 74–86. Li, S.W., Watanabe, K., Hsu, C.C., Chao, S.H., Yang, Z.H., Lin, Y.J., Chen, C.C., Cao, Y.M., Huang, H.C., Chang, C.H., and Tsai, Y.C. (2017). Bacterial composition and diversity in breast milk samples from mothers living in Taiwan and mainland China. Front. Microbiol. 8, 965. Markle, J.G., Frank, D.N., Mortin-Toth, S., Robertson, C.E., Feazel, L.M., Rolle-Kampczyk, U., von Bergen, M., McCoy, K.D., Macpherson, A.J., and 334 Cell Host & Microbe 25, 324–335, February 13, 2019
  • 13. Danska, J.S. (2013). Sex differences in the gut microbiome drive hormone- dependent regulation of autoimmunity. Science 339, 1084–1088. Mazurier, E., Rigourd, V., Perez, P., Buffin, R., Couedelo, L., Vaysse, C., Belcadi, W., Sitta, R., Nacka, F., Lamireau, D., et al. (2017). Effects of maternal supplementation with omega-3 precursors on human milk composition. J. Hum. Lact. 33, 319–328. McGuire, M.K., and McGuire, M.A. (2015). Human milk: mother nature’s pro- totypical probiotic food? Adv. Nutr. 6, 112–123. McGuire, M.K., and McGuire, M.A. (2017). Got bacteria? The astounding, yet not-so-surprising, microbiome of human milk. Curr. Opin. Biotechnol. 44, 63–68. McGuire, M.K., Meehan, C.L., McGuire, M.A., Williams, J.E., Foster, J., Sellen, D.W., Kamau-Mbuthia, E.W., Kamundia, E.W., Mbugua, S., Moore, S.E., et al. (2017). What’s normal? Oligosaccharide concentrations and profiles in milk produced by healthy women vary geographically. Am. J. Clin. Nutr. 105, 1086–1100. McMurdie, P.J., and Holmes, S. (2013). phyloseq: an R package for reproduc- ible interactive analysis and graphics of microbiome census data. PLoS One 8, e61217. Moraes, T.J., Lefebvre, D.L., Chooniedass, R., Becker, A.B., Brook, J.R., Denburg, J., HayGlass, K.T., Hegele, R.G., Kollmann, T.R., Macri, J., et al.; CHILD Study Investigators (2015). The Canadian healthy infant longitudinal development birth cohort study: biological samples and biobanking. Paediatr. Perinat. Epidemiol. 29, 84–92. Nozad, S., Ramin, A.G., and Asri Rezaie, S. (2012). Diurnal variations in milk macro-mineral concentrations in Holstein dairy cows in Urmia, Iran. Vet. Res. Forum 3, 281–285. Oksanen, J., Blanchet, F.G., Friendly, M., Kindt, R., Legendre, P., McGlinn, D., Minchin, P.R., O’Hara, R.B., Simpson, G.L., Solymos, P., et al. (2017). Vegan: community ecology package. R package version 2.4-3. Palarea-Albaladejo, J., and Martin-Fernandez, J.A. (2015). zCompositions - R package for multivariate imputation of left-censored data under a composi- tional approach. Chemom. Intell. Lab. Syst. 143, 85–96. Parigi, S.M., Eldh, M., Larssen, P., Gabrielsson, S., and Villablanca, E.J. (2015). Breast milk and solid food shaping intestinal immunity. Front. Immunol. 6, 415. Pettersen-Dahl, A., Murzakanova, G., Sandvik, L., and Laine, K. (2018). Maternal body mass index as a predictor for delivery method. Acta Obstet. Gynecol. Scand. 97, 212–218. R Core Team (2017). R: A language and environment for statistical computing. R Foundation for Statistical Computing, Vienna, Austria. Rainard, P. (2017). Mammary microbiota of dairy ruminants: fact or fiction? Vet. Res. 48, 25. Rosseel, Y. (2012). lavaan: an R package for structural equation modeling. J. Stat. Softw. 48, 1–36. Sakwinska, O., Moine, D., Delley, M., Combremont, S., Rezzonico, E., Descombes, P., Vinyes-Pares, G., Zhang, Y., Wang, P., and Thakkar, S.K. (2016). Microbiota in breast milk of Chinese lactating mothers. PLoS One 11, e0160856. Salter, S.J., Cox, M.J., Turek, E.M., Calus, S.T., Cookson, W.O., Moffatt, M.F., Turner, P., Parkhill, J., Loman, N.J., and Walker, A.W. (2014). Reagent and laboratory contamination can critically impact sequence-based microbiome analyses. BMC Biol. 12, 87. Segata, N., Izard, J., Waldron, L., Gevers, D., Miropolsky, L., Garrett, W.S., and Huttenhower, C. (2011). Metagenomic biomarker discovery and explanation. Genome Biol. 12, R60. Shade, A., and Handelsman, J. (2012). Beyond the Venn diagram: the hunt for a core microbiome. Environ. Microbiol. 14, 4–12. Sosa, R., and Barness, L. (1987). Bacterial growth in refrigerated human milk. Am. J. Dis. Child. 141, 111–112. Subbarao, P., Anand, S.S., Becker, A.B., Befus, A.D., Brauer, M., Brook, J.R., Denburg, J.A., HayGlass, K.T., Kobor, M.S., Kollmann, T.R., et al.; CHILD Study investigators (2015). The Canadian Healthy Infant Longitudinal Development (CHILD) Study: examining developmental origins of allergy and asthma. Thorax 70, 998–1000. Sullivan, E.C., Hinde, K., Mendoza, S.P., and Capitanio, J.P. (2011). Cortisol concentrations in the milk of rhesus monkey mothers are associated with confident temperament in sons, but not daughters. Dev. Psychobiol. 53, 96–104. Takeshita, T., Kageyama, S., Furuta, M., Tsuboi, H., Takeuchi, K., Shibata, Y., Shimazaki, Y., Akifusa, S., Ninomiya, T., Kiyohara, Y., and Yamashita, Y. (2016). Bacterial diversity in saliva and oral health-related conditions: the Hisayama Study. Sci. Rep. 6, 22164. Tibshirani, R., Walther, G., and Hastie, T. (2001). Estimating the number of clusters in a data set via the gap statistic. J. R. Stat. Soc. B 63, 411–423. Urbaniak, C., Cummins, J., Brackstone, M., Macklaim, J.M., Gloor, G.B., Baban, C.K., Scott, L., O’Hanlon, D.M., Burton, J.P., Francis, K.P., et al. (2014). Microbiota of human breast tissue. Appl. Environ. Microbiol. 80, 3007–3014. Urbaniak, C., Angelini, M., Gloor, G.B., and Reid, G. (2016). Human milk micro- biota profiles in relation to birthing method, gestation and infant gender. Microbiome 4, 1. van Buuren, S., and Groothuis-Oudshoorn, K. (2011). mice: multivariate impu- tation by chained equations in R. J. Stat. Softw. 45, 1–67. Walker, A.W., Martin, J.C., Scott, P., Parkhill, J., Flint, H.J., and Scott, K.P. (2015). 16S rRNA gene-based profiling of the human infant gut microbiota is strongly influenced by sample processing and PCR primer choice. Microbiome 3, 26. West, P.A., Hewitt, J.H., and Murphy, O.M. (1979). Influence of methods of collection and storage on the bacteriology of human milk. J. Appl. Bacteriol. 46, 269–277. Williams, J.E., Price, W.J., Shafii, B., Yahvah, K.M., Bode, L., McGuire, M.A., and McGuire, M.K. (2017). Relationships among microbial communities, maternal cells, oligosaccharides, and macronutrients in human milk. J. Hum. Lact. 33, 540–551. Wu, G.D., Chen, J., Hoffmann, C., Bittinger, K., Chen, Y.Y., Keilbaugh, S.A., Bewtra, M., Knights, D., Walters, W.A., Knight, R., et al. (2011). Linking long- term dietary patterns with gut microbial enterotypes. Science 334, 105–108. Cell Host & Microbe 25, 324–335, February 13, 2019 335
  • 14. STAR+METHODS KEY RESOURCES TABLE CONTACT FOR REAGENT AND RESOURCE SHARING Further information and requests for resources and reagents should be directed to and will be fulfilled by the Lead Contact, Meghan Azad (meghan.azad@umanitoba.ca). EXPERIMENTAL MODEL AND SUBJECT DETAILS Inclusion and Exclusion of Study Participants We studied a representative subset of 428 mothers in the Canadian Healthy Infant Longitudinal Development (CHILD) cohort, a population-based birth cohort designed to study the developmental origins of pediatric asthma and allergy (Subbarao et al., 2015). Women with singleton pregnancies were enrolled between 2008 and 2012 (n = 3407) and remained eligible if they deliv- ered a healthy infant > 35 weeks gestation (n = 3264). For the current study, we selected a representative subset of 428 mother- infant dyads with available milk samples, ensuring equal representation across the 4 study sites, excluding dyads missing key maternal (e.g., diet, BMI) or infant (1y clinical) data, and then randomly selecting among the rest (Table S1). This study was approved by the Human Research Ethics Boards at McMaster University and the Universities of Manitoba, Alberta, Toronto and British Columbia. REAGENT or RESOURCE SOURCE IDENTIFIER Biological Samples Breastmilk (1ml) Moraes et al., 2015 CHILD study http://childstudy.ca Commercial Kits Quick-DNA Fungal/Bacterial extraction kit Zymo Research Cat# D6005 MiSeq Reagent Kit v3 (600-cycle) Illumina Cat# MS-102-3003 Deposited Data Raw data This paper 16S rRNA sequence data (NCBI) BioProject: PRJNA481046, Sequence Read Archive, SRA: SRP153543 Primers 16S rRNA-Forward Primer 515F: GTGCCAGCMGCCGCGGTAA Caporaso et al., 2012 N/A 16S rRNA-Reverse Primer 806R: GGACTACHVGGGTWTCTAAT Caporaso et al., 2012 N/A Software and Algorithms QIIME2 v.2018.6 Caporaso et al., 2010 https://qiime2.org Greengenes v. 13.8 DeSantis et al., 2006 http://greengenes.secondgenome.com Phyloseq v. 1.19.1 McMurdie and Holmes, 2013 https://joey711.github.io/phyloseq/index.html Decontam v. 1.1.0 (Davis et al., 2018) https://benjjneb.github.io/decontam/vignettes/ decontam_intro.html MICE v. 2.30 van Buuren and Groothuis- Oudshoorn, 2011 https://github.com/stefvanbuuren/mice CoDaSeq v. 0.99.1 Gloor and Reid, 2016 https://github.com/ggloor/CoDaSeq Vegan v. 2.4-4 Oksanen et al., 2017 https://cran.r-project.org/web/packages/vegan/ vegan.pdf LEFSe Segata et al., 2011 http://huttenhower.sph.harvard.edu/galaxy/ Lavaan v. 0.5-23.1097 Rosseel, 2012 N/A R v. 3.3.3 and 3.5.1 R Core Team https://www.r-project.org e1 Cell Host & Microbe 25, 324–335.e1–e4, February 13, 2019
  • 15. Maternal, Infant and Early-Life Factors Infant feeding was reported by standardized questionnaire at 3, 6, 12, 18 and 24 months. At the time of sample collection (3-4 months), breastfeeding status was classified as exclusive (human milk only) or partial (human milk supplemented with infant for- mula or solid food). The mode of breastmilk feeding was reported for breastfed infants at three months of age and classified as ‘‘direct only’’ (no feeding of pumped milk), or ‘‘some indirect’’ (at least one serving of pumped milk in the past two weeks) (Klopp et al., 2017). Maternal age, infant sex, birth weight, gestational age, method of birth, parity, and intrapartum antibiotic use were documented from hospital records. Mode of delivery was categorised as normal vaginal delivery (NVD), emergency, or elective Caesarean section. Maternal ethnicity, tobacco smoking, history of asthma diagnosis, and maternal and child intravenous and/or oral antibiotic before sample collection use were reported by standardized questionnaire. Maternal dietary patterns were determined by principal compo- nents analysis (PCA) from a modified food frequency questionnaire (de Souza et al., 2016). METHOD DETAILS Sample Collection and Processing Each mother provided one sample of milk at 3-4 months postpartum [mean (SD) 17 (5) weeks postpartum] in a sterile milk container provided by CHILD study. To control for differences in the milk composition of fore- and hindmilk (Hytten, 1954) as well as the diurnal variation (Nozad et al., 2012); a mix of foremilk and hindmilk from multiple feeds during a 24-hour period was collected. Hand expres- sion was recommended, but pumping was also acceptable. The sample was not collected aseptically. Samples were refrigerated at home for up to 24 hours before being collected and processed by study staff (Moraes et al., 2015). Samples were stored at À80 C until analysis. The time between sample pick-up from home and processing by the CHILD laboratory personnel was recorded. We did not observe any associations of sample processing time with milk microbiota richness, diversity, taxa relative abundance, overall composition, and cluster membership (not shown). Milk Microbiota Analysis Genomic DNA was extracted from 1 mL breastmilk using Quick-DNA Fungal/Bacterial extraction kit following the manufacturer’s instructions (Zymo Research, USA). The samples were centrifuged (13,000 g at 4 C for 20 min), the fat rim was carefully removed using a sterile swab, and the supernatant stored for future analysis. Total DNA was extracted from the pellet. Samples were sequenced following amplification of V4 hypervariable region of the 16S rRNA gene with modified F515/R806 primers (Caporaso et al., 2012) on a MiSeq platform (Illumina, San Diego, CA, USA) as previously described (Derakhshani et al., 2016). Sterile DNA- free water was used as negative controls in sequencing library preparation. A mock community consisting of DNA extracted from of 10 species with known theoretical relative abundances (Zymo Research, USA) were also run as positive control. Over- lapping paired-end reads were processed with dada2 pipeline (Callahan et al., 2016) using the open-source software QIIME 2 v.2018.6 (https://qiime2.org) (Caporaso et al., 2010). Unique amplicon sequence variants (ASVs) were assigned a taxonomy and aligned to the 2013 release of the Greengenes reference database at 99% sequence similarity (DeSantis et al., 2006). Demultiplexed sequencing data was deposited into the Sequence Read Archive (SRA) of NCBI and can be accessed via acces- sion number SRA: SRP153543. Analysis of Other Milk Components Human milk oligosaccharides (HMOs), milk fatty acids (MFA), and milk metabolic hormones (insulin and leptin) were measured in the same milk samples. HMO analysis was performed at the University of California, San Diego, as previously described (Fields and Demerath, 2012). Briefly, raffinose was added to each sample as an internal standard for absolute quantification. HMOs were iso- lated by high-throughput solid-phase extraction, fluorescently labeled, and analyzed by high-performance liquid chromatography with fluorescence detection. 19 HMOs were detected and quantified on the basis of retention time comparison with commercial standard oligosaccharides and mass spectrometry analysis. These 19 HMOs typically account for 90% of total HMO content; their concentrations were summed to estimate total HMO concentration. The relative abundance of each HMO was calculated. Maternal secretor status was defined by the presence of 20 -fucosyllactose (20 -FL) or lacto-N-fucopentaose (LNFP) (Alderete et al., 2015). Milk metabolic hormones (leptin and insulin) were measured using the Mesoscale Discovery System at University of Alberta as previously described (Chan et al., 2018). Briefly, measurements were done in duplicate using kits precoated with the antibody to each hormone following the manufacturer’s instructions (MesoScale Discovery, Gaithersburg, MD, USA). Results were measured on the MesoScale Discovery Sector Imager 2400 plate reader and the Discovery Workbench 3.0 software was used to generate standard curves and calculate analyte concentrations in each sample. MFAs were analyzed by gas liquid chro- matography at University of Alberta as previously described (Cruz-Hernandez et al., 2013). Briefly, total milk lipids were extracted using a modified Folch protocol. The total lipid extracted was resuspended in 500 mL fresh hexane and injected into a gas liquid chromatograph. Fatty acid methyl esters were prepared using HCl/Methanol (3N) as a catalyst followed by gas liquid chromatog- raphy. An internal triglyceride standard was added to identify the fatty acids and determine their relative concentration. Fatty acids were identified according to commercial standards 502 and 643 (Nu-Chek Prep, Elysian, MN, USA) and expressed as a relative percent of total identified fatty acids. Cell Host Microbe 25, 324–335.e1–e4, February 13, 2019 e2
  • 16. QUANTIFICATION AND STATISTICAL ANALYSIS Microbial Data Pre-processing and Reagent Contaminant Removal Data analysis was conducted in R (R Core Team, 2017). Initial preprocessing of the ASV table was conducted using the Phyloseq package (McMurdie and Holmes, 2013). Potential reagent contaminants (Salter et al., 2014) were identified using decontam package based on either the frequency of the ASV in the negative control or the negative correlation with DNA concentration (Davis et al., 2018). Decontam package could remove 70%–90% of contaminants specifically when the source of contamination was not well- defined (Karstens et al., 2018). Overall, 9,711 unique ASVs were detected and 173 were identified as contaminants and excluded. Mock community composition was assessed and agreement with theoretical composition verified (Figure S1D). Samples with less than 25,000 sequencing reads were excluded (n = 35) and the remaining samples (n = 393) were rarefied to the minimum 25,000 sequencing reads per sample. ASVs only present in the mock community or negative controls (n = 894) and ASVs belonging to phylum Cyanobacteria, family of mitochondria, and class of chloroplast (n = 240) were removed. ASVs with less than 20 reads across the entire dataset (n = 6,173) were also removed, resulting in 1,972 remaining ASVs. The contribution of the excluded rare ASVs to the total reads per sample was deemed negligible (Figure S1E). The numbers of sequencing reads of taxa were then rela- tivized to the total sum of 25,000. This dataset was used for analysis unless otherwise specified. Handling Missing Data Missing data in HMOs (n = 4) and MFA (n = 5) matrices was imputed using multivariate imputation by chained equations (MICE) pack- age (van Buuren and Groothuis-Oudshoorn, 2011). Dimension reduction of ASVs, HMOs, and MFAs was achieved by principal component analysis (PCA). Samples with missing data for other covariates were excluded from multivariable analyses. Exclusion of Data Sequencing reads were excluded if they were deemed to be potential reagent contaminants. Samples were excluded if they had less than 25,000 sequencing reads. Additionally, samples were excluded from multivariable analyses if they were missing essential co- variate data. Linear Association of a Diversity with Maternal, Infant, and Milk Factors a diversity was assessed by the observed ASVs (richness) and inverse Simpson Index (diversity). Association of a diversity with maternal, infant, early life, and milk factors was assessed by linear regression adjusting for factors with p value of 0.05 in univariate analysis. Linear Relationships between Taxa Abundance and Maternal, Infant, and Milk Factors To control for the compositional nature of the data, ASV counts were center log-ratio transformed following zero-replacement (Gloor and Reid, 2016; Palarea-Albaladejo and Martin-Fernandez, 2015). After this transformation, taxa relative abundances were compared at species, genus, and phylum levels by one-way analysis of variance (ANOVA). P values were corrected with Benjamini-Hochberg’s false discovery rate (FDR) method (Benjamini and Hochberg, 1995). Redundancy Analysis The association of maternal, infant, early life, and milk factors with milk microbiota composition was assessed by redundancy analysis (RDA) with 1000 permutations using the vegan package (Oksanen et al., 2017). Hierarchical Clustering of the Core Microbiota Hierarchical clustering was performed on Bray-Curtis dissimilarity matrix of core ASVs (n = 12, defined as being present in at least 95% of samples with minimum of 1% mean relative abundance), with ward sum-of-square algorithm. The optimal number of clusters was determined using Gap statistics, which compares the observed change in within-cluster dispersion versus the expected change under an appropriate reference null distribution (Tibshirani et al., 2001). Dissimilarity (b diversity) of clusters was assessed by permu- tational ANOVA (PERMANOVA) using the vegan package (Oksanen et al., 2017). Association of factors with cluster membership was assessed using ANOVA (Tukey post hoc) for continuous and c2 (post hoc) for categorical variables. Structural Equation Modeling Structural equation modeling (SEM) was performed using confirmatory factor analysis (CFA) to assess the direct versus indirect association of determinant factors of the milk microbiota. SEM was conducted using the lavaan package (Rosseel, 2012) and path diagrams were visualized using semPlot package (Epskamp and Stuber, 2017). Variable selection was informed by the results of statistical tests explained above. The milk environment was modeled as a latent construct with principal component (PC) 1 axes of HMOs, MFAs, and hormones as indicators. The milk microbiota PC1 was used as the milk microbiota variable. Multivariate normality was assessed by Henze-Zirkler’s tests (Korkmaz et al., 2014). Given the non-normality of the data and inclusion of dichotomous cat- egorical variables, the model was estimated using maximum likelihood (ML) parameter estimation with bootstrapping (n = 1000) (Kline, 2016). The latent variable was scaled to have variance of one. Model fit was assessed by c2 test, the comparative fix index (CFI), root mean square error of approximation (RSMEA) and its 90% confidence interval (CI), and the standardized root e3 Cell Host Microbe 25, 324–335.e1–e4, February 13, 2019
  • 17. mean residuals (SRMR). Non-significant c2 test, CFI R 0.9, RMSEA 0.05, and SRMR 0.08 were considered as indications of good model fit (Kline, 2016). Equivalents of the final model were explored and defined by changing the directionality of associations or implying co-variation instead of causation. Linear Discriminant Analysis Taxa enrichment based on mode of breastfeeding was assessed by linear discriminant analysis (LDA) effect size (LEfSe) with default parameters and logarithmic LDA score threshold of three (Segata et al., 2011). Presence/Absence Analysis by Mode of Breastfeeding Bifidobacterium and Enterobacteriaceae prevalence according to the mode of breastfeeding was assessed by c2 test. DATA AND SOFTWARE AVAILABILITY The accession numbers for the 16S rRNA sequence data reported in this paper are BioProject: PRJNA481046 and SRA: SRP153543. Cell Host Microbe 25, 324–335.e1–e4, February 13, 2019 e4
  • 18. Cell Host Microbe, Volume 25 Supplemental Information Composition and Variation of the Human Milk Microbiota Are Influenced by Maternal and Early-Life Factors Shirin Moossavi, Shadi Sepehri, Bianca Robertson, Lars Bode, Sue Goruk, Catherine J. Field, Lisa M. Lix, Russell J. de Souza, Allan B. Becker, Piushkumar J. Mandhane, Stuart E. Turvey, Padmaja Subbarao, Theo J. Moraes, Diana L. Lefebvre, Malcolm R. Sears, Ehsan Khafipour, and Meghan B. Azad
  • 19. 1 Table S1. Characteristics of mother-infant dyads from the CHILD cohort included in this analysis (n=393) in comparison with all eligible dyads (n=2536) related to STAR Methods. Table S2. Most abundant bacterial genera (1% mean relative abundance) in the human milk microbiota among 393 mothers in the CHILD cohort related to Figure 1. Table S3. Core milk microbiotaa among 393 mothers in the CHILD cohort in comparison to the negative controls related to Figure 1. Table S4. Comparison of milk microbiota composition at family level, by cluster related to Figure 1. Table S5. Univariate associations of maternal and infant factors with milk microbiota composition and cluster membership among 393 dyads in the CHILD cohort related to Figure 1. Table S6. Factors not associated with milk microbiota α diversity among 393 mothers in the CHILD cohort related to Table 1. Table S7. Comparison the equivalent models of the final structural equation model related to Figure 4. Figure S1. Data quality control related to STAR Methods. . Figure S2. Hierarchical clustering of core milk microbiota among 393 mothers in the CHILD cohort related to Figure 1. Figure S3. Equivalent structural equation models assessing other potentially plausible models of associations of milk microbiota determinants among 393 mothers in the CHILD cohort related to Figure 4. Figure S4. Expressed milk microbiota is influenced by collection method related to Figure 5.
  • 20. 2 Table S1. Characteristics of mother-infant dyads from the CHILD cohort included in this analysis (n=393) in comparison with all eligible dyads (n=2536) related to STAR Methods. Factor Characteristics Mean ± SD or n (%)a Subset for this study N=393 All eligible dyads N=2536b Maternal Age (years) 33.0 ± 4.2 32.7 ± 4.2 Pre-pregnancy BMI (Kg/m2 ) 24.3 ± 5.2 24.5 ± 6.3 History of atopy 251 (63.9) 1624 (65.4) Secretor status 279 (71.7) 901 (74.7)c Ethnicity Caucasian Asian First Nations Other 287 (73.0) 73 (18.6) 15 (3.8) 18 (4.6) 1870 (74.3) 403 (16.0) 87 (3.5) 158 (6.3) Infant Birth weight (g) 3469 ± 469 3450 ± 479 Female sex 192 (48.9) 1198 (47.2) Gestational age (weeks) 39.2 ± 1.3 39.2 ± 1.2 Earlylife Mode of delivery Elective C/S Emergency C/S Vaginal 46 (11.9) 47 (12.1) 294 (76.0) 264 (10.6) 339 (13.6) 1893 (75.8) Maternal intrapartum antibiotics 139 (35.8) 996 (39.9) Maternal postpartum antibiotics before 3-4 months 41 (10.6) 265 (10.8) Child antibiotics before 3-4 months 11 (2.8) 75 (3.1) Older siblings None One Two or more 211 (53.7) 126 (32.1) 56 (14.2) 1345 (53.1) 860 (33.9) 330 (13.0) Breastfeeding Lactation stage at sample collection (weeks) 17.3 ± 5.3 16.5 ± 5.0 Exclusive BF (breast milk only) at sample collection 190 (48.3) 1393 (55.9) Direct BF (at the breast) only 162 (41.9) 1018 (40.1) Duration of BF (months) 13.2 ± 5.8 12.5 ± 5.6 Duration of exclusive BF (months) 3.5 ± 2.3 3.7 ± 2.3 Milk HMO concentration (mg/mL) 10.2 ± 2.1 10.3 ± 2.1c HMO Simpson’s diversity 4.9 ± 1.4 4.9 ± 1.3c Insulin (pg/mL) 760 ± 664 Unknown Leptin (pg/mL) 556 ± 601 Unknown a Percentages are calculated after excluding dyads with missing data. BF, breastfeeding; BMI, body mass index; C/S, Caesarean section; HMO, human milk oligosaccharide; NVD, normal vaginal delivery b Those who breastfed ≥12 weeks and provided a milk sample c available for N=1206
  • 21. 3 Table S2. Most abundant bacterial genera (1% mean relative abundance) in the human milk microbiota among 393 mothers in the CHILD cohort related to Figure 1. Lineage Genus Prevalence (%)a Relative abundance (%) Mean±SD CV Range Firmicutes - Streptococcaceae Streptococcus 98.7 16.2 ± 16.7 1.0 87.4 Firmicutes - Staphylococcaceae Staphylococcus 99.8 4.9 ± 11.5 2.4 87.5 Proteobacteria - Oxalobacteraceae Ralstonia 99.2 4.8 ± 2.8 0.6 9.4 Proteobacteria - Comamonadaceae Acidovorax 99.5 3.9 ± 2.3 0.6 13.3 Proteobacteria - Moraxellaceae Acinetobacter 48.6 3.7 ± 12.0 3.2 87.3 Proteobacteria - Comamonadaceae Aquabacterium 99.5 3.2 ± 1.9 0.6 7.6 Proteobacteria - Oxalobacteraceae Massilia 99.8 2.4 ± 1.4 0.6 6.5 Proteobacteria - Rhizobiaceae Agrobacterium 99.2 1.9 ± 1.1 0.6 4.5 Proteobacteria - Uncl. Alteromonadales Rheinheimera 99.5 1.9 ± 1.2 0.6 4.7 Firmicutes - Veillonellaceae Veillonella 78.1 1.5 ± 2.7 1.8 21.0 Proteobacteria - Neisseriaceae Vogesella 99.2 1.2 ± 0.7 0.6 3.0 Actinobacteria - Nocardioidaceae Nocardioides 99.2 1.1 ± 0.6 0.6 2.6 Proteobacteria - Pseudomonadaceae Pseudomonas 33.3 1.0 ± 7.2 6.9 72.8 a Percentage of samples where the taxa was present. CV, coefficient of variation; Uncl, unclassified.
  • 22. 4 Table S3. Core milk microbiotaa among 393 mothers in the CHILD cohort in comparison to the negative controls related to Figure 1. Lineage Genus Samples (n=393) Negative controls (n=15) Mean±SD Maximum Prevalence Prevalence Proteobacteria - Burkholderiales Unclassified 5.86 ± 3.43 12.56 100% 13% Firmicutes - Staphylococcaceae Staphylococcus 4.86 ± 11.5 87.5 100% 20% Proteobacteria - Oxalobacteraceae Ralstonia 4.79 ± 2.76 9.41 100% 7% Proteobacteria - Comamonadaceae Unclassified 4.42 ± 2.58 9.75 100% 7% Proteobacteria - Comamonadaceae Acidovorax 3.95 ± 2.34 13.33 100% 20% Proteobacteria - Oxalobacteraceae Massilia 2.37 ± 1.40 6.47 100% 13% Proteobacteria – Uncl. Alteromonadales Rheinheimera 1.89 ± 1.15 4.74 100% 0 Proteobacteria - Rhizobiaceae Agrobacterium 1.85 ± 1.08 4.51 100% 7% Proteobacteria - Rhodospirillaceae Unclassified 1.61 ± 1.07 5.24 100% 7% Proteobacteria - Neisseriaceae Vogesella 1.23 ± 0.74 3.04 100% 0 Actinobacteria - Nocardioidaceae Nocardioides 1.09 ± 0.65 2.61 100% 13% Proteobacteria - Burkholderiales Unclassified 1.07 ± 0.64 2.63 100% 0 a Defined as amplicon sequence variants (ASVs) present in at least 95% of samples with mean relative abundance of more than 1% after removing potential reagent contaminants. Uncl, unclassified.
  • 23. 5 Table S4. Comparison of milk microbiota composition at family level, by cluster related to Figure 1. Family C1 (n=42) C2 (n=98) C3 (n=161) C4 (n=92) q value Unclassified Alteromonadales 0.08 ± 0.08 0.85 ± 0.4 2.95 ± 0.6 1.98 ± 0.5 0.001 Veillonellaceae 1.18 ± 3.38 2.5 ± 3.8 0.67 ± 1.1 2.2 ± 2.4 c 0.001 Neisseriaceae 0.06 ± 0.05 0.55 ± 0.3 1.9 ± 0.4 1.29 ± 0.3 0.001 Pseudomonadaceae 3.31 ± 11.3 2.40 ± 12.1 0.14 ± 0.9 0.07 ± 0.2 0.007 Oxalobacteraceae 0.38 ± 0.29 3.27 ± 1.5 11.2 ± 1.5 7.37 ± 1.1 0.001 Moraxellaceae 17.8 ± 22.2 6.31 ± 15.6 0.18 ± 1.2 0.75 ± 2.9 0.001 Enterobacteriaceae 7.6 ± 13.9 1.59 ± 4.9 0.31 ± 1.8 0.41 ± 1.8 0.001 Comamonadaceae 0.9 ± 2.1 5.20 ± 2.4 17.9 ± 2.3 11.9 ± 1.8 0.001 Rhizobiaceae 0.1 ± 0.1 0.85 ± 0.38 2.9 ± 0.5 1.91 ± 0.4 0.001 Nocardioidaceae 0.06 ± 0.06 0.49 ± 0.23 1.7 ± 0.3 1.13 ± 0.2 0.001 Streptococcaceae 7.1 ± 17.8 22.8 ± 22.8 9.45 ± 7.2 25.1 ± 12.6 0.001 Staphylococcaceae 1.3 ± 2.1 11.0 ± 20.8 2.48 ± 3.3 4.12 ± 5.6 0.001 Other 60.0 ± 26.8 41.5 ± 22.8 45.6 ± 4.8 40.2 ± 9.9 - Families with 1% overall mean relative abundance are shown. Relative abundances of dominant families within each cluster are in bold. Data is presented as mean ± SD. Relative abundances were compared by one-way analysis of variance (ANOVA).
  • 24. 6 Table S5. Univariate associations of maternal and infant factors with milk microbiota composition and cluster membership among 393 dyads in the CHILD cohort related to Figure 1. p values 0.05 are in bold. Data are presented as mean±SD. Factor Microbiota Cluster Membership a C1 (n = 42) C2 (n = 98) C3 (n = 161) C4 (n = 92) Overall p-value BMI (Kg/m2 ) 25.8 ± 7.4 24.6 ± 4.8 24.2 ± 4.7 23.8 ± 4.5 0.17 Secretor status, n (%) Secretor Non-secretor 30 (71.4) 12 (28.6) 76 (79.2) 20 (20.8) 104 (65.4) 55 (34.6) 69 (75.0) 23 (25.0) 0.10 Ethnicity, n (%) Asian Caucasian First Nation Other 6 (14.2) 33 (78.6) 1 (2.4) 2 (4.8) 21 (21.4) 68 (69.4) 5 (5.1) 4 (4.1) 36 (22.4) 112 (69.6) 6 (3.7) 7 (4.3) 10 (10.9) 74 (80.4) 3 (3.3) 5 (5.4) 0.61 Lactation stage at sample collection (weeks) 17.6 ± 5.2 17.7 ± 6.16 16.8 ± 4.9 17.5 ± 5.3 0.51 Mode of breastfeeding, n (%) Indirect Direct 36 (85.7) 6 (14.3) cde 63 (65.6) 33 (34.4) cfg 83 (52.5) 75 (47.5) dg 43 (47.3) 48 (52.7) ef 0.001 Milk expression b Manual Pump 1 (6.3) 15 (93.7) 6 (19.4) 25 (80.6) 9 (29.6) 31 (70.4) 4 (16.7) 20 (83.3) 0.54 Exclusive breastfeeding at sample collection, n (%) No Yes 29 (69.1) 13 (30.9) g 54 (55.1) 44 (44.9) 74 (46.0) 87 (54.0) g 46 (50.0) 46 (50.0) 0.052 Total HMO (mg/mL) 9.9 ± 1.9 10.6 ± 2.1 10.1 ± 2.1 10.2 ± 2.2 0.18 Insulin (pg/mL) 741 ± 591 788 ± 552 748 ± 687 760 ± 765 0.97 Leptin (pg/mL) 612 ± 615 564 ± 581 554 ± 604 528 ± 617 0.91 Number of older siblings, n (%) None One Two or more 30 (71.4) 9 (21.4) 3 (7.2) gh 54 (55.1) 31 (31.6) 13 (13.3) 81 (50.3) 55 (34.2) 25 (15.5) g 46 (50.0) 31 (33.7) 15 (16.3) h 0.08 Infant sex Female Male 17 (40.5) 25 (59.5) 46 (46.9) 52 (53.1) 90 (55.9) 71 (44.1) 39 (42.4) 53 (57.6) 0.11 Mode of delivery Vaginal Caesarean section - emergency Caesarean section - elective 29 (69.1) 9 (21.4) 4 (9.5) 68 (80.0) 11 (12.9) 6 (7.1) 127 (79.3) 19 (11.9) 14 (8.8) 70 (77.8) 8 (8.9) 12 (13.3) 0.22 a Associations were tested by ANOVA (Tukey post hoc) for continuous and χ2 (post hoc) for categorical variables. b n= 112. Method of milk expression was not systematically captured, but was analyzed for samples where it was noted. The frequency is calculated in the subset with available data. c, d, e, f p0.05 for overall and pairwise comparison of clusters. gh p0.1. Same superscript denotes pairwise significant difference. Not Shown: Maternal age, history of atopy, infant birth weight, gestational age, intrapartum antibiotics, and antibiotics before the time of sample collection by mother or child were not significantly associated with the clusters. BMI, body mass index; HMO, human milk oligosaccharide
  • 25. 7 Table S6. Factors not associated with milk microbiota α diversity among 393 mothers in the CHILD cohort related to Table 1. Factor n (%) Observed ASVs Inverse Simpson Maternal age (years) 20-30 30-40 40 100 (25.3) 270 (68.4) 25 (6.3) 149 ± 43 147 ± 44 140 ± 42 16.1 ± 9.0 15.8 ± 8.7 14.5 ± 9.7 Maternal weight class Normal Overweight/obese 260 (65.8) 135 (34.2) 147 ± 43 146 ± 45 15.9 ± 8.8 15.6 ± 8.9 Maternal ethnicity Caucasian Asian First Nation Other 276 (73.6) 70 (18.7) 15 (4.0) 14 (3.7) 148 ± 45 139 ± 38 148 ± 56 153 ± 33 15.9 ± 8.9 15.3 ± 8.5 16.4 ± 10.5 16.0 ± 7.4 Maternal atopy No Yes 134 (35.7) 241 (64.3) 142 ± 44 150 ± 43 15.2 ± 9.1 16.1 ± 8.7 Maternal secretor status Secretor Non-secretor 269 (71.7) 106 (28.3) 147 ± 43 145 ± 40 15.4 ± 8.8 16.6 ± 8.7 Maternal ever smoking No Yes 307 (77.7) 88 (22.3) 147 ± 42 145 ± 48 15.9 ± 8.8 15.4 ± 9.2 Maternal prenatal smoking No Yes 377 (95.4) 18 (4.6) 147 ± 43 140 ± 61 15.9 ± 8.9 12.6 ± 8.3 Lactation stage (weeks) 10-15 15-21 21-27 27-32 32 175 (44.5) 133 (33.8) 56 (14.2) 21 (5.4) 8 (2.1) 149 ± 45 144 ± 39 142 ± 47 152 ± 50 144 ± 26 16.1 ± 8.9 15.4 ± 8.8 14.9 ± 8.9 17.5 ± 9.6 14.2 ± 5.5 Univariate linear regression, all p 0.05 Sample processing time, HMO diversity, or total HMO concentration were also not significantly associated with α diversity (not shown).
  • 26. 8 Table S7. Comparison the equivalent models of the final structural equation model related to Figure 4. See also Figure S5. Model Difference from final model Df χ2 p value CFI RMSEA (90% CI) SRMR AIC Final model Causative effect of milk on microbiota 40 0.247 0.985 0.019 (0.00 – 0.042) 0.040 11401 A Causative effect of microbiota on milk 40 0.251 0.985 0.019 (0.00 – 0.042) 0.040 11401 B Milk environment and microbiota correlation 40 0.247 0.985 0.019 (0.00 – 0.042) 0.040 11401 C Effect of BMI on milk removed 41 0.001 0.404 0.119 (0.106 – 0.133) 0.108 11614 D Effect of mode of breastfeeding on the milk environment 40 0.028 0.949 0.035 (0.012 – 0.054) 0.046 11414 E Effect of maternal diet on MFA 38 0.210 0.982 0.022 (0.00 – 0.044) 0.040 11404 F Direct effect of HMO on microbiota 39 0.241 0.984 0.020 (0.00 – 0.043) 0.040 11402 AIC, Akaike information criterion; BMI, body mass index; CFI, comparative fix index; CI, confidence interval; HMO, human milk oligosaccharide; MFA, milk fatty acid; RSMEA, root mean square error of approximation; SRMR, standardized root mean residuals. Indications of poor model fit are in bold: χ2 p-value 0.05, CFI 0.9, RMSEA 0.05, and SRMR0.08
  • 27. 9 Figure S1. Data quality control related to STAR Methods. A) Milk microbiota β diversity by sample type, sequencing run, and PCR plates, prior to removal of potential contaminant ASVs using the decontam package. β diversity was assessed on Bray-Curtis dissimilarity and tested by PERMANOVA. There was a significant difference based on sample type but not sequencing runs or PCR plates. Comparison of B) Sequencing depth and C) Composition of the top 500 most abundant ASVs before and after contaminant removal. D) Relative abundance of most abundant bacterial genera (1% mean relative abundance) in the mock community in comparison with the theoretical composition, each bar represents a replicate. E) Sequencing output processing to remove low abundance ASVs. The 393 individual samples are on the X axis and relative abundances of the sums of sequence reads per sample are plotted along the Y axis. The initial ASV table following contaminant removal contained 8145 ASVs. Following exclusion of ASVs with less than 20 reads across the entire dataset, 1,972 ASVs remained. Exclusion of ASVs with less than 0.01% and 1% relative abundance resulted in 301 and 22 remaining ASVs, respectively. Analyses have been performed on the 1,972 ASVs with 20 reads in total, unless stated otherwise. N samples = 428, N mock =18, N negative control =15, Sequencingreads persample(x103 ) Totalsequence reads(x106 ) Before contaminant removal After contaminant removalB) C) Mock Negative Sample Mock Negative Sample Mock Negative Sample p=0.001 Sample type Sequencing run PCR Plates NS NS A) Theoretical composition Observed composition in mock community replicates RelativeAbundance(%) D) E) RelativeAbundance(%)
  • 28. 10 Figure S2. Hierarchical clustering of core milk microbiota among 393 mothers in the CHILD cohort related to Figure 1. The optimum numbers of clusters in our data were determined by Gap statistics. According to the gap statistics, there are four main clusters. A) Gap statistics plot, B) heterogeneity of clusters in terms of the milk microbiota compositional dispersion, C) PCoA plot on Bray-Curtis dissimilarity among ASVs with more than 0.01% mean relative abundance (n=301). β diversity between clusters was assessed by PERMANOVA; p- values are shown in panels B and C. A) B) C) ASVs 0.01% mean relative abundance p overall 0.001 p pairwise 0.001 R2 = 0.33 p overall 0.001
  • 29. 11 Figure S3. Equivalent structural equation models assessing other potentially plausible models of associations of milk microbiota determinants among 393 mothers in the CHILD cohort related to Figure 4. Compared to the final model depicted in Figure 3B, these models assessed: A) causative effect of milk microbiota on milk environment, B) correlation of milk microbiota and milk microenvironment, C) only direct effect of BMI on milk microbiota retained, D) effect of mode of breastfeeding on the milk environment, E) maternal diet effect on milk fatty acids, F) direct effect of HMOs on milk microbiota. Standardized β coefficients are reported. Abbreviations: mlk, milk environment; MFA, milk fatty acid PC1; INS, insulin; LEP, leptin; HMO, human milk oligosaccharide PC1; microbiota, milk microbiota PC1; BMI, maternal body mass; DEL, mode of delivery; SEX, infant sex; MOD: mode of breastfeeding; DRC1 and DRC2, maternal diet PC1 and PC2. * p0.05, ** p0.01. Green (positive), red (negative). See also Table S7. ** *** ** ****** **** ** **** ** ** *** A) B) C) ** Micro- biota Micro- biota Micro- biota * ** **** * * * F) Micro- biota ** **** * *** D) ** ** ** **** * ** ** ** ** ** *** E) Micro- biota Micro- biota ** * ** *
  • 30. 12 Figure S4. Expressed milk microbiota is influenced by collection method related to Figure 5. A) α diversity, B) β diversity. B) Direct Only Some Indirect Direct Only Some Indirect A)