
Empfohlen
Weitere ähnliche Inhalte
Was ist angesagt?
Was ist angesagt? (20)
Ähnlich wie Shell Q3 2008 Qra
Ähnlich wie Shell Q3 2008 Qra (20)
Mehr von earningsreport
Mehr von earningsreport (20)
Kürzlich hochgeladen
Kürzlich hochgeladen (20)
Shell Q3 2008 Qra
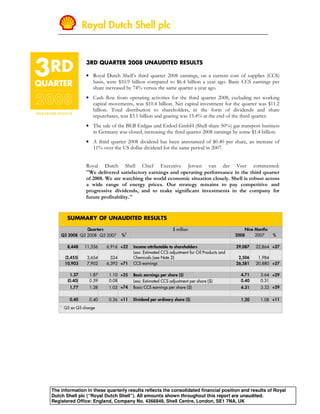
- 1. Royal Dutch Shell plc 3RD QUARTER 2008 UNAUDITED RESULTS • Royal Dutch Shell’s third quarter 2008 earnings, on a current cost of supplies (CCS) basis, were $10.9 billion compared to $6.4 billion a year ago. Basic CCS earnings per share increased by 74% versus the same quarter a year ago. • Cash flow from operating activities for the third quarter 2008, excluding net working capital movements, was $10.4 billion. Net capital investment for the quarter was $11.2 billion. Total distribution to shareholders, in the form of dividends and share repurchases, was $3.1 billion and gearing was 15.4% at the end of the third quarter. • The sale of the BEB Erdgas und Erdoel GmbH (Shell share 50%) gas transport business in Germany was closed, increasing the third quarter 2008 earnings by some $1.4 billion. • A third quarter 2008 dividend has been announced of $0.40 per share, an increase of 11% over the US dollar dividend for the same period in 2007. Royal Dutch Shell Chief Executive Jeroen van der Veer commented: quot;We delivered satisfactory earnings and operating performance in the third quarter of 2008. We are watching the world economic situation closely. Shell is robust across a wide range of energy prices. Our strategy remains to pay competitive and progressive dividends, and to make significant investments in the company for future profitability.quot; SUMMARY OF UNAUDITED RESULTS Quarters $ million Nine Months Q3 2008 Q2 2008 Q3 2007 %1 2008 2007 % 8,448 11,556 6,916 +22 Income attributable to shareholders 29,087 22,864 +27 Less: Estimated CCS adjustment for Oil Products and (2,455) 3,654 524 Chemicals (see Note 2) 2,506 1,984 10,903 7,902 6,392 +71 CCS earnings 26,581 20,880 +27 1.37 1.87 1.10 +25 Basic earnings per share ($) 4.71 3.64 +29 (0.40) 0.59 0.08 Less: Estimated CCS adjustment per share ($) 0.40 0.31 1.77 1.28 1.02 +74 Basic CCS earnings per share ($) 4.31 3.33 +29 0.40 0.40 0.36 +11 Dividend per ordinary share ($) 1.20 1.08 +11 1 Q3 on Q3 change The information in these quarterly results reflects the consolidated financial position and results of Royal Dutch Shell plc (“Royal Dutch Shell”). All amounts shown throughout this report are unaudited. Registered Office: England, Company No. 4366849, Shell Centre, London, SE1 7NA, UK
- 2. Royal Dutch Shell plc 2 KEY FEATURES OF THE THIRD QUARTER 2008 • Third quarter 2008 CCS earnings were $10,903 million or 71% higher than in the same quarter a year ago. • Third quarter 2008 reported income was $8,448 million or 22% higher than in the same quarter a year ago. • Oil Products earnings reflected some $400 million of non-cash gains related to fair value accounting of commodity derivatives. In addition Gas & Power earnings reflected non-cash gains of some $400 million related to fair value accounting of commodity derivatives associated with long-term contracts (see Note 8). • Basic CCS earnings per share increased by 74% versus the same quarter a year ago. • Total cash returned to shareholders in the form of dividends and share repurchases in the third quarter 2008 was $3.1 billion. • Cash flow from operating activities, excluding net working capital movements, was $10.4 billion compared to $9.9 billion for the same quarter last year. Including net working capital movements, cash flow from operating activities was $12.6 billion compared to $9.1 billion in the third quarter 2007. • Capital investment for the third quarter 2008 was $13.2 billion, including an amount of $5.0 billion related to the acquisition of Duvernay Oil Corp. (“Duvernay”). Net capital investment (capital investment, less divestment proceeds) for the third quarter 2008 was $11.2 billion. • Return on average capital employed (ROACE), on a reported income basis (see Note 3), was 26.3%. • Gearing (see Note 5) was 15.4% at the end of the third quarter 2008 versus 12.1% at the end of the third quarter 2007. • Oil and gas production, including oil sands bitumen production, for the third quarter 2008 was 2,931 thousand barrels of oil equivalent per day (boe/d), compared to 3,137 thousand boe/d in the same quarter last year. Production when compared to the third quarter 2007 was reduced by some 120 thousand boe/d due to hurricane impacts in the Gulf of Mexico, USA and a planned maintenance turnaround in the UK North Sea related to the shutdown of the St. Fergus gas processing facilities. Excluding these factors and the impact of divestments and production sharing contracts (PSC) pricing effects, production was 1% lower than the same quarter last year. • Liquefied Natural Gas (LNG) sales volumes of 3.10 million tonnes were 6% lower than in the same quarter a year ago. • Oil Products refinery availability was 88%, compared to 93% in the third quarter 2007. Chemicals manufacturing plant availability was 86%, 8% lower than in the third quarter 2007. Oil Products and Chemicals availability was significantly impacted by the hurricanes in the USA. Oil Sands upgrader availability was 96%, 6% higher than in the same quarter last year. • Oil Products marketing sales volumes in the third quarter 2008 decreased by 3% compared to the same quarter last year, and, excluding the impact of divestments, were in line with the same quarter last year. Chemical product sales volumes decreased by 13% compared to the third quarter 2007. SUMMARY OF UNAUDITED RESULTS Quarters $ million Nine Months Q3 2008 Q2 2008 Q3 2007 %1 2008 2007 % 5,501 5,881 3,327 Exploration & Production2 16,525 9,819 2,774 625 568 Gas & Power 4,347 2,150 371 351 183 Oil Sands2 971 500 2,304 1,075 1,651 Oil Products (CCS basis) 4,573 6,075 116 (142) 360 Chemicals (CCS basis) 175 1,334 (43) 201 413 Corporate 304 1,391 (120) (89) (110) Minority interest (314) (389) 10,903 7,902 6,392 +71 CCS earnings 26,581 20,880 +27 1 Q3 on Q3 change 2 As from the fourth quarter 2007, the earnings of the Oil Sands operations, which were previously reported as part of the Exploration & Production segment, are disclosed as a separate business segment. For comparison purposes, the Exploration & Production earnings up to the third quarter 2007 have been reclassified by the amounts reported under the Oil Sands segment.
- 3. Royal Dutch Shell plc 3 SUMMARY OF IDENTIFIED ITEMS Earnings in the third quarter 2008 reflected the following items, which in aggregate amounted to a net gain of $2,063 million (compared to a net gain of $265 million in the third quarter 2007), as summarised in the table below: • Exploration & Production earnings included a gain of $575 million, reflecting a gain from divestments of $347 million, a gain of $167 million related to the mark-to-market valuation of certain UK gas contracts, a tax credit in Canada of $22 million and a gain from a pension accounting adjustment of $39 million. Earnings for the third quarter 2007 included a net gain of $130 million. • Gas & Power earnings included a net gain of $1,368 million, reflecting a gain from a divestment of $1,395 million, a gain of $33 million related to the mark-to-market valuation of certain gas contracts and a gain from a pension accounting adjustment of $7 million, which were partly offset by an impairment charge of $67 million. Earnings for the third quarter 2007 included a net charge of $4 million. • Oil Sands earnings included a gain of $25 million related to a tax credit. • Oil Products earnings included a gain of $77 million, reflecting a gain of $25 million related to a tax credit in Canada and a gain from a pension accounting adjustment of $52 million. Earnings for the third quarter 2007 included a net gain of $121 million. • Chemicals earnings included a gain from a pension accounting adjustment of $18 million. Earnings for the third quarter 2007 included a net gain of $18 million. SUMMARY OF IDENTIFIED ITEMS Quarters $ million Nine Months Q3 2008 Q2 2008 Q3 2007 2008 2007 Segment earnings impact of identified items: 575 98 130 Exploration & Production 607 387 1,368 - (4) Gas & Power 1,357 282 25 - - Oil Sands 25 - 77 181 121 Oil Products (CCS basis) 258 150 18 (206) 18 Chemicals (CCS basis) (188) 18 - - - Corporate - 459 - - - Minority interest - - 2,063 73 265 CCS earnings impact 2,059 1,296 These identified items generally relate to events with an impact of greater than $50 million on Royal Dutch Shell’s earnings and are shown to provide additional insight into its segment earnings, CCS earnings and income attributable to shareholders. Further additional comments on the business segments are provided in the section ‘Earnings by business segment’ on page 4 and onwards. Commodity price effects (see Note 8 - Accounting for Derivatives) During the third quarter 2008 worldwide oil and gas related commodity marker prices declined significantly. As a result of fair value accounting of commodity derivatives associated with long-term contracts, required under International Financial Reporting Standards (IFRS), Gas & Power earnings were increased by some $400 million, as opposed to non-cash charges of some $300 million recorded in the second quarter 2008. As required under IFRS, commodity derivatives are recorded at fair value, which is based on market prices, and physical crude oil and oil products inventories are recorded at the lower of historical cost or net realizable value. During the third quarter 2008, Oil Products earnings were increased by non-cash gains of some $400 million, mainly related to reversals of non-cash charges of some $450 million recorded in the second quarter 2008.
- 4. Royal Dutch Shell plc 4 EARNINGS BY BUSINESS SEGMENT EXPLORATION & PRODUCTION Quarters $ million Nine Months Q3 2008 Q2 2008 Q3 2007 %1 2008 2007 % 5,501 5,881 3,327 +65 Segment earnings2 16,525 9,819 +68 1,612 1,711 1,792 -10 Crude oil production (thousand b/d) 3 1,692 1,824 -7 7,207 7,789 7,329 -2 Natural gas production available for sale (million scf/d) 8,246 7,886 +5 2,854 3,054 3,055 -7 Barrels of oil equivalent (thousand boe/d) 3 3,114 3,183 -2 1 Q3 on Q3 change 2 As from the fourth quarter 2007, the earnings of the Oil Sands operations, which were previously reported as part of the Exploration & Production segment, are disclosed as a separate business segment. For comparison purposes, the Exploration & Production earnings up to the third quarter 2007 have been reclassified by the amounts reported under the Oil Sands segment. 3 Excludes oil sands bitumen production Third quarter Exploration & Production segment earnings were $5,501 million compared to $3,327 million a year ago. Earnings included a gain of $575 million related to identified items, compared to a net gain of $130 million in the third quarter 2007 (see page 3 for details). Earnings compared to the third quarter 2007 reflected the benefit of higher oil and gas prices on revenues, which was partly offset by lower production volumes, particularly in the USA as a consequence of hurricane impacts, higher exploration expenses and higher royalty expenses. Global liquids realisations were 57% higher than in the third quarter 2007, compared with marker crudes Brent and WTI increases of 54% and 57% respectively. Global gas realisations were 48% higher than a year ago. Outside the USA, gas realisations increased by 45% whereas in the USA gas realisations increased by 66%. Third quarter 2008 production (excluding oil sands bitumen production) was 2,854 thousand barrels of oil equivalent per day (boe/d) compared to 3,055 thousand boe/d a year ago. Crude oil production was down 10% and natural gas production was down 2% compared to the third quarter 2007. Production, compared to the third quarter 2007, was impacted by some 120 thousand boe/d as a consequence of the hurricanes in the USA Gulf of Mexico and planned maintenance turnarounds in the UK North Sea related to the shutdown of the St. Fergus gas processing facilities. Production compared to the third quarter 2007 included additional volumes principally from Ormen Lange (Shell share 17%) in Norway, Changbei (Shell share 50%) in China, West Salym (Shell share 50%) in Russia, F13W (Shell share 50%) and M3S (Shell share 70%) in Malaysia, Stybarrow (Shell share 17.1%) in Australia, Champion West Phase 3B/C (Shell share 50%) in Brunei, Starling (Shell share 28%), Caravel (Shell share 71%), Shamrock (Shell share 100%) and Curlew C (Shell share 100%) in the United Kingdom and Deimos (Shell share 71.5%) in the USA. Third quarter portfolio developments In Canada, Shell completed the acquisition of Duvernay, which is a Canadian tight gas company, for $5.5 billion. During 2008 Shell has also acquired significant additional acreage in the Montney gas play, in areas adjacent to Duvernay's positions, bringing Shell's total spend on tight gas acreage in the area to $6.2 billion in 2008. Shell estimates that this combined portfolio of approximately 2 thousand square kilometres contains discovered gas resources of some 1 billion boe, with significant additional exploration potential. In Australia, Shell concluded the agreement with Arrow Energy Ltd. to jointly develop projects to extract clean-burning natural gas from coal deposits. In the UK, Shell announced the start-up of the Curlew C field (Shell share 100%), the fourth North Sea field brought on stream during 2008. Together, these fields have an expected aggregate peak production capacity of some 30 thousand boe/d (Shell share).
- 5. Royal Dutch Shell plc 5 In the Netherlands, Shell, through its joint venture Nederlandse Aardolie Maatschappij BV (Shell share 50%), signed Sales and Purchase Agreements for some €1.1 billion for the sale of assets situated along the NOGAT pipeline, covering exploration, production and transportation of oil and gas. The transaction is subject to regulatory approvals and third party consents. In the USA Gulf of Mexico deepwater, Shell concluded the sale of its interest in the Big Foot prospect (Shell share 12.5%), for some $0.4 billion. Also in the USA, a 30 thousand boe/d water injection project commenced at the Ursa/Princess field (Shell share 45%). The project is expected to continue for the next 30 years, extending the life of the field by some 10 years. GAS & POWER Quarters $ million Nine Months Q3 2008 Q2 2008 Q3 2007 %1 2008 2007 % 2,774 625 568 +388 Segment earnings 4,347 2,150 +102 3.10 3.08 3.29 -6 LNG sales volumes (million tonnes) 9.69 9.84 -2 1 Q3 on Q3 change Third quarter Gas & Power segment earnings were $2,774 million compared to $568 million a year ago. Earnings included a net gain of $1,368 million related to identified items, compared to a net charge of $4 million in the third quarter 2007 (see page 3 for details). In addition, third quarter 2008 earnings were increased by non-cash gains of approximately $400 million as a result of fair value accounting of commodity derivatives associated with long-term contracts (see Note 8). Earnings compared to the third quarter 2007 reflected the impact of strong LNG and gas to liquids (GTL) product prices on revenues and higher marketing and trading contributions, which were partly offset by lower LNG sales volumes. LNG sales volumes of 3.10 million tonnes were 6% lower than in the same quarter a year ago, mainly as a consequence of planned maintenance shutdowns and changed cargo lifting schedules compared to the same quarter last year. Marketing and trading earnings, non-LNG related, were higher than in the same quarter a year ago, reflecting increased earnings both in North America and Europe. Third quarter portfolio developments In Germany, the sale of the BEB Erdgas und Erdoel GmbH gas transport business (Shell share 50%), was closed on July 1, 2008. In Iraq, Shell and the Iraqi Ministry of Oil have signed a heads of agreement to establish an incorporated joint venture (Shell share 49%) to process and market natural gas in southern Iraq. In Australia, construction was completed at the North West Shelf Train 5 (Shell share 22%) with a capacity of 4.4 mtpa (100% basis). In the USA, the 164 Megawatt (MW) Mount Storm Phase I wind farm (Shell share 50%) in West Virginia became operational. Also in Germany, construction of the 20 MW Avancis thin-film solar pilot plant (Shell share 50%) was completed. Commercial sales are expected to begin around the end of 2008.
- 6. Royal Dutch Shell plc 6 OIL SANDS Quarters $ million Nine Months Q3 2008 Q2 2008 Q3 2007 %1 2008 2007 % 371 351 183 +103 Segment earnings 971 500 +94 77 72 82 -6 Bitumen production (thousand b/d) 78 90 -13 97 104 121 -20 Sales volumes (thousand b/d) 115 134 -14 96 96 90 Upgrader availability (%) 95 93 1 Q3 on Q3 change Third quarter Oil Sands segment earnings were $371 million compared to $183 million in the same quarter last year. Earnings included a gain of $25 million related to an identified item (see page 3 for details). Earnings compared to the third quarter 2007 reflected the impact of higher oil prices on revenues, which was partly offset by lower production volumes, higher operating costs and higher royalty expenses. Bitumen production decreased by 6% compared to the same quarter last year. Upgrader availability was 96% compared to 90% in the same quarter last year. OIL PRODUCTS Quarters $ million Nine Months Q3 2008 Q2 2008 Q3 2007 %1 2008 2007 % (44) 4,539 2,153 Segment earnings 6,862 7,883 (2,348) 3,464 502 Less: Estimated CCS adjustment (see note 2) 2,289 1,808 2,304 1,075 1,651 +40 Segment CCS earnings 4,573 6,075 -25 3,273 3,464 3,887 -16 Refinery intake (thousand b/d) 3,476 3,768 -8 6,403 6,642 6,756 -5 Total Oil Products sales (thousand b/d) 6,625 6,552 +1 88 92 93 Refinery availability (%) 91 91 1 Q3 on Q3 change Third quarter Oil Products segment results were a loss of $44 million compared to earnings of $2,153 million for the same period last year. Third quarter Oil Products CCS segment earnings were $2,304 million compared to $1,651 million in the third quarter 2007. Earnings included a gain of $77 million related to identified items, compared to a net gain of $121 million in the third quarter 2007 (see page 3 for details). In addition, third quarter 2008 earnings increased by non-cash gains of around $400 million as a result of fair value accounting of commodity derivatives (see Note 8). CCS earnings compared to the third quarter 2007 reflected higher marketing margins, higher realised refining margins and trading contributions, which were partly offset by increased operating costs, lower refinery intake and net currency exchange rate impacts.
- 7. Royal Dutch Shell plc 7 Industry refining margins compared to the same quarter a year ago were higher in Europe and declined in the US Gulf Coast, US West Coast and the Asia-Pacific region. Refinery availability was 88%, compared to 93% in the third quarter of 2007. The decrease mainly reflects hurricane impacts in the US Gulf Coast region. Marketing earnings compared to the same period a year ago increased due to higher B2B margins, which were partly offset by lower retail earnings and lower finished lubricants margins. Oil Products (marketing and trading) sales volumes decreased by 5% compared to the same quarter last year. Marketing sales volumes were 3% lower than in the third quarter 2007, and, excluding the impact of divestments, were in line with the same quarter last year. Third quarter portfolio developments In Canada, Shell announced an increase in its shareholding in Iogen Energy Corporation from 26.3% to 50%, contributing to its strategic investment and development programme in biofuels. CHEMICALS Quarters $ million Nine Months Q3 2008 Q2 2008 Q3 2007 %1 2008 2007 % (79) 157 397 Segment earnings 426 1,550 (195) 299 37 Less: Estimated CCS adjustment (see note 2) 251 216 116 (142) 360 -68 Segment CCS earnings 175 1,334 -87 4,989 5,396 5,702 -13 Sales volumes (thousand tonnes) 15,844 16,922 -6 86 95 94 Manufacturing plant availability (%) 92 92 1 Q3 on Q3 change Third quarter Chemicals segment results were a loss of $79 million compared to earnings of $397 million for the same period last year. Third quarter Chemicals CCS segment earnings were $116 million compared to $360 million in the same quarter last year. Earnings included a gain of $18 million related to an identified item, compared to a gain of $18 million in the third quarter 2007 (see page 3 for details). CCS earnings compared to the third quarter 2007 reflected lower realised margins, lower sales volumes, lower income from equity-accounted investments and an impairment charge. Sales volumes decreased by 13% when compared to the third quarter 2007 as a result of lower global demand and the impact of the hurricanes in the US Gulf Coast region. Chemicals manufacturing plant availability was 86%, some 8% lower than in the third quarter 2007, mainly as a consequence of hurricane impacts in the USA.
- 8. Royal Dutch Shell plc 8 CORPORATE Quarters $ million Nine Months Q3 2008 Q2 2008 Q3 2007 2008 2007 (43) 201 413 Segment earnings 304 1,391 Third quarter Corporate segment results were a loss of $43 million compared to earnings of $413 million for the same period last year. Earnings compared to the third quarter 2007 reflected currency exchange losses, higher shareholder costs, lower tax credits and lower net underwriting results, mainly as a consequence of hurricane impacts in the USA, which were partly offset by higher net interest income.
- 9. Royal Dutch Shell plc 9 PRICE AND MARGIN INFORMATION OIL & GAS Quarters Nine Months Q3 2008 Q2 2008 Q3 2007 2008 2007 Realised oil prices – Exploration & Production1 $/bbl $/bbl (period average) 110.08 110.96 70.88 World outside USA 103.88 63.68 119.25 118.07 70.34 USA 108.77 60.72 111.18 111.92 70.81 Global 104.54 63.23 $/bbl Realised oil prices – Oil Sands (period average) $/bbl 113.90 116.20 69.31 Canada 102.60 59.67 $/thousand scf Realised gas prices (period average) $/thousand scf 8.89 9.38 6.69 Europe 9.10 6.86 5.91 6.31 4.07 World outside USA (including Europe) 6.03 4.27 10.82 11.89 6.53 USA 10.73 7.16 6.77 7.30 4.57 Global 6.87 4.84 Oil and gas marker industry prices (period average) 115.15 121.26 74.84 Brent ($/bbl) 111.02 67.15 118.07 123.81 75.24 WTI ($/bbl) 113.25 66.06 117.88 125.18 77.14 Edmonton Par ($/bbl) 113.76 66.86 9.11 11.36 6.14 Henry Hub ($/MMBtu) 9.67 6.94 61.75 60.41 30.68 UK National Balancing Point (pence/therm) 58.40 24.39 133.33 110.24 70.95 Japanese Crude Cocktail – JCC ($/bbl)2 109.60 64.42 REFINING & CRACKER INDUSTRY MARGINS3 Quarters Nine Months Q3 2008 Q2 2008 Q3 2007 2008 2007 Refining marker industry gross margins $/bbl $/bbl (period average) 7.20 11.55 8.05 ANS US West Coast coking margin 9.30 17.75 11.40 10.55 15.40 WTS US Gulf Coast coking margin 10.20 18.45 6.00 5.85 3.50 Rotterdam Brent complex 5.15 4.50 1.85 3.95 2.50 Singapore 80/20 Arab light/Tapis complex 2.55 3.05 $/tonne Cracker industry margins (period average) $/tonne 519.00 413.00 352.00 US ethane 430.00 334.00 563.00 262.00 469.00 Western Europe naphtha 419.00 472.00 114.00 92.00 272.00 North East Asia naphtha 87.00 309.00 1 As from the fourth quarter 2007, the Oil Sands operations, which were previously reported as part of the Exploration & Production segment, are disclosed as a separate business segment. For comparison purposes, the Exploration & Production realised oil prices up to the third quarter 2007 have been reclassified. 2 JCC prices for the third quarter and nine months 2008 are based on available market data up to the end of July 2008. Prices for these periods will be updated when full market data are available. 3 The refining and cracker industry margins shown above do not represent actual Shell realised margins for the periods. These are estimated industry margins based on available market information at the end of the quarter.
- 10. Royal Dutch Shell plc 10 OIL & GAS – OPERATIONAL DATA Quarters Nine Months Q3 2008 Q2 2008 Q3 2007 %1 2008 2007 % thousand b/d Crude oil production thousand b/d 335 390 406 Europe 380 432 305 314 333 Africa 314 326 200 196 214 Asia Pacific 201 227 459 434 445 Middle East, Russia, CIS 440 431 231 293 314 USA 275 328 82 84 80 Other Western Hemisphere 82 80 1,612 1,711 1,792 -10 Total crude oil production excluding oil sands 1,692 1,824 -7 77 72 82 Bitumen production – oil sands 78 90 1,689 1,783 1,874 -10 Total crude oil production including oil sands 1,770 1,914 -8 million scf/d2 Natural gas production available for sale million scf/d2 2,446 2,930 2,231 Europe 3,420 2,939 591 549 623 Africa 586 581 2,508 2,512 2,587 Asia Pacific 2,486 2,486 229 230 248 Middle East, Russia, CIS 230 253 942 1,096 1,131 USA 1,047 1,128 491 472 509 Other Western Hemisphere 477 499 7,207 7,789 7,329 -2 8,246 7,886 +5 thousand boe/d3 Total production in barrels of oil equivalent thousand boe/d3 757 895 790 Europe 970 939 407 409 440 Africa 415 426 631 629 660 Asia Pacific 629 656 499 474 488 Middle East, Russia, CIS 480 474 393 482 509 USA 456 522 167 165 168 Other Western Hemisphere 164 166 2,854 3,054 3,055 -7 Total production excluding oil sands 3,114 3,183 -2 77 72 82 Bitumen production – oil sands 78 90 2,931 3,126 3,137 -7 Total production including oil sands 3,192 3,273 -2 1 Q3 on Q3 change 2 scf/d = standard cubic feet per day; 1 standard cubic foot = 0.0283 cubic metre 3 Natural gas converted to oil equivalent at 5.8 million scf/d = thousand boe/d
- 11. Royal Dutch Shell plc 11 OIL PRODUCTS AND CHEMICALS – OPERATIONAL DATA Quarters Nine Months Q3 2008 Q2 2008 Q3 2007 % 1 2008 2007 % thousand b/d Refinery processing intake thousand b/d 1,462 1,498 1,813 Europe 1,566 1,705 674 741 852 Other Eastern Hemisphere 724 808 777 874 851 USA 832 883 360 351 371 Other Western Hemisphere 354 372 3,273 3,464 3,887 -16 3,476 3,768 -8 Oil sales 2,028 2,067 2,176 Gasolines 2,061 2,221 810 816 768 Kerosenes 813 740 2,231 2,225 2,396 Gas/diesel oils 2,264 2,250 623 776 699 Fuel oil 745 682 711 758 717 Other products 742 659 6,403 6,642 6,756 -5 Total oil products * 6,625 6,552 +1 *Comprising: 1,795 1,781 1,903 Europe 1,845 1,855 1,262 1,276 1,279 Other Eastern Hemisphere 1,261 1,254 1,366 1,436 1,544 USA 1,399 1,488 718 704 676 Other Western Hemisphere 726 669 1,262 1,445 1,354 Export sales 1,394 1,286 thousand tonnes Chemical sales volumes by main product category 2** thousand tonnes 2,809 3,061 3,302 Base chemicals 8,989 9,804 2,178 2,333 2,399 First line derivatives 6,849 7,110 2 2 1 Other 6 8 4,989 5,396 5,702 -13 15,844 16,922 -6 **Comprising: 2,112 2,189 2,225 Europe 6,590 6,718 1,223 1,294 1,376 Other Eastern Hemisphere 3,745 4,009 1,512 1,760 1,923 USA 5,056 5,667 142 153 178 Other Western Hemisphere 453 528 1 Q3 on Q3 change 2 Excluding volumes sold by equity-accounted investments, chemical feedstock trading and by-products.
- 12. Royal Dutch Shell plc 12 NOTE All amounts shown throughout this Report are unaudited. In this announcement, excluding in the financial statements, we have aggregated our equity position in projects for both direct and indirect interest (for example, we have aggregated our indirect interest in North West Shelf LNG and the Pluto project via our 34% shareholding in Woodside Energy Ltd). Fourth quarter and full year 2008 results are expected to be announced on January 29, 2009. First quarter results for 2009 are expected to be announced on April 29, 2009, second quarter results are expected to be announced on July 30, 2009 and third quarter results are expected to be announced on October 29, 2009. There will be a Shell strategy update on March 17, 2009. In this document “Shell”, “Shell group” and “Royal Dutch Shell” are sometimes used for convenience where references are made to Royal Dutch Shell plc and its subsidiaries in general. Likewise, the words “we”, “us” and “our” are also used to refer to subsidiaries in general or to those who work for them. These expressions are also used where no useful purpose is served by identifying the particular company or companies. ‘‘Subsidiaries’’, “Shell subsidiaries” and “Shell companies” as used in this document refer to companies in which Royal Dutch Shell plc either directly or indirectly has control, by having either a majority of the voting rights or the right to exercise a controlling influence. The companies in which Shell has significant influence but not control are referred to as “associated companies” or “associates” and companies in which Shell has joint control are referred to as “jointly controlled entities”. In this document, associates and jointly controlled entities are also referred to as “equity- accounted investments”. This document contains forward-looking statements concerning the financial condition, results of operations and businesses of Royal Dutch Shell. All statements other than statements of historical fact are, or may be deemed to be, forward-looking statements. Forward-looking statements are statements of future expectations that are based on management’s current expectations and assumptions and involve known and unknown risks and uncertainties that could cause actual results, performance or events to differ materially from those expressed or implied in these statements. Forward-looking statements include, among other things, statements concerning the potential exposure of Royal Dutch Shell to market risks and statements expressing management’s expectations, beliefs, estimates, forecasts, projections and assumptions. These forward-looking statements are identified by their use of terms and phrases such as “anticipate”, “believe”, “could”, “estimate”, “expect”, “intend”, “may”, “plan”, “objectives”, “outlook”, “probably”, “project”, “will”, “seek”, “target”, “risks”, “goals”, “should” and similar terms and phrases. There are a number of factors that could affect the future operations of Royal Dutch Shell and could cause those results to differ materially from those expressed in the forward-looking statements included in this document, including (without limitation): (a) price fluctuations in crude oil and natural gas; (b) changes in demand for Shell’s products; (c) currency fluctuations; (d) drilling and production results; (e) reserve estimates; (f) loss of market and industry competition; (g) environmental and physical risks; (h) risks associated with the identification of suitable potential acquisition properties and targets, and successful negotiation and completion of such transactions; (i) the risk of doing business in developing countries and countries subject to international sanctions; (j) legislative, fiscal and regulatory developments including potential litigation and regulatory effects arising from recategorisation of reserves; (k) economic and financial market conditions in various countries and regions; (l) political risks, including the risks of expropriation and renegotiation of the terms of contracts with governmental entities, delays or advancements in the approval of projects and delays in the reimbursement for shared costs; and (m) changes in trading conditions. All forward-looking statements contained in this document are expressly qualified in their entirety by the cautionary statements contained or referred to in this section. Readers should not place undue reliance on forward-looking statements. Each forward-looking statement speaks only as of the date of this document, October 30, 2008. Neither Royal Dutch Shell nor any of its subsidiaries undertake any obligation to publicly update or revise any forward-looking statement as a result of new information, future events or other information. In light of these risks, results could differ materially from those stated, implied or inferred from the forward-looking statements contained in this document. Please refer to the Annual Report and Form 20-F for the year ended December 31, 2007 for a description of certain important factors, risks and uncertainties that may affect Shell's businesses. Cautionary Note to US Investors: The United States Securities and Exchange Commission (SEC) permits oil and gas companies, in their filings with the SEC, to disclose only proved reserves that a company has demonstrated by actual production or conclusive formation tests to be economically and legally producible under existing economic and operating conditions. We may use certain terms in this announcement that the SEC's guidelines strictly prohibit us from including in filings with the SEC. US Investors are urged to consider closely the disclosure in our Form 20-F, File No 001-32575 and disclosure in our Forms 6-K, File No 001-32575, available on the SEC’s website www.sec.gov. You can also obtain these forms from the SEC by calling 1-800-SEC-0330. October 30, 2008
- 13. -13- APPENDIX: ROYAL DUTCH SHELL FINANCIAL REPORT AND TABLES STATEMENT OF INCOME (SEE NOTE 1) Quarters $ million Nine Months Q3 2008 Q2 2008 Q3 2007 %1 2008 2007 % 131,567 131,419 90,703 Revenue2 377,288 249,079 113,249 109,261 76,713 Cost of sales 319,290 206,094 18,318 22,158 13,990 +31 Gross profit 57,998 42,985 +35 4,139 4,444 3,843 Selling, distribution and administrative expenses 12,552 11,741 538 408 608 Exploration 1,271 1,330 2,000 2,671 1,912 Share of profit of equity-accounted investments 7,096 5,858 174 (140) (38) Net finance costs and other (income)/expense (19) (1,416) 15,467 20,117 11,489 +35 Income before taxation 51,290 37,188 +38 6,987 8,363 4,448 Taxation 21,855 13,895 8,480 11,754 7,041 +20 Income for the period 29,435 23,293 +26 32 198 125 Income attributable to minority interest 348 429 Income attributable to shareholders of Royal Dutch 8,448 11,556 6,916 +22 29,087 22,864 +27 Shell plc 1 Q3 on Q3 change 2 Revenue is stated after deducting sales taxes, excise duties and similar levies of $25,323 million in Q3 2008, $25,462 million in Q2 2008, $22,920 million in Q1 2008, $20,830 million in Q3 2007, $18,993 million in Q2 2007 and $17,305 million in Q1 2007. BASIC EARNINGS PER SHARE (SEE NOTES 1, 2 AND 7) Quarters Nine Months Q3 2008 Q2 2008 Q3 2007 2008 2007 1.37 1.87 1.10 Earnings per share ($) 4.71 3.64 1.77 1.28 1.02 CCS earnings per share ($) 4.31 3.33 DILUTED EARNINGS PER SHARE (SEE NOTES 1, 2 AND 7) Quarters Nine Months Q3 2008 Q2 2008 Q3 2007 2008 2007 1.37 1.87 1.10 Earnings per share ($) 4.70 3.63 1.77 1.28 1.02 CCS earnings per share ($) 4.30 3.32
- 14. -14- EARNINGS BY BUSINESS SEGMENT (SEE NOTES 2 AND 4) Quarters $ million Nine Months Q3 2008 Q2 2008 Q3 2007 %1 2008 2007 % Exploration & Production2: 3,885 3,952 2,467 +57 - World outside USA 11,377 7,191 +58 1,616 1,929 860 +88 - USA 5,148 2,628 +96 5,501 5,881 3,327 +65 16,525 9,819 +68 Gas & Power: 2,437 788 500 +387 - World outside USA 4,158 1,676 +148 337 (163) 68 +396 - USA 189 474 -60 2,774 625 568 +388 4,347 2,150 +102 371 351 183 +103 Oil Sands2: 971 500 +94 Oil Products (CCS basis): 2,307 765 1,316 +75 - World outside USA 4,050 4,301 -6 (3) 310 335 - - USA 523 1,774 -71 2,304 1,075 1,651 +40 4,573 6,075 -25 Chemicals (CCS basis): 253 112 368 -31 - World outside USA 669 1,291 -48 (137) (254) (8) - - USA (494) 43 - 116 (142) 360 -68 175 1,334 -87 11,066 7,790 6,089 +82 Total operating segments 26,591 19,878 +34 Corporate: 178 81 122 - Interest and investment income/(expense) 369 863 (264) 27 57 - Currency exchange gains/(losses) (299) 123 43 93 234 - Other - including taxation 234 405 (43) 201 413 304 1,391 (120) (89) (110) Minority interest (314) (389) 10,903 7,902 6,392 +71 CCS earnings 26,581 20,880 +27 Estimated CCS adjustment for Oil Products and (2,455) 3,654 524 2,506 1,984 Chemicals Income attributable to shareholders of Royal Dutch 8,448 11,556 6,916 +22 29,087 22,864 +27 Shell plc 1 Q3 on Q3 change 2 As from the fourth quarter 2007, the earnings of the Oil Sands operations, which were previously reported as part of the Exploration & Production segment, are disclosed as a separate business segment. For comparison purposes, the Exploration & Production earnings up to the third quarter 2007 have been reclassified by the amounts reported under the Oil Sands segment.
- 15. -15- SUMMARISED BALANCE SHEET (SEE NOTES 1 AND 6) $ million Sept 30, 2008 June 30, 2008 Sept 30, 2007 Assets Non-current assets: Intangible assets 5,541 5,336 5,307 Property, plant and equipment 114,193 109,191 96,611 Investments: - equity-accounted investments 31,630 32,514 28,717 - financial assets 2,952 2,975 2,987 Deferred tax 3,978 4,089 3,375 Pre-paid pension costs 6,205 6,215 5,045 Other 6,219 6,504 5,903 170,718 166,824 147,945 Current assets: Inventories 33,442 39,624 27,906 Accounts receivable 90,100 127,241 61,636 Cash and cash equivalents 7,821 8,990 14,092 131,363 175,855 103,634 Total assets 302,081 342,679 251,579 Liabilities Non-current liabilities: Debt 10,742 11,072 12,660 Deferred tax 14,688 13,994 13,665 Retirement benefit obligations 5,961 6,162 6,449 Other provisions 13,499 14,086 12,467 Other 4,088 4,857 3,797 48,978 50,171 49,038 Current liabilities: Debt 5,984 5,352 4,683 Accounts payable and accrued liabilities 88,387 126,246 63,224 Taxes payable 15,632 15,895 12,144 Retirement benefit obligations 369 419 338 Other provisions 2,356 2,687 2,126 112,728 150,599 82,515 Total liabilities 161,706 200,770 131,553 Equity attributable to shareholders of Royal Dutch Shell plc 138,469 139,809 118,194 Minority interest 1,906 2,100 1,832 Total equity 140,375 141,909 120,026 Total liabilities and equity 302,081 342,679 251,579
- 16. -16- SUMMARISED STATEMENT OF CASH FLOWS (SEE NOTE 1) Quarters $ million Nine Months Q3 2008 Q2 2008 Q3 2007 2008 2007 Cash flow from operating activities: 8,480 11,754 7,041 Income for the period 29,435 23,293 Adjustment for: 6,935 8,701 4,798- Current taxation 22,041 14,525 178 269 126- Interest (income)/expense 625 454 3,387 3,439 2,842- Depreciation, depletion and amortisation 9,972 9,340 (1,799) (757) (55) - (Profit)/loss on sale of assets (2,837) (1,550) 2,215 (11,751) (728)- Decrease/(increase) in net working capital (6,752) (2,831) (2,000) (2,671) (1,912)- Share of profit of equity-accounted investments (7,096) (5,858) 2,604 2,447 1,567- Dividends received from equity-accounted 6,803 4,673 investments (95) (152) (109) - Deferred taxation and other provisions 75 (47) (618) 10 346 - Other (514) (777) 19,287 11,289 13,916 Cash flow from operating activities (pre-tax) 51,752 41,222 (6,686) (7,121) (4,777) Taxation paid (18,121) (12,054) 12,601 4,168 9,139 Cash flow from operating activities 33,631 29,168 Cash flow from investing activities: (12,392) (7,352) (5,550) Capital expenditure (27,173) (16,563) (555) (521) (644) Investments in equity-accounted investments (1,692) (1,333) 1,087 2,026 174 Proceeds from sale of assets 3,558 6,824 1,160 272 57 Proceeds from sale of equity-accounted investments 1,493 451 (25) 275 35 Proceeds from sale of /(additions to) financial assets 260 1,175 267 269 292 Interest received 821 872 (10,458) (5,031) (5,636) Cash flow from investing activities (22,733) (8,574) Cash flow from financing activities: 215 839 554 Net increase/(decrease) in debt with maturity period 191 (290) within three months 238 131 - Other debt: New borrowings 554 4,396 (166) (1,479) (1,235) Repayments (2,309) (3,122) (295) (369) (282) Interest paid (962) (923) (18) 34 (10) Change in minority interest 9 (6,705) (848) (1,350) (1,463) Repurchases of shares (3,271) (2,849) Dividends paid to: (2,290) (2,489) (2,283) - Shareholders of Royal Dutch Shell plc (7,108) (6,683) (105) (115) (67) - Minority interest (271) (186) Treasury shares: 36 242 200 - Net sales/(purchases) and dividends received 478 752 (3,233) (4,556) (4,586) Cash flow from financing activities (12,689) (15,610) (79) (8) 58 Currency translation differences relating to cash and (44) 106 cash equivalents (1,169) (5,427) (1,025) Increase/(decrease) in cash and cash equivalents (1,835) 5,090 8,990 14,417 15,117 Cash and cash equivalents at beginning of period 9,656 9,002 7,821 8,990 14,092 Cash and cash equivalents at end of period 7,821 14,092
- 17. -17- CAPITAL INVESTMENT Quarters $ million Nine Months Q3 2008 Q2 2008 Q3 2007 2008 2007 Capital expenditure: Exploration & Production1: 8,083 3,038 2,463 - World outside USA 13,323 7,616 688 916 721 - USA 4,134 2,082 8,771 3,954 3,184 17,457 9,698 Gas & Power: 1,030 1,006 706 - World outside USA 2,859 2,074 4 3 1 - USA 8 4 1,034 1,009 707 2,867 2,078 835 761 493 Oil Sands1 2,307 1,282 Oil Products: 879 862 770 - World outside USA 2,197 1,884 92 68 80 - USA 221 407 971 930 850 2,418 2,291 Chemicals: 558 399 312 - World outside USA 1,331 649 49 34 65 - USA 117 244 607 433 377 1,448 893 23 83 101 Corporate 143 221 12,241 7,170 5,712 Total capital expenditure 26,640 16,463 Exploration expense 260 218 183 - World outside USA 613 453 179 86 211 - USA 345 299 439 304 394 958 752 New equity in equity-accounted investments 361 347 615 - World outside USA 1,073 1,170 21 41 5 - USA 67 25 382 388 620 1,140 1,195 173 133 24 New loans to equity-accounted investments 552 138 13,235 7,995 6,750 Total capital investment* 29,290 18,548 *Comprising: 9,618 4,621 3,934 - Exploration & Production1 19,678 11,289 1,169 1,156 901 - Gas & Power 3,250 2,441 835 761 493 - Oil Sands1 2,307 1,282 983 934 942 - Oil Products 2,453 2,418 607 439 378 - Chemicals 1,458 896 23 84 102 - Corporate 144 222 13,235 7,995 6,750 29,290 18,548 1 As from the fourth quarter 2007, the results of the Oil Sands operations, which were previously reported as part of the Exploration & Production segment, are disclosed as a separate business segment. For comparison purposes, the Exploration & Production results up to the third quarter 2007 have been reclassified by the amounts reported under the Oil Sands segment.
- 18. -18- ADDITIONAL SEGMENTAL INFORMATION1 Quarters $ million Nine Months Q3 2008 Q2 2008 Q3 2007 2008 2007 Exploration & Production3 5,501 5,881 3,327 Segment earnings 16,525 9,819 Including: 538 408 608 - Exploration 1,271 1,330 2,168 2,228 1,891 - Depreciation, depletion & amortisation 6,561 6,490 1,358 1,103 733 - Share of profit of equity-accounted investments 3,673 2,305 9,556 8,659 6,072 Cash flow from operations 28,544 19,213 1,444 (374) 25 Less: Net working capital movements2 1,993 408 Cash flow from operations excluding net working 8,112 9,033 6,047 26,551 18,805 capital movements 53,276 49,185 44,419 Capital employed 53,276 44,419 Gas & Power 2,774 625 568 Segment earnings 4,347 2,150 Including: 151 85 79 - Depreciation, depletion & amortisation 317 230 787 620 471 - Share of profit of equity-accounted investments 1,991 1,319 2,259 149 316 Cash flow from operations 4,325 1,113 718 (845) (42) Less: Net working capital movements2 775 (135) Cash flow from operations excluding net working 1,541 994 358 3,550 1,248 capital movements 21,094 21,010 17,565 Capital employed 21,094 17,565 Oil Sands3 371 351 183 Segment earnings 971 500 Including: 44 45 42 - Depreciation, depletion & amortisation 133 124 684 645 405 Cash flow from operations 1,627 1,312 130 66 51 Less: Net working capital movements2 94 575 Cash flow from operations excluding net working 554 579 354 1,533 737 capital movements 6,249 5,881 4,283 Capital employed 6,249 4,283 1 Corporate segment information has not been included in the table shown. Please refer to the Earnings by business segment section for additional information. The above data does not consider minority interest impacts on the segments. 2 Excluding working capital movements related to taxation. 3 As from the fourth quarter 2007, the results of the Oil Sands operations, which were previously reported as part of the Exploration & Production segment, are disclosed as a separate business segment. For comparison purposes, the Exploration & Production results up to the third quarter 2007 have been reclassified by the amounts reported under the Oil Sands segment.
- 19. -19- ADDITIONAL SEGMENTAL INFORMATION1 (continued) Quarters $ million Nine Months Q3 2008 Q2 2008 Q3 2007 2008 2007 Oil Products 2,304 1,075 1,651 Segment CCS earnings 4,573 6,075 Including: 614 609 606 - Depreciation, depletion & amortisation 1,831 1,833 129 441 394 - Share of profit of equity-accounted investments 837 1,395 2,068 (4,148) 1,700 Cash flow from operations 282 5,287 1,537 (9,439) (366) Less: Net working capital movements2 (8,337) (2,905) Cash flow from operations excluding net working 531 5,291 2,066 8,619 8,192 capital movements 58,520 63,298 48,423 Capital employed 58,520 48,423 Chemicals 116 (142) 360 Segment CCS earnings 175 1,334 Including: 215 356 154 - Depreciation, depletion & amortisation 733 459 96 92 174 - Share of profit of equity-accounted investments 346 529 164 361 618 Cash flow from operations 911 1,185 207 (216) 71 Less: Net working capital movements2 (18) (673) Cash flow from operations excluding net working (43) 577 547 929 1,858 capital movements 11,206 11,328 10,240 Capital employed 11,206 10,240 1 Corporate segment information has not been included in the table shown. Please refer to the Earnings by business segment section for additional information. The above data does not consider minority interest impacts on the segments. 2 Excluding working capital movements related to taxation.
- 20. -20- NOTES 1. Accounting policies and basis of presentation The quarterly financial statements are prepared in accordance with International Financial Reporting Standards (IFRS) and are also in accordance with IFRS as adopted by the European Union. The Oil Sands operations, which were previously reported within the Exploration & Production segment, are reported as a separate business segment with effect from the fourth quarter 2007. Prior period financial statements have been reclassified accordingly. The accounting policies are unchanged from those set out in Note 2 to the Consolidated Financial Statements of Royal Dutch Shell plc in the Annual Report and Form 20-F for the year ended December 31, 2007 on pages 117 to 121. 2. Earnings on an estimated current cost of supplies (CCS) basis To facilitate a better understanding of underlying business performance, the financial results are also analysed on an estimated current cost of supplies (CCS) basis as applied for the Oil Products and Chemicals segment earnings. Earnings on an estimated current cost of supplies basis provides useful information concerning the effect of changes in the cost of supplies on Royal Dutch Shell’s results of operations and is a measure to manage the performance of the Oil Products and Chemicals segments but is not a measure of financial performance under IFRS. On this basis, Oil Products and Chemicals segment cost of sales of the volumes sold during the period are based on the cost of supplies during the same period after making allowance for the estimated tax effect, instead of the first-in, first-out (FIFO) method of inventory accounting. Earnings calculated on this basis do not represent an application of the last-in, first-out (LIFO) inventory basis and do not reflect any inventory drawdown effects. 3. Return on average capital employed (ROACE) ROACE is defined as the sum of the current and previous three quarters’ income adjusted for interest expense, after tax, divided by the average capital employed for the period. Components of the calculation are: $ million Q3 2008 Q3 2007 Income (four quarters) 38,068 28,806 Interest expense after tax 676 682 ROACE numerator 38,744 29,488 Capital employed - opening 137,369 124,351 Capital employed - closing 157,101 137,369 Capital employed - average 147,235 130,860 ROACE 26.3% 22.5% ROACE up to the fourth quarter 2007 had been shown on a Shell share basis. As a consequence of the significant reduction of minority interest during 2007, ROACE calculations are now presented on a 100%-basis. Prior period ROACE calculations have been adjusted for comparison purposes. 4. Earnings by business segment Operating segment results are presented before deduction of minority interest and also exclude interest and other income of a non-operational nature, interest expense, non-trading currency exchange effects and tax on these items, which are included in the Corporate results. Operating segment results are after tax and include equity-accounted investments.
- 21. -21- 5. Gearing The numerator and denominator in the gearing calculation, as demonstrated below, used by Shell are calculated by adding to reported debt and equity certain off-balance sheet obligations as at the beginning of the year such as operating lease commitments and unfunded retirement benefits (if applicable) which Shell believes to be in the nature of incremental debt, and deducting cash and cash equivalents judged to be in excess of amounts required for operational purposes. $ million Sept 30, 2008 Sept 30, 2007 Non-current debt 10,742 12,660 Current debt 5,984 4,683 Total debt 16,726 17,343 Add: Net present value of operating lease obligations1 14,387 11,319 Unfunded retirement benefit obligations (after tax)1 - - Less: Cash and cash equivalents in excess of operational requirements 5,521 12,192 Adjusted debt 25,592 16,470 Total equity 140,375 120,026 Total capital 165,967 136,496 Gearing ratio (adjusted debt as a percentage of total capital) 15.4% 12.1% 1 As of December 31, 2007 and 2006, respectively. 6. Equity Total equity comprises equity attributable to shareholders of Royal Dutch Shell and to the minority interest. Other reserves comprise the capital redemption reserve, share premium reserve, merger reserve, share plan reserve, currency translation differences, unrealised gains/(losses) on securities and unrealised gains/(losses) on cash flow hedges. Ordinary Treasury Other Retained Minority $ million share Total Total equity shares reserves earnings interest capital At December 31, 2007 536 (2,392) 14,148 111,668 123,960 2,008 125,968 Income for the period - - - 29,087 29,087 348 29,435 Income/(expense) recognised - - (4,906) - (4,906) (204) (5,110) directly in equity Capital contributions/ (repayments) from/to minority - - - 59 59 25 84 shareholders and other changes in minority interest Dividends paid - - - (7,108) (7,108) (271) (7,379) Treasury shares: net sales/(purchases) and - 478 - - 478 - 478 dividends received Repurchases of shares (7) - 7 (3,085) (3,085) - (3,085) Share-based compensation - - (58) 42 (16) - (16) At September 30, 2008 529 (1,914) 9,191 130,663 138,469 1,906 140,375
- 22. -22- Ordinary Treasury Other Retained Minority $ million share Total Total equity shares reserves earnings interest capital At December 31, 2006 545 (3,316) 8,820 99,677 105,726 9,219 114,945 Income for the period - - - 22,864 22,864 429 23,293 Income/(expense) recognised - - 3,513 - 3,513 (33) 3,480 directly in equity Capital contributions/ (repayments) from/to minority - - - - - 802 802 shareholders Acquisition of Shell Canada - - - (5,445) (5,445) (1,639) (7,084) Sakhalin partial divestment - - - - - (6,711) (6,711) Other changes in minority - - - 6 6 (49) (43) interest Dividends paid - - - (6,683) (6,683) (186) (6,869) Treasury shares: net sales/(purchases) and - 752 - - 752 - 752 dividends received Repurchases of shares (6) - 6 (2,849) (2,849) - (2,849) Share-based compensation - - 310 - 310 - 310 At September 30, 2007 539 (2,564) 12,649 107,570 118,194 1,832 120,026 7. Basis for Royal Dutch Shell earnings per ordinary share The total number of Royal Dutch Shell ordinary shares in issue at the end of the period was 6,255.1 million. Royal Dutch Shell reports earnings per share on a basic and on a diluted basis, based on the weighted average number of Royal Dutch Shell (combined A and B) ordinary shares outstanding. Shares held in respect of share options and other incentive compensation plans are excluded in determining basic earnings per share. Basic earnings per share calculations are based on the following weighted average number of shares: Millions Q3 2008 Q2 2008 Q3 2007 Royal Dutch Shell ordinary shares of €0.07 each 6,147.3 6,170.3 6,261.7 Diluted earnings per share calculations are based on the following weighted average number of shares. This adjusts the basic number of shares for all share options currently “in-the-money”. Millions Q3 2008 Q2 2008 Q3 2007 Royal Dutch Shell ordinary shares of €0.07 each 6,159.8 6,189.1 6,285.8 Basic shares outstanding at the end of the following periods are: Millions Q3 2008 Q2 2008 Q3 2007 Royal Dutch Shell ordinary shares of €0.07 each 6,133.4 6,159.1 6,245.3 One American Depository Receipt (ADR) is equal to two Royal Dutch Shell ordinary shares.
- 23. -23- 8. Accounting for Derivatives IFRS require that derivative instruments be recognised in the financial statements at fair value. Any change in the current period between the period end market price and the contract settlement price is recognised in income where hedge accounting is either not permitted or not applied to these contracts. The physical crude oil and related products held by the Oil Products business as inventory are recorded at historical cost or net realisable value, whichever is lower, as required under IFRS. Consequently, any increase in value of the inventory over cost is not recognised in income until the sale of the commodity occurs in subsequent periods. In the Oil Products business, the buying and selling of commodities includes transactions conducted through the forward markets using commodity derivatives to reduce economic exposure. The derivatives are typically associated with a future physical delivery of the commodities. These differences in accounting treatment for physical inventory (at cost or net realisable value, whichever is lower) and derivative instruments (at fair value) have resulted in timing differences in the recognition of gains or losses between reporting periods. Similarly, earnings from long-term contracts held by Gas & Power are recognised in income upon realisation. Associated commodity derivatives are recognised at fair value as of the end of each quarter. These differences in accounting treatment for long-term contracts (on accrual basis) and derivative instruments (at fair value) have resulted in timing differences in the recognition of gains or losses between the reporting periods. _________________________________________________________________________________ Contacts: - Investor Relations: Europe: + 31 (0)70 377 4540; USA: +1 212 218 3113 - Media: Europe: +31 (0)70 377 3600