
Empfohlen
Weitere ähnliche Inhalte
Was ist angesagt?
Was ist angesagt? (13)
Andere mochten auch
Andere mochten auch (19)
Ähnlich wie Amd Q307 Financials
Ähnlich wie Amd Q307 Financials (20)
Mehr von earningsreport
Mehr von earningsreport (20)
Kürzlich hochgeladen
Kürzlich hochgeladen (20)
Amd Q307 Financials
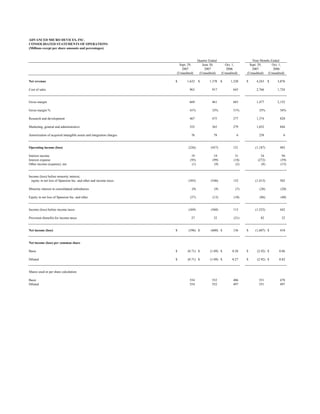
- 1. ADVANCED MICRO DEVICES, INC. CONSOLIDATED STATEMENTS OF OPERATIONS (Millions except per share amounts and percentages) Quarter Ended Nine Months Ended Sept. 29, June 30, Oct. 1, Sept. 29, Oct. 1, 2007 2007 2006 2007 2006 (Unaudited) (Unaudited) (Unaudited) (Unaudited) (Unaudited) Net revenue $ 1,632 $ 1,378 $ 1,328 $ 4,243 $ 3,876 Cost of sales 963 917 645 2,766 1,724 Gross margin 669 461 683 1,477 2,152 Gross margin % 41% 33% 51% 35% 56% Research and development 467 475 277 1,374 820 Marketing, general and administrative 352 365 279 1,052 844 Amortization of acquired intangible assets and integration charges 76 78 6 238 6 Operating income (loss) (226) (457) 121 (1,187) 482 Interest income 19 19 31 54 94 Interest expense (95) (99) (18) (272) (59) Other income (expense), net (1) (9) (2) (8) (15) Income (loss) before minority interest, equity in net loss of Spansion Inc. and other and income taxes (303) (546) 132 (1,413) 502 Minority interest in consolidated subsidiaries (9) (9) (7) (26) (20) Equity in net loss of Spansion Inc. and other (57) (13) (10) (86) (40) Income (loss) before income taxes (369) (568) 115 (1,525) 442 Provision (benefit) for income taxes 27 32 (21) 82 32 Net income (loss) $ (396) $ (600) $ 136 $ (1,607) $ 410 Net income (loss) per common share Basic $ (0.71) $ (1.09) $ 0.28 $ (2.92) $ 0.86 Diluted $ (0.71) $ (1.09) $ 0.27 $ (2.92) $ 0.82 Shares used in per share calculation Basic 554 552 486 551 478 Diluted 554 552 497 551 497
- 2. ADVANCED MICRO DEVICES, INC. CONSOLIDATED BALANCE SHEETS (Millions) Sept. 29, June 30, Dec. 31, 2007 2007 2006* (Unaudited) (Unaudited) Assets Current assets: Cash, cash equivalents and marketable securities $ 1,528 $ 1,594 $ 1,541 Accounts receivable, net 682 648 1,140 Inventories 839 892 814 Prepaid expenses and other current assets 432 410 443 Deferred income taxes 62 54 25 Total current assets 3,543 3,598 3,963 Property, plant and equipment, net 4,725 4,575 3,987 Goodwill 3,165 3,180 3,217 Investment in Spansion Inc. - 326 371 Acquisition related intangible assets, net 994 1,065 1,207 Other assets 507 480 402 Total Assets $ 12,934 $ 13,224 $ 13,147 Liabilities and Stockholders' Equity Current liabilities: Accounts payable $ 1,064 $ 985 $ 1,338 Accrued compensation and benefits 198 192 177 Accrued liabilities 833 768 716 Deferred income on shipments to distributors 106 92 169 Current portion of long-term debt and capital lease obligations 218 219 125 Other current liabilities 283 220 327 Total current liabilities 2,702 2,476 2,852 Deferred income taxes 32 56 31 Long-term debt and capital lease obligations, less current portion 5,117 5,318 3,672 Other long-term liabilities 650 610 517 Minority interest in consolidated subsidiaries 308 292 290 Stockholders' equity: Capital stock: Common stock, par value 6 6 5 Capital in excess of par value 5,280 5,237 5,316 Retained earnings (deficit) (1,328) (932) 308 Accumulated other comprehensive income 167 161 156 Total stockholders' equity 4,125 4,472 5,785 Total Liabilities and Stockholders' Equity $ 12,934 $ 13,224 $ 13,147 * Amounts as of December 31, 2006 were derived from the December 31, 2006 audited financial statements.
- 3. ADVANCED MICRO DEVICES, INC. SELECTED CORPORATE DATA (Unaudited) (Millions except headcount and percentages) Quarter Ended Nine Months Ended Sept. 29, June 30, Oct. 1, Sept. 29, Oct. 1, Segment Information (1) 2007 2007 2006 2007 2006 Computing Solutions (2) Net revenue $ 1,283 $ 1,098 $ 1,328 $ 3,299 $ 3,880 Operating income (loss) $ (112) $ (258) $ 167 $ (691) $ 615 Graphics (3) Net revenue 252 195 - 644 - Operating income (loss) (3) (50) - (88) - Consumer Electronics (4) Net revenue 97 85 - 300 - Operating income (loss) (3) (22) - (29) - All Other (5) Net revenue - - - - (4) Operating income (loss) (108) (127) (46) (379) (133) Total AMD Net revenue $ 1,632 $ 1,378 $ 1,328 $ 4,243 $ 3,876 Operating income (loss) $ (226) $ (457) $ 121 $ (1,187) $ 482 Other Data Depreciation & amortization (excluding amortization of acquired intangible assets) $ 263 $ 255 $ 200 $ 761 $ 567 Capital additions $ 419 $ 414 $ 425 $ 1,419 $ 1,191 Headcount 16,498 16,719 11,609 16,498 11,609 Adjusted EBITDA (6) $ 60 $ (143) $ 333 $ (279) $ 1,068 (1) Starting in Q406, the Company no longer allocates employee stock-based compensation and profit sharing expenses to its segments. These expenses are recorded in the All Other category. Prior period information has been restated to conform to current period presentation. (2) Computing Solutions segment includes what was formerly the Computation Products segment and the Embedded Products segment as well as revenue from sales of chipsets sold by ATI prior to AMD's acquisition of ATI. (3) Graphics segment includes graphics, video and multimedia products developed for use in desktop and notebook computers, including home media PCs, professional workstations and servers. (4) Consumer Electronics segment includes products and revenue related to mobile phones and PDAs, digital televisions and other consumer electronics and revenue for royalties received in connection with sales of game console systems that incorporate the Company’s products. (5) All Other category includes employee stock-based compensation expense, profit sharing expense, certain operating expenses and credits that are not allocated to the operating segments, and Personal Internet Communicator (PIC) related activities in Q306 and for nine months ended Q306. Also included in this category are the ATI acquisition-related, integration, and severance charges. Details of the ATI acquisition-related, integration and severance charges and employee stock-based compensation expense are shown below. ATI acquisition-related, integration and severance charges: Employee stock-based compensation expense: Quarter Ended Nine Months Ended Quarter Ended Nine Months Ended Q307 Q207 Q306 Q307 Q306 Q307 Q207 Q306 Q307 Q306 Amortization of acquired intangible assets $ 71 $ 71 $ - $ 213 $ - $ 2$ 2$2 $ 6$ 6 Cost of sales 5 7 6 25 6 Research and development 14 14 6 42 17 Integration charges $ 76 $ 78 $ 6 $ 238 $ 6 Marketing, general and administrative 11 15 9 38 27 ATI acquisition-related and integration charge 2 16 - 18 - Severance $ 27 $ 31 $ 17 $ 86 $ 50 Total $ 78 $ 94 $ 6 $ 256 $ 6 (6) Reconciliation of Net income (loss) to Adjusted EBITDA* Quarter Ended Nine Months Ended Q307 Q207 Q306 Q307 Q306 Net income (loss) $ (396) $ (600) $ 136 $ (1,607) $ 410 Depreciation and amortization 263 255 200 761 567 Amortization of acquired intangible assets 71 71 - 213 - Interest expense 95 99 18 272 59 Provision (benefit) for income taxes 27 32 (21) 82 32 Adjusted EBITDA $ 60 $ (143) $ 333 $ (279) $ 1,068 * The Company defines Adjusted EBITDA as net income (loss) adjusted for depreciation and amortization, amortization of acquired intangible assets, interest expense and taxes. The Company calculated and communicated Adjusted EBITDA because management believes it is of interest to investors and lenders in relation to its overall capital structure and its ability to borrow additional funds. The Company’s calculation of Adjusted EBITDA may or may not be consistent with the calculation of this measure by other companies in the same industry. Investors should not view Adjusted EBITDA as an alternative to the U.S. GAAP operating measure of net income or U.S. GAAP liquidity measures of cash flows from operating, investing and financing activities. In addition, Adjusted EBITDA does not take into account changes in certain assets and liabilities as well as interest and income taxes that can affect cash flows.