
Empfohlen
Empfohlen
Weitere ähnliche Inhalte
Was ist angesagt?
Was ist angesagt? (16)
Andere mochten auch
Andere mochten auch (9)
Ähnlich wie Q2 2009 Earning Report of Prosperity Bancshares Inc.
Ähnlich wie Q2 2009 Earning Report of Prosperity Bancshares Inc. (20)
Mehr von earningreport earningreport
Mehr von earningreport earningreport (20)
Kürzlich hochgeladen
Kürzlich hochgeladen (20)
Q2 2009 Earning Report of Prosperity Bancshares Inc.
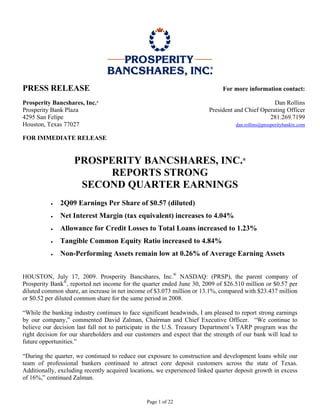
- 1. PRESS RELEASE For more information contact: Prosperity Bancshares, Inc.® Dan Rollins Prosperity Bank Plaza President and Chief Operating Officer 4295 San Felipe 281.269.7199 Houston, Texas 77027 dan.rollins@prosperitybanktx.com FOR IMMEDIATE RELEASE PROSPERITY BANCSHARES, INC. ® REPORTS STRONG SECOND QUARTER EARNINGS • 2Q09 Earnings Per Share of $0.57 (diluted) • Net Interest Margin (tax equivalent) increases to 4.04% • Allowance for Credit Losses to Total Loans increased to 1.23% • Tangible Common Equity Ratio increased to 4.84% • Non-Performing Assets remain low at 0.26% of Average Earning Assets HOUSTON, July 17, 2009. Prosperity Bancshares, Inc.® NASDAQ: (PRSP), the parent company of Prosperity Bank®, reported net income for the quarter ended June 30, 2009 of $26.510 million or $0.57 per diluted common share, an increase in net income of $3.073 million or 13.1%, compared with $23.437 million or $0.52 per diluted common share for the same period in 2008. “While the banking industry continues to face significant headwinds, I am pleased to report strong earnings by our company,” commented David Zalman, Chairman and Chief Executive Officer. “We continue to believe our decision last fall not to participate in the U.S. Treasury Department’s TARP program was the right decision for our shareholders and our customers and expect that the strength of our bank will lead to future opportunities.” “During the quarter, we continued to reduce our exposure to construction and development loans while our team of professional bankers continued to attract core deposit customers across the state of Texas. Additionally, excluding recently acquired locations, we experienced linked quarter deposit growth in excess of 16%,” continued Zalman. Page 1 of 22
- 2. Prosperity’s management uses certain non−GAAP (generally accepted accounting principles) financial measures to evaluate its performance. Specifically, Prosperity reviews tangible book value per share, return on average tangible common equity and the tangible equity to tangible assets ratio. Prosperity has included in this Earnings Release information relating to these non-GAAP financial measures for the applicable periods presented. Please refer to the “Notes to Selected Financial Data” at the end of this Earnings Release for a reconciliation of these non-GAAP financial measures. Results of operations for the three months ended June 30, 2009 For the three months ended June 30, 2009, net income was $26.510 million compared with $23.437 million for the same period in 2008. Net income per diluted common share was $0.57 for the three months ended June 30, 2009 and $0.52 for the same period in 2008. Returns on average assets, average common equity and average tangible common equity for the three months ended June 30, 2009 were 1.20%, 8.18% and 27.98%, respectively. Prosperity’s efficiency ratio (excluding net gains and losses on the sale of securities and assets) was 48.98% for the three months ended June 30, 2009. Net interest income before provision for credit losses for the quarter ended June 30, 2009 increased 39.9% to $75.521 million compared with $53.971 million during the same period in 2008. The increase was attributable primarily to a 40.8% increase in average earning assets primarily due to the Franklin transaction. The net interest margin on a tax equivalent basis decreased to 4.04% for the three months ended June 30, 2009 compared with 4.10% for the same period in 2008. On a linked quarter basis, the tax equivalent net interest margin increased six basis points to 4.04% for the three months ended June 30, 2009 from 3.98% reported for the three months ended March 31, 2009 as a result of multiple factors including lower deposit pricing. Non-interest income increased $2.067 million or 15.8% to $15.133 million for the three months ended June 30, 2009 compared with $13.066 million for the same period in 2008. The increase was mainly attributable to an increase in service charges on deposit accounts related to accounts assumed from the FDIC as part of the Franklin Bank transaction. Non-interest expense increased $13.440 million or 43.6% to $44.300 million for the second quarter of 2009 compared with $30.860 million for the second quarter of 2008. The increase was attributable to the increased expenses related to operating the additional banking offices that were acquired in the Franklin Bank transaction and increased FDIC insurance premiums. Prosperity’s FDIC insurance premium cost for 2008 was approximately $1.4 million. The expected full year 2009 FDIC insurance premium (excluding any one-time assessments) is currently projected to be between $8.0 million and $9.0 million based upon deposit balances at June 30, 2009. Additionally, the FDIC imposed an emergency special assessment as of June 30, 2009, which for Prosperity totaled approximately $4.2 million in pre-tax expense or $0.06 per diluted common share after tax. Average loans increased 8.4% or $269.144 million to $3.472 billion for the quarter ended June 30, 2009 compared with $3.203 billion for the same period of 2008. Linked quarter average loans decreased 1.6% or $57.781 million from $3.530 billion at March 31, 2009. Average deposits increased 43.8% or $2.207 billion to $7.246 billion for the quarter ended June 30, 2009 compared with $5.040 billion for the same period of 2008. Linked quarter average deposits decreased 0.4% or $31.015 million from $7.277 billion at March 31, 2009. Page 2 of 22
- 3. Loans at June 30, 2009 were $3.451 billion, an increase of $137.991 million or 4.2%, compared with $3.313 billion at June 30, 2008. Loans decreased 1.4% or $49.981 million on a linked quarter basis compared with loans of $3.501 billion at March 31, 2009. As reflected in the table below, linked quarter loans for the second quarter of 2009 were impacted by the loans acquired from the FDIC as a part of the Franklin Bank transaction in November 2008 and the loans acquired as a part of the acquisition of 1st Choice in the second quarter of 2008. Excluding the loans acquired in these transactions, loans decreased 0.3%. Deposits at June 30, 2009 were $7.258 billion, an increase of $1.961 billion or 37.0%, compared with $5.297 billion at June 30, 2008. Linked quarter deposits increased $51.016 million or 0.7% from $7.207 billion at March 31, 2009. As reflected in the table below, linked quarter deposits for the second quarter of 2009 were impacted by the deposits assumed from the FDIC as part of the Franklin Bank transaction and the deposits assumed as a part of the acquisition of 1st Choice. Excluding the deposits assumed in these transactions, linked quarter deposits increased 16.2% on an annualized basis and deposits increased 5.6% from June 30, 2008. Balance Sheet Data (at period end) June 30, 2009 Mar 31, 2009 June 30, 2008 (In thousands) (Unaudited) (Unaudited) (Unaudited) Loans: Acquired with 1st Choice 144,771 155,671 184,526 Acquired from FDIC (related to Franklin Bank) 282,733 312,793 0 All other 3,023,815 3,032,836 3,128,802 Total Loans $ 3,451,319 $ 3,501,300 $ 3,313,328 Deposits: Assumed with 1st Choice Bank 237,953 242,116 287,996 Assumed from FDIC (related to Franklin Bank) 1,729,657 1,880,823 0 All other 5,290,285 5,083,940 5,008,638 Total Deposits $ 7,257,895 $ 7,206,879 $ 5,296,634 At June 30, 2009, construction loans totaled $613.386 million, consisting of approximately $178 million of single family residential construction loans; $86 million of land development loans; $96 million of raw land loans; $101 million of residential lot loans; $50 million of commercial lot loans; and $102 million of commercial construction and other construction loans. This is a decrease of $29.765 million from construction loans at March 31, 2009. At June 30, 2009, Prosperity had $8.839 billion in total assets, $3.451 billion in loans, and $7.258 billion in deposits. Assets, loans and deposits at June 30, 2009 increased by 30.1%, 4.2% and 37.0%, respectively, compared with their level at June 30, 2008. Results of operations for the six months ended June 30, 2009 For the six months ended June 30, 2009, net income was $51.988 million compared with $46.375 million for the same period in 2008. Net income per diluted common share was $1.13 for the six months ended June 30, 2009 compared with $1.04 for the same period in 2008. Returns on average assets, average common equity and average tangible common equity for the six months ended June 30, 2009 were 1.17%, 8.12% and 28.39%, respectively. Prosperity’s efficiency ratio was 49.22% for the six months ended June 30, 2009. Page 3 of 22
- 4. Net interest income before provision for credit losses for the six months ended June 30, 2009 increased $43.633 million or 41.2%, to $149.599 million compared with $105.966 million during the same period in 2008. The increase was attributable primarily to a 43.0% increase in average earning assets. Non-interest income increased $4.405 million or 17.1% to $30.150 million for the six months ended June 30, 2009 compared with $25.745 million for the same period in 2008. The increase was mainly attributable to an increase in service charges on deposit accounts related to accounts assumed from the FDIC as part of the Franklin Bank transaction and deposit accounts assumed from the 1st Choice acquisition. Non-interest expense increased $28.343 million or 47.3% to $88.323 million for the first six months of 2009 compared with $59.980 million for the same period in 2008. The increase was attributable to the increased expenses related to operating the additional banking offices that were acquired in the Franklin Bank transaction, the 1st Choice acquisition and FDIC insurance premiums. The provision for credit losses was $13.025 million for the six months ended June 30, 2009 compared to $2.167 million for the six months ended June 30, 2008. Net charge offs were $7.383 million for the six months ended June 30, 2009 compared to $2.806 million for the six months ended June 30, 2008. Asset Quality Non-performing assets totaled $19.587 million or 0.26% of average earning assets at June 30, 2009 compared with $11.651 million or 0.22% of average earning assets at June 30, 2008 and $12.525 million or 0.16% of average earnings assets at March 31, 2009. The allowance for credit losses was 1.23% of total loans at June 30, 2009 compared with 1.03% at June 30, 2008 and 1.12% of total loans at March 31, 2009. Non-performing assets (In thousands) June 30, 2009 Mar 31, 2009 Dec 31, 2008 Amount # Amount # Amount # Commercial $ 955 28 $ 1,207 24 $ 1,491 16 Construction 10,969 38 9,219 46 9,252 36 1-4 family (including home equity) 1,353 22 1,110 17 1,325 19 Commercial real estate (including multi-family) 6,157 9 859 5 2,014 8 Agriculture and agriculture real estate 0 0 8 1 30 3 Consumer 153 11 122 11 250 15 Other 0 0 0 0 6 1 Total $ 19,587 108 $ 12,525 104 $ 14,368 98 Net Charge-offs Three Months Three Months Twelve Months (In thousands) Ended Ended Ended June 30, 2009 Mar 31, 2009 Dec 31, 2008 Commercial $ 307 $ 761 $ 2,489 Construction 1,185 2,387 3,190 1-4 family (including home equity) 510 117 351 Commercial RE (including multi-family) 1,091 0 (110) Agriculture (1) 23 327 Consumer 434 569 1,374 Total $ 3,526 $ 3,857 $ 7,621 Page 4 of 22
- 5. The provision for credit losses was $6.9 million for the three months ended June 30, 2009 and $1.0 million for the three months ended June 30, 2008. Prosperity’s loan loss reserve model called for increased provisioning in the second quarter due to increased charge-offs resulting from a general weakening of the economy. Net charge offs were $3.526 million for the three months ended June 30, 2009 and $1.163 million for the three months ended June 30, 2008. Conference Call Prosperity’s management team will host a conference call on Friday, July 17, 2009 at 10:30 a.m. Eastern Daylight Time (9:30 a.m. Central Daylight Time) to discuss Prosperity’s second quarter earnings. Individuals and investment professionals may participate in the call by dialing 1-800-895-4790, the reference code is PBTX. Alternatively, individuals may listen to the live webcast of the presentation by visiting Prosperity’s website at www.prosperitybanktx.com. The webcast may be accessed directly from Prosperity’s Home page under News and Events. Assumption of deposits and acquisition of certain assets from the FDIC as receiver for Franklin Bank, SSB On November 7, 2008, Prosperity Bank® paid a deposit premium of approximately $60.918 million to assume approximately $3.6 billion of deposits, including all uninsured deposits, from the FDIC, acting in its capacity as receiver for Franklin Bank. The FDIC entered into a purchase and assumption agreement with Prosperity Bank, which paid a premium to ensure that all deposits of Franklin Bank, both insured and uninsured, were transferred to Prosperity Bank®. Under the terms of the purchase and assumption agreement, Prosperity Bank® acquired certain assets from the FDIC, including approximately $350 million in US Treasury and Agency Securities and approximately $350 million in performing loans. The remaining net proceeds were predominately invested in US Agency Securities. While Franklin Bank operated forty-five (45) full service banking offices, Prosperity Bank continues to operate thirty-three (33) of these locations and has consolidated the remainder with other nearby Prosperity locations. Acquisition of 1st Choice Bancorp, Inc. On June 1, 2008, Prosperity completed its previously announced acquisition of 1st Choice Bancorp, Inc. and its wholly owned subsidiary, 1st Choice Bank. 1st Choice Bancorp, Inc. operated two (2) banking offices in Houston, Texas, with one location in South Houston and another in the Heights area, which was consolidated with Prosperity’s Heights location and is located in 1st Choice’s Heights banking office. As of May 31, 2008, 1st Choice Bancorp reported total assets of approximately $314.9 million, loans of approximately $192.7 million, deposits of approximately $285.2 million and stockholders’ equity of approximately $26.4 million. In connection with the acquisition, Prosperity issued 1,757,757 shares of its common stock and paid approximately $18.758 million in cash for all outstanding shares of 1st Choice Bancorp. Page 5 of 22
- 6. Prosperity Bancshares, Inc.® Prosperity Bancshares, Inc. , an $8.8 billion Houston, Texas based regional financial holding company, ® formed in 1983, operates under a community banking philosophy and seeks to develop broad customer relationships based on service and convenience. Prosperity offers a variety of traditional loan and deposit products to its customers, which consist primarily of small and medium sized businesses and consumers. In addition to established banking products, Prosperity offers a complete line of services including: Internet Banking services at http://www.prosperitybanktx.com, Retail Brokerage Services, MasterMoney Debit Cards, and 24 hour voice response banking. Prosperity currently operates one hundred fifty-eight (158) full service banking locations; fifty-one (51) in the Houston area; twenty-seven (27) in the South Texas area including Corpus Christi and Victoria; twenty-four (24) in the Dallas/Fort Worth area; twenty (20) in the East Texas area; twenty-seven (27) in the Central Texas area including Austin and San Antonio; and nine (9) in the Bryan/College Station area. Central Texas Area - Dallas/Fort Worth Area - Palestine Hitchcock Rusk Katy Austin - Dallas - Seven Points Liberty Allandale Abrams Centre Tyler Magnolia Cedar Park Balch Springs Tyler-University Mont Belvieu Congress Camp Wisdom Winnsboro Nederland 183 Cedar Hill Needville Lakeway Central Expressway Sweeny Liberty Hill Frisco Houston Area - Tomball Northland Frisco-West Waller Oak Hill Kiest Houston - West Columbia Parmer Lane Preston Road Aldine Wharton Research Blvd Red Oak Bellaire Winnie Rollingwood The Colony Clear Lake Wirt Slaughter Lane Turtle Creek Copperfield Westmoreland Cypress Downtown South Texas Area - Bryan/College Station - Fairfield Bryan Fort Worth - Gessner Corpus Christi - Bryan-East Haltom City Gladebrook Airline Bryan-North Keller Harrisburg Carmel College Station Roanoke Heights Northwest Greens Prairie Stockyards Highway 6 West Saratoga Wellborn Road Hillcroft Water Street Rock Prairie Little York Other Dallas/Fort Worth Medical Center Other South Texas Locations - Memorial Drive Locations - Other Central Texas Azle Pasadena Alice Locations - Ennis Pecan Grove Aransas Pass Bastrop Gainesville River Oaks Bay City Caldwell Mesquite Sugar Land Beeville Dime Box Muenster SW Medical Center Cuero Dripping Springs Sanger Tanglewood Goliad Elgin Waxahachie Uptown Gonzales Flatonia Waugh Drive Hallettsville Georgetown Westheimer Kingsville Kingsland East Texas Area - Woodcreek Mathis La Grange Athens Padre Island Lexington Athens-South Other Houston Area Palacios Navasota Blooming Grove Locations - Pleasanton New Braunfels Canton Angleton Port Lavaca Round Rock Carthage Beaumont Portland San Antonio Corsicana Cinco Ranch Rockport Schulenburg Crockett Cleveland Seguin Smithville Eustace East Bernard Sinton Weimar Grapeland Edna Victoria Gun Barrel City El Campo Victoria-North Jacksonville Dayton Yoakum Kerens Galveston Yorktown Longview Groves Mount Vernon Hempstead “Safe Harbor” Statement under the Private Securities Litigation Reform Act of 1995: This release contains, and the remarks by Prosperity’s management on the conference call may contain, forward-looking statements within the meaning of the securities laws that are based on current expectations, Page 6 of 22
- 7. assumptions, estimates and projections about Prosperity Bancshares®, and its subsidiaries. These forward-looking statements are not guarantees of future performance and are subject to risks and uncertainties, many of which are outside of Prosperity’s control, that may cause actual results to differ materially from those expressed or implied by the forward-looking statements. These risks and uncertainties include but are not limited to whether Prosperity can: successfully identify acquisition targets and integrate the businesses of acquired companies and banks; continue to sustain its current internal growth rate or total growth rate; provide products and services that appeal to its customers; continue to have access to debt and equity capital markets; and achieve its sales objectives. Other risks include, but are not limited to: the possibility that credit quality could deteriorate; actions of competitors; changes in laws and regulations (including changes in governmental interpretations of regulations and changes in accounting standards); a deterioration or downgrade in the credit quality and credit agency ratings of the securities in Prosperity’s securities portfolio; customer and consumer demand, including customer and consumer response to marketing; effectiveness of spending, investments or programs; fluctuations in the cost and availability of supply chain resources; economic conditions, including currency rate fluctuations and interest rate fluctuations; weather; and the stock price volatility associated with “small-cap” companies. These and various other factors are discussed in Prosperity’s Annual Report on Form 10-K for the year ended December 31, 2008 and other reports and statements we have filed with the SEC. Copies of the SEC filings for Prosperity Bancshares’s® may be downloaded from the Internet at no charge from www.prosperitybanktx.com. --- Prosperity Bancshares, Inc. ® Financial Highlights (Dollars and share amounts in thousands, except per share data) Three Months Ended June 30, 2009 Mar 31, 2009 Dec 31, 2008 Sept 30, 2008 Selected Earnings and Per (Unaudited) (Unaudited) (Unaudited) (Unaudited) Share Data Total interest income $ 102,768 $ 105,566 $ 96,588 $ 84,846 Total interest expense 27,247 31,488 32,631 27,040 Net interest income 75,521 74,078 63,957 57,806 Provision for credit losses 6,900 6,125 6,000 1,700 Net interest income after provision for credit losses 68,621 67,953 57,957 56,106 Total non-interest income 15,133 15,017 13,508 13,117 Total non-interest expense 44,300 44,023 37,586 46,230 Net income before taxes 39,454 38,947 33,879 22,993 Federal income taxes 12,944 13,469 11,194 7,546 Net income $ 26,510 $ 25,478 $ 22,685 $ 15,447 Basic earnings per share $0.57 $0.55 $0.49 $0.34 Diluted earnings per share $0.57 $0.55 $0.49 $0.33 Period end shares outstanding 46,109 46,100 46,080 46,072 Weighted average shares outstanding (basic) 46,105 46,086 46,078 46,065 Weighted average shares outstanding (diluted) 46,225 46,139 46,276 46,302 Page 7 of 22
- 8. Prosperity Bancshares, Inc. ® Financial Highlights (Dollars in thousands) Three Months Ended Six Months Ended June 30, 2009 June 30, 2008 June 30, 2009 June 30, 2008 Balance Sheet Averages (Unaudited) (Unaudited) (Unaudited) (Unaudited) Total loans $ 3,472,449 $ 3,203,305 $ 3,501,488 $ 3,173,240 Investment securities 3,964,766 2,131,370 3,997,278 2,054,440 Federal funds sold and other temporary investments 122,358 33,803 94,631 82,702 Total earning assets 7,559,573 5,368,478 7,593,397 5,310,382 Allowance for credit losses (39,249) (32,813) (38,240) (32,381) Cash and due from banks 133,739 131,015 145,232 138,354 Goodwill 875,236 785,604 875,601 772,774 Core Deposit Intangibles (CDI) 41,518 43,461 39,314 44,131 Other real estate 13,524 8,581 10,288 10,002 Fixed assets, net 150,475 123,876 137,086 123,705 Other assets 99,169 111,062 100,472 111,016 Total assets $ 8,833,985 $ 6,539,264 $ 8,863,150 $ 6,477,983 Non-interest bearing deposits $ 1,499,888 $ 1,215,176 $ 1,498,136 $ 1,184,121 Interest bearing deposits 5,746,511 3,824,628 5,767,455 3,803,669 Total deposits 7,246,399 5,039,804 7,265,591 4,987,790 Securities sold under repurchase agreements 92,466 82,408 88,128 74,241 Federal funds purchased and other borrowings 28,937 76,132 55,865 86,554 Junior subordinated debentures 92,265 102,575 92,265 106,012 Other liabilities 78,181 61,187 80,101 63,032 Shareholders' equity(A) 1,295,737 1,177,158 1,281,200 1,160,354 Total liabilities and equity $ 8,833,985 $ 6,539,264 $ 8,863,150 $ 6,477,983 (A) Includes $15,800 and $1,675 in after tax unrealized gains on available for sale securities for the three month periods ending June 30, 2009 and June 30, 2008, respectively and $13,722 and $172 for the six months ending June 30, 2009 and June 30, 2008, respectively. Page 8 of 22
- 9. Prosperity Bancshares, Inc. ® Financial Highlights (Dollars in thousands) Three Months Ended Six Months Ended June 30, 2009 June 30, 2008 June 30, 2009 June 30, 2008 Income Statement Data (Unaudited) (Unaudited) (Unaudited) (Unaudited) Interest on loans $ 55,248 $ 55,948 $ 111,050 $ 114,468 Interest on securities 47,450 25,856 97,178 50,639 Interest on federal funds sold and other temporary investments 70 175 106 1,337 Total interest income 102,768 81,979 208,334 166,444 Interest expense - deposits 25,621 25,210 55,078 54,155 Interest expense - debentures 959 1,558 2,078 3,577 Interest expense - other 667 1,240 1,579 2,746 Total interest expense 27,247 28,008 58,735 60,478 Net interest income (B) 75,521 53,971 149,599 105,966 Provision for credit losses 6,900 1,000 13,025 2,167 Net interest income after provision for credit losses 68,621 52,971 136,574 103,799 Service charges on deposit accounts 12,863 10,727 25,235 21,233 Net gain on sale of assets 200 676 297 680 Net gain (loss) on sale of ORE 415 (478) 437 (439) Brokered mortgage income 140 113 210 222 Net gain on sale of held for sale loans 0 110 0 183 Gain on sale of securities 0 0 0 0 Other non-interest income 1,515 1,918 3,971 3,866 Total non-interest income 15,133 13,066 30,150 25,745 Salaries and benefits (C) 20,494 16,751 43,142 32,881 CDI amortization 2,492 2,459 5,156 4,951 Net occupancy and equipment 3,514 2,867 7,492 5,677 Depreciation 2,069 1,920 4,070 3,857 Data processing and software amortization 1,562 1,361 3,617 2,652 Impairment charge on write-down of securities 0 0 0 0 Other non-interest expense 14,169 5,502 24,846 9,962 Total non-interest expense 44,300 30,860 88,323 59,980 Net income before taxes 39,454 35,177 78,401 69,564 Federal income taxes 12,944 11,740 26,413 23,189 Net income available to common shareholders $ 26,510 $ 23,437 $ 51,988 $ 46,375 (B) Net interest income on a tax equivalent basis would be $76,226 and $54,692 for the three months ended June 30, 2009 and June 30, 2008, respectively and $150,985 and $107,524 for the six months ended June 30, 2009 and June 30, 2008, respectively. (C) Salaries and benefits includes stock-based compensation expense of $294 and $393 for the three months ended June 30, 2009 and June 30, 2008, respectively and $620 and $641 for the six months ended June 30, 2009 and June 30, 2008, respectively. Page 9 of 22
- 10. Prosperity Bancshares, Inc.® Financial Highlights (Dollars and share amounts in thousands, except per share data) Three Months Ended Six Months Ended June 30, 2009 June 30, 2008 June 30, 2009 June 30, 2008 Common Share and (Unaudited) (Unaudited) (Unaudited) (Unaudited) Other Data Employees - FTE 1,634 1,397 1,634 1,397 Book value per share $ 28.17 $ 26.44 $ 28.17 $ 26.44 Tangible book value per share $ 8.31 $ 7.79 $ 8.31 $ 7.79 Period end shares outstanding 46,109 46,060 46,109 46,060 Weighted average shares outstanding (basic) 46,105 44,852 46,097 44,520 Weighted average shares outstanding (diluted) 46,225 45,039 46,146 44,676 Non-accrual loans $ 646 $ 2,727 $ 646 $ 2,727 Accruing loans 90 or more days past due 7,497 2,130 7,497 2,130 Restructured loans 0 0 0 0 Total non-performing loans 8,143 4,857 8,143 4,857 Repossessed assets 343 139 343 139 Other real estate 11,101 6,655 11,101 6,655 Total non-performing assets $ 19,587 $ 11,651 $ 19,587 $ 11,651 Allowance for credit losses at end of period $ 42,611 $ 34,085 $ 42,611 $ 34,085 Net charge-offs $ 3,526 $ 1,163 $ 7,383 $ 2,806 Basic earnings per share $ 0.57 $ 0.52 $ 1.13 $ 1.04 Diluted earnings per share $ 0.57 $ 0.52 $ 1.13 $ 1.04 Page 10 of 22
- 11. Prosperity Bancshares, Inc.® Financial Highlights Three Months Ended Six Months Ended June 30, 2009 June 30, 2008 June 30, 2009 June 30, 2008 Performance Ratios (Unaudited) (Unaudited) (Unaudited) (Unaudited) Return on average assets (annualized) 1.20% 1.43% 1.17% 1.43% Return on average common equity (annualized) 8.18% 7.96% 8.12% 7.99% Return on average tangible common equity (annualized) 27.98% 26.93% 28.39% 27.01% (D) Net interest margin (tax equivalent) (annualized) 4.04% 4.10% 4.01% 4.07% Efficiency ratio(E) 48.98% 46.50% 49.22% 45.78% Asset Quality Ratios Non-performing assets to average earning assets 0.26% 0.22% 0.26% 0.22% Non-performing assets to loans and other real estate 0.57% 0.35% 0.57% 0.35% Net charge-offs to average loans 0.10% 0.04% 0.21% 0.09% Allowance for credit losses to total loans 1.23% 1.03% 1.23% 1.03% Common Stock Market Price High $31.23 $32.29 $31.23 $32.29 Low $26.20 $25.37 $20.04 $21.96 Period end market price $29.83 $26.73 $29.83 $26.73 (D) Net interest margin for all periods presented is calculated on an actual 365 or actual 366 day basis. (E) The Company revised its efficiency ratio in the fourth quarter 2008 and no longer excludes gains and losses on the sale of ORE. The efficiency ratio is calculated by dividing total non-interest expense (excluding provision for credit losses) by net interest income plus non-interest income (excluding net gains and losses on the sale of securities and assets and impairment charge on write-down of securities). Prior period amounts have been restated to reflect the current methodology. Additionally, taxes are not part of this calculation. Page 11 of 22
- 12. Prosperity Bancshares, Inc.® Financial Highlights (Dollars in thousands) June 30, 2009 Mar 31, 2009 Dec 31, 2008 Sept 30, 2008 Loan Portfolio (Unaudited) (Unaudited) (Unaudited) (Unaudited) Commercial $ 461,622 13.38% $ 461,514 13.18% $ 499,143 13.99% $ 470,099 14.47% Construction 613,386 17.77% 643,151 18.37% 666,080 18.67% 626,443 19.28% 1-4 family residential 675,702 19.58% 667,392 19.06% 668,096 18.73% 574,583 17.69% Home equity 115,029 3.33% 112,053 3.20% 107,048 3.01% 95,962 2.95% Commercial real estate 1,318,489 38.20% 1,346,056 38.45% 1,343,401 37.66% 1,229,219 37.84% Agriculture 149,515 4.33% 144,384 4.12% 145,649 4.08% 133,123 4.10% Consumer 117,576 3.41% 126,750 3.62% 137,640 3.86% 119,188 3.67% Total Loans $3,451,319 $3,501,300 $3,567,057 $3,248,617 Deposit Types Non-interest bearing DDA $1,476,378 20.34% $1,510,005 20.95% $1,522,983 20.85% $1,263,407 24.75% Interest bearing DDA 1,060,965 14.62% 1,030,826 14.30% 1,082,078 14.82% 707,055 13.85% Money Market 1,614,874 22.25% 1,495,724 20.76% 1,400,673 19.18% 1,147,559 22.48% Savings 325,232 4.48% 322,130 4.47% 309,938 4.24% 246,370 4.83% Time < $100 1,418,375 19.54% 1,491,380 20.69% 1,577,431 21.60% 814,165 15.95% Time > $100 1,362,071 18.77% 1,356,814 18.83% 1,410,194 19.31% 926,286 18.14% Total Deposits $7,257,895 $7,206,879 $7,303,297 $5,104,842 Loan to Deposit Ratio 47.6% 48.6% 48.8% 63.6% Construction Loans Single family residential construction $ 177,632 28.96% $ 214,034 33.28% $ 237,191 35.61% $ 233,196 37.23% Land development 86,363 14.08% 91,005 14.15% 90,846 13.64% 73,955 11.81% Raw land 96,157 15.67% 89,003 13.84% 89,120 13.38% 90,974 14.52% Residential lots 101,321 16.52% 104,684 16.28% 106,869 16.04% 101,027 16.13% Commercial lots 49,614 8.09% 37,318 5.80% 39,374 5.91% 35,890 5.73% Commercial construction and other 102,299 16.68% 107,107 16.65% 102,680 15.42% 91,401 14.58% Total Construction Loans $ 613,386 $ 643,151 $ 666,080 $ 626,443 Page 12 of 22
- 13. Prosperity Bancshares, Inc.® Financial Highlights (Dollars in thousands) June 30, 2009 Mar 31, 2009 Dec 31, 2008 Sept 30, 2008 June 30, 2008 Balance Sheet Data (at period end) (Unaudited) (Unaudited) (Unaudited) (Unaudited) (Unaudited) Total loans $ 3,451,319 $ 3,501,300 $ 3,567,057 $ 3,248,617 $ 3,313,328 Investment securities (F) 3,981,109 3,991,200 4,160,401 2,294,403 2,235,703 Federal funds sold and other temporary investments 128,451 14,930 16,404 25,748 14,230 Total earning assets 7,560,879 7,507,430 7,743,862 5,568,768 5,563,261 Allowance for credit losses (42,611) (39,238) (36,970) (33,981) (34,085) Cash and due from banks 142,860 148,938 212,335 159,386 170,966 Goodwill 875,434 874,356 874,654 811,916 811,391 Core deposit intangibles 40,305 42,796 38,196 44,974 47,536 Other real estate 11,101 9,134 4,450 7,538 6,655 Fixed assets, net 149,742 151,544 123,638 123,823 125,000 Other assets 101,241 104,237 112,199 105,485 103,010 Total assets $ 8,838,951 $ 8,799,197 $ 9,072,364 $ 6,787,909 $ 6,793,734 Demand deposits $ 1,476,378 $ 1,510,005 $ 1,522,983 $ 1,263,407 $ 1,285,493 Interest bearing deposits 5,781,517 5,696,874 5,780,314 3,841,435 4,011,141 Total deposits 7,257,895 7,206,879 7,303,297 5,104,842 5,296,634 Securities sold under repurchase agreements 96,732 81,773 96,017 100,310 99,225 Federal funds purchased and other borrowings 28,170 28,441 229,395 219,671 42,089 Junior subordinated debentures 92,265 92,265 92,265 92,265 92,265 Other liabilities 64,794 109,291 96,284 41,641 45,916 Total liabilities 7,539,856 7,518,649 7,817,258 5,558,729 5,576,129 Shareholders' equity (G) 1,299,095 1,280,548 1,255,106 1,229,180 1,217,605 Total liabilities and equity $ 8,838,951 $ 8,799,197 $ 9,072,364 $ 6,787,909 $ 6,793,734 (F) Includes $20,153, $23,784, $15,158, $1,220 and ($633) in unrealized gains (losses) on available for sale securities for the quarterly periods ending June 30, 2009, March 31, 2009, December 31, 2008, September 30, 2008 and June 30, 2008, respectively. (G) Includes $13,099, $15,460, $9,853, $793 and ($411) in after-tax unrealized gains (losses) on available for sale securities for the quarterly periods ending June 30, 2009, March 31, 2009, December 31, 2008, September 30, 2008 and June 30, 2008, respectively. Page 13 of 22
- 14. Prosperity Bancshares, Inc.® Financial Highlights (Dollars in thousands) Three Months Ended June 30, 2009 Mar 31, 2009 Dec 31, 2008 Sept 30, 2008 June 30, 2008 Income Statement Data (Unaudited) (Unaudited) (Unaudited) (Unaudited) (Unaudited) Interest on loans $ 55,248 $ 55,802 $ 56,073 $ 56,925 $ 55,948 Interest on securities 47,450 49,726 39,713 27,834 25,856 Interest on federal funds sold and other earning assets 70 38 802 87 175 Total interest income 102,768 105,566 96,588 84,846 81,979 Interest expense - deposits 25,621 29,457 29,663 23,874 25,210 Interest expense - debentures 959 1,119 1,452 1,410 1,558 Interest expense - other 667 912 1,516 1,756 1,240 Total interest expense 27,247 31,488 32,631 27,040 28,008 Net interest income 75,521 74,078 63,957 57,806 53,971 Provision for credit losses 6,900 6,125 6,000 1,700 1,000 Net interest income after provision for credit losses 68,621 67,953 57,957 56,106 52,971 Service charges on deposits accounts 12,863 12,372 13,204 11,348 10,727 Net gain on sale of assets 200 97 130 34 676 Net gain (loss) on sale of ORE 415 22 (1,684) (210) (478) Brokered mortgage income 140 70 34 74 113 Net gain on sale of held for sale loans 0 0 0 46 110 Gain on sale of securities 0 0 0 0 0 Other non-interest income 1,515 2,456 1,824 1,825 1,918 Total non-interest income 15,133 15,017 13,508 13,117 13,066 Salaries and benefits 20,494 22,648 20,411 17,526 16,751 CDI amortization 2,492 2,664 2,284 2,562 2,459 Net occupancy and equipment 3,514 3,978 3,704 3,088 2,867 Depreciation 2,069 2,001 1,854 1,955 1,920 Data processing and software amortization 1,562 2,055 1,609 1,319 1,361 Impairment charge on write-down of securities 0 0 0 14,025 0 Other non-interest expense 14,169 10,677 7,724 5,755 5,502 Total non-interest expense 44,300 44,023 37,586 46,230 30,860 Net income before taxes 39,454 38,947 33,879 22,993 35,177 Federal income taxes 12,944 13,469 11,194 7,546 11,740 Net income available to common shareholders $ 26,510 $ 25,478 $ 22,685 $ 15,447 $ 23,437 Page 14 of 22
- 15. Prosperity Bancshares, Inc.® Financial Highlights Comparative Quarterly Three Months Ended Asset Quality, Performance June 30, 2009 Mar 31, 2009 Dec 31, 2008 Sept 30, 2008 June 30, 2008 & Capital Ratios (Unaudited) (Unaudited) (Unaudited) (Unaudited) (Unaudited) Return on average assets (annualized) 1.20% 1.15% 1.09% 0.91% 1.43% Return on average common equity (annualized) 8.18% 8.02% 7.30% 5.04% 7.96% Return on average tangible equity (annualized) 27.98% 28.52% 24.89% 16.83% 26.93% Net interest margin (tax equivalent) (annualized) 4.04% 3.98% 3.65% 4.15% 4.10% Employees - FTE 1,634 1,684 1,734 1,366 1,397 Efficiency ratio 48.98% 49.47% 48.60% 45.43% 46.50% Non-performing assets to average earning assets 0.26% 0.16% 0.20% 0.26% 0.22% Non-performing assets to loans and other real estate 0.57% 0.36% 0.40% 0.45% 0.35% Net charge-offs to average loans 0.10% 0.11% 0.09% 0.05% 0.04% Allowance for credit losses to total loans 1.23% 1.12% 1.04% 1.05% 1.03% Book value per share $28.17 $27.78 $27.24 $26.68 $26.44 Tangible book value per share $8.31 $7.88 $7.43 $8.08 $7.79 Tier 1 risk-based capital 11.24% 10.53% 9.89% 12.71% 12.70% Total risk-based capital 12.28% 11.48% 10.76% 13.65% 13.67% Tier 1 leverage capital 5.81% 5.48% 5.68% 7.75% 7.87% Tangible equity to tangible assets 4.84% 4.61% 4.19% 6.28% 6.04% Equity to assets 14.70% 14.55% 13.83% 18.11% 17.92% Page 15 of 22
- 16. Prosperity Bancshares, Inc.® Supplemental Financial Data (Unaudited) (Dollars in thousands) Three Months Ended June 30, 2009 YIELD ANALYSIS Average Interest Earned Average Balance / Interest Paid Yield/Rate Interest Earning Assets: Loans $ 3,472,449 $ 55,248 6.38% Investment securities 3,964,766 47,450 4.79% Federal funds sold and other temporary investments 122,358 70 0.23% Total interest earning assets 7,559,573 $ 102,768 5.45% Allowance for credit losses (39,249) Non-interest earning assets 1,313,661 Total assets $ 8,833,985 Interest Bearing Liabilities: Interest bearing demand deposits $ 1,047,363 $ 2,182 0.84% Savings and money market deposits 1,878,238 4,619 0.99% Certificates and other time deposits 2,820,910 18,820 2.68% Securities sold under repurchase agreements 92,466 280 1.21% Federal funds purchased and other borrowings 28,937 387 5.36% Junior subordinated debentures 92,265 959 4.17% Total interest bearing liabilities $ 5,960,179 $ 27,247 1.83% Non-interest bearing liabilities: Non-interest bearing demand deposits $ 1,499,888 Other liabilities 78,181 Total liabilities $ 7,538,248 Shareholders' equity $ 1,295,737 Total liabilities and shareholders' equity $ 8,833,985 Net Interest Income & Margin $ 75,521 4.01% Net Interest Income & Margin (tax equivalent) $ 76,226 4.04% Page 16 of 22
- 17. Prosperity Bancshares, Inc.® Supplemental Financial Data (Unaudited) (Dollars in thousands) Three Months Ended June 30, 2008 YIELD ANALYSIS Average Interest Earned Average Balance / Interest Paid Yield/Rate Interest Earning Assets: Loans $ 3,203,305 $ 55,948 7.02% Investment securities 2,131,370 25,856 4.85% Federal funds sold and other temporary investments 33,803 175 2.08% Total interest earning assets 5,368,478 $ 81,979 6.14% Allowance for credit losses (32,813) Non-interest earning assets 1,203,599 Total assets $ 6,539,264 Interest Bearing Liabilities: Interest bearing demand deposits $ 745,413 $ 1,652 0.89% Savings and money market deposits 1,370,964 6,678 1.96% Certificates and other time deposits 1,708,251 16,880 3.97% Securities sold under repurchase agreements 82,408 574 2.80% Federal funds purchased and other borrowings 76,132 666 3.52% Junior subordinated debentures 102,575 1,558 6.11% Total interest bearing liabilities 4,085,743 $ 28,008 2.76% Non-interest bearing liabilities: Non-interest bearing demand deposits 1,215,176 Other liabilities 61,187 Total liabilities 5,362,106 Shareholders' equity 1,177,158 Total liabilities and shareholders' equity $ 6,539,264 Net Interest Income & Margin $ 53,971 4.04% Net Interest Income & Margin (tax equivalent) $ 54,692 4.10% Page 17 of 22
- 18. Prosperity Bancshares, Inc.® Supplemental Financial Data (Unaudited) (Dollars in thousands) Six Months Ended June 30, 2009 YIELD ANALYSIS Average Interest Earned Average Balance / Interest Paid Yield/Rate Interest Earning Assets: Loans $ 3,501,488 $ 111,050 6.40% Investment securities 3,997,278 97,178 4.86% Federal funds sold and other temporary investments 94,631 106 0.23% Total interest earning assets $ 7,593,397 $ 208,334 5.53% Allowance for credit losses (38,240) Non-interest earning assets 1,307,993 Total assets $ 8,863,150 Interest Bearing Liabilities: Interest bearing demand deposits $ 1,058,122 $ 4,304 0.82% Savings and money market deposits 1,841,147 10,676 1.17% Certificates and other time deposits 2,868,186 40,098 2.82% Securities sold under repurchase agreements 88,128 628 1.44% Federal funds purchased and other borrowings 55,865 951 3.43% Junior subordinated debentures 92,265 $ 2,078 4.54% Total interest bearing liabilities $ 6,003,713 $ 58,735 1.97% Non-interest bearing liabilities: Non-interest bearing demand deposits $ 1,498,136 Other liabilities 80,101 Total liabilities $ 7,581,950 Shareholders' equity 1,281,200 Total liabilities and shareholders' equity $ 8,863,150 Net Interest Income & Margin $ 149,599 3.97% Net Interest Income & Margin (tax equivalent) $ 150,985 4.01% Page 18 of 22
- 19. Prosperity Bancshares, Inc.® Supplemental Financial Data (Unaudited) (Dollars in thousands) Six Months Ended June 30, 2008 YIELD ANALYSIS Average Interest Earned Average Balance / Interest Paid Yield/Rate Interest Earning Assets: Loans $ 3,173,240 $ 114,468 7.25% Investment securities 2,054,440 50,639 4.93% Federal funds sold and other temporary investments 82,702 1,337 3.25% Total interest earning assets 5,310,382 $ 166,444 6.30% Allowance for credit losses (32,381) Non-interest earning assets 1,199,982 Total assets $ 6,477,983 Interest Bearing Liabilities: Interest bearing demand deposits $ 807,570 $ 4,773 1.19% Savings and money market deposits 1,311,655 14,092 2.16% Certificates and other time deposits 1,684,444 35,290 4.21% Securities sold under repurchase agreements 74,241 1,178 3.19% Federal funds purchased and other borrowings 86,554 1,568 3.64% Junior subordinated debentures 106,012 3,577 6.79% Total interest bearing liabilities 4,070,476 $ 60,478 2.99% Non-interest bearing liabilities: Non-interest bearing demand deposits 1,184,121 Other liabilities 63,032 Total liabilities 5,317,629 Shareholders' equity 1,160,354 Total liabilities and shareholders' equity $ 6,477,983 Net Interest Income & Margin $ 105,966 4.01% Net Interest Income & Margin (tax equivalent) $ 107,524 4.07% Page 19 of 22
- 20. Prosperity Bancshares, Inc.® Notes to Selected Financial Data (Unaudited) (Dollars in thousands) Consolidated Financial Highlights NOTES TO SELECTED FINANCIAL DATA Prosperity’s management uses certain non−GAAP (generally accepted accounting principles) financial measures to evaluate its performance. Specifically, Prosperity reviews tangible book value per share, return on average tangible common equity and the tangible equity to tangible assets ratio for internal planning and forecasting purposes. Prosperity has included in this Earnings Release information relating to these non- GAAP financial measures for the applicable periods presented. Prosperity believes these non-GAAP financial measures provide information useful to investors in understanding Prosperity’s financial results and Prosperity believes that its presentation, together with the accompanying reconciliations, provides a complete understanding of factors and trends affecting Prosperity’s business and allows investors to view performance in a manner similar to management, the entire financial services sector, bank stock analysts and bank regulators. These non-GAAP measures should not be considered a substitute for GAAP basis measures and results and Prosperity strongly encourages investors to review its consolidated financial statements in their entirety and not to rely on any single financial measure. Because non-GAAP financial measures are not standardized, it may not be possible to compare these financial measures with other companies’ non-GAAP financial measures having the same or similar names. Page 20 of 22
- 21. Prosperity Bancshares, Inc.® Notes to Selected Financial Data (Unaudited) (Dollars in thousands) Three Months Ended June 30, 2009 Mar 31, 2009 Dec 31, 2008 Sept 30, 2008 June 30, 2008 Net Income $ 26,510 $ 25,478 $ 22,685 $ 15,447 $ 23,437 Period end shares outstanding 46,109 46,100 46,080 46,072 46,060 Total assets $ 8,838,951 $ 8,799,197 $ 9,072,364 $ 6,787,909 $ 6,793,734 Shareholders’ equity 1,299,095 1,280,548 1,255,106 1,229,180 1,217,605 Average shareholders’ equity 1,295,737 1,270,380 1,242,491 1,225,159 1,177,158 Goodwill and Core Deposit Intangibles (CDI) 915,739 917,152 912,850 856,890 858,927 Average goodwill and Core Deposit Intangibles 916,754 913,010 877,985 857,966 829,065 Tangible shareholders’ equity (1) 383,356 363,396 342,256 372,290 358,678 Average tangible shareholders’ equity (2) 378,983 357,370 364,506 367,193 348,093 Tangible assets (3) 7,923,212 7,882,045 8,159,514 5,931,019 5,934,807 Tangible book value per share (4) $ 8.31 $ 7.88 $ 7.43 $ 8.08 $ 7.79 Return on average tangible common equity 27.98% 28.52% 24.89% 16.83% 26.93% (5) Tangible equity to tangible assets ratio (6) 4.84% 4.61% 4.19% 6.28% 6.04% (1) Tangible shareholders' equity is calculated by subtracting goodwill and CDI from shareholders' equity. (2) Average tangible shareholders' equity is calculated by subtracting average goodwill and CDI from average shareholders' equity. (3) Tangible assets is calculated by subtracting goodwill and CDI from total assets. (4) Tangible book value is calculated by dividing tangible shareholders' equity by period end shares outstanding. (5) Return on average tangible common equity is calculated by dividing net income by average tangible shareholders' equity (annualized). (6) Tangible equity to tangible assets ratio is calculated by dividing tangible shareholders' equity by tangible assets. Page 21 of 22
- 22. Prosperity Bancshares, Inc.® Notes to Selected Financial Data (Unaudited) (Dollars in thousands) Six Months Ended June 30, 2009 June 30, 2008 Net Income $ 51,988 $ 46,375 Period end shares 46,109 46,060 outstanding Total assets $ 8,838,951 $ 6,793,734 Shareholders’ equity 1,299,095 1,217,605 Average shareholders’ equity 1,281,200 1,160,354 Goodwill and Core Deposit Intangibles (CDI) 915,739 858,927 Average goodwill and Core Deposit Intangibles 914,915 816,905 Tangible shareholders’ equity (1) 383,356 358,678 Average tangible shareholders’ equity (2) 366,285 343,449 Tangible assets (3) 7,923,212 5,934,807 Tangible book value per share (4) $ 8.31 $ 7.79 Return on average tangible common equity (5) 28.39% 27.01% Tangible equity to tangible assets ratio (6) 4.84% 6.04% (1) Tangible shareholders' equity is calculated by subtracting goodwill and CDI from shareholders' equity. (2) Average tangible shareholders' equity is calculated by subtracting average goodwill and CDI from average shareholders' equity. (3) Tangible assets is calculated by subtracting goodwill and CDI from total assets. (4) Tangible book value is calculated by dividing tangible shareholders' equity by period end shares outstanding. (5) Return on average tangible common equity is calculated by dividing net income by average tangible shareholders' equity (annualized). (6) Tangible equity to tangible assets ratio is calculated by dividing tangible shareholders' equity by tangible assets. Page 22 of 22